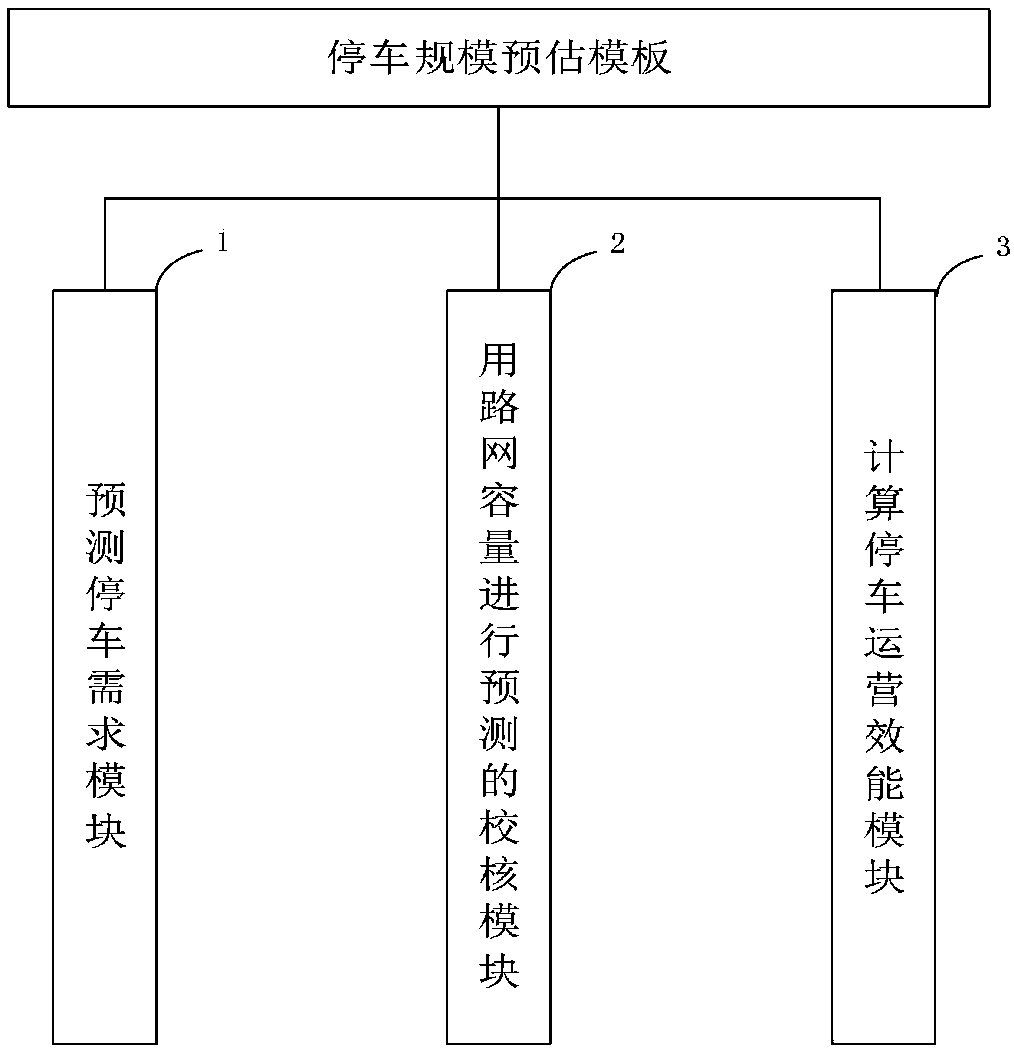
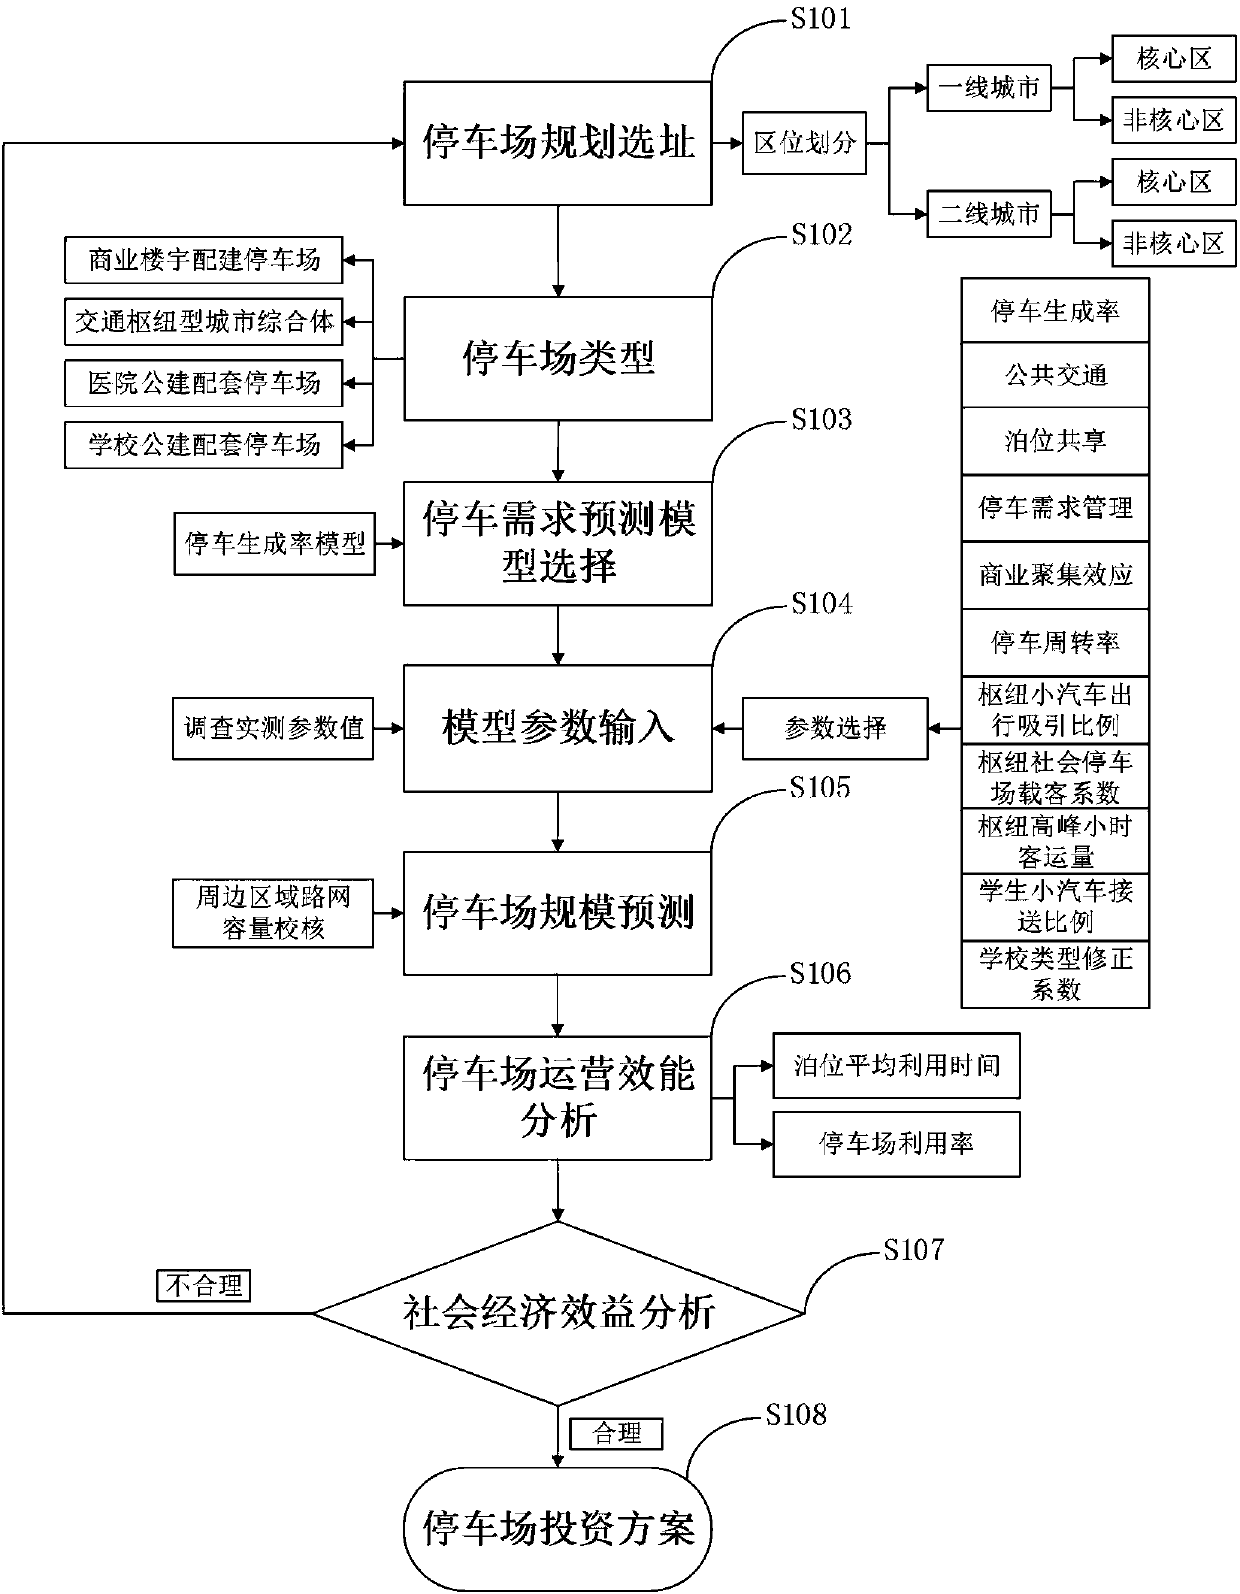
Parking scale estimation control system and implementation method
An implementation method and technology of a control system, applied in the field of parking scale estimation control system, can solve problems such as location, function, scale, design and management of parking lot benefits and other issues
- Summary
- Abstract
- Description
- Claims
- Application Information
AI Technical Summary
Problems solved by technology
Method used
Image
Examples
Embodiment 1
[0107] 1 Commercial building parking demand forecasting model:
[0108]
[0109] P represents the number of parking spaces required by commercial buildings; R i Indicates the parking generation rate of the type of land use; L i Indicates the land use index of the type of land use (building area or number of households); β indicates the correction coefficient of public transportation; η indicates the correction coefficient of the aggregation effect of commercial land; μ indicates the correction coefficient of parking demand management; Subtraction factor
[0110] 2 Parking demand parameters and values of commercial buildings
[0111] (1) Parking generation rate
[0112] Table 1-1 Value standard and reference range of parking generation rate in different urban areas
[0113]
[0114] (2) Regional public transportation
[0115] Table 1-2 Standards and value ranges for public transport correction coefficients
[0116]
[0117] When carrying out specific values, if...
Embodiment 2
[0135] 1. The hub demand forecasting model and the basic model of the parameter value range, the parking lot configuration berth forecasting model that the hub can adopt is as follows:
[0136]
[0137] In the formula, P represents the berths to be built in the social parking lot of the hub; Indicates the peak hour passenger volume of the hub; a i Indicates the proportion of the hub attracting cars; n indicates the passenger load coefficient of the hub social parking lot; C indicates the parking turnover rate of the hub social parking lot in peak hours; K indicates the peak hour coefficient of the hub
[0138] 2. The value range of each parameter
[0139] (1) Peak Hour Passenger Traffic
[0140] First obtain the current average daily passenger volume of the hub, the number of trains departing throughout the day, the peak hours of departure, and the number of trains dispatched in peak hours, and calculate the proportion of passengers dispatched in peak hours and the pas...
Embodiment 3
[0154] 1. School parking demand model
[0155] This model forecast mainly considers the temporary parking vehicles generated by parents picking up and dropping off children when going to and from school, so the calculation model for the number of parking spaces is established based on the number of students in school:
[0156]
[0157] In the formula: P represents the demand number of berths; N 1 Indicates the number of teaching staff in the school; N 2 Indicates the number of students in the school; B indicates the per capita car travel volume of faculty and staff; K indicates the proportion of students who are picked up by car; C 1 Indicates the staff parking turnover rate; C 2 Indicates the temporary parking turnover rate; α indicates the school type correction coefficient; β indicates the public transportation correction coefficient; φ indicates the berth sharing reduction coefficient.
[0158] 2. Value range of demand forecast model parameters
[0159] Table 3-1 Va...
PUM
 Abstract
Description
Claims
Application Information
 - R&D
- Intellectual Property
- Life Sciences
- Materials
- Tech Scout
- Unparalleled Data Quality
- Higher Quality Content
- 60% Fewer Hallucinations
Browse by: Latest US Patents, China's latest patents, Technical Efficacy Thesaurus, Application Domain, Technology Topic, Popular Technical Reports.
© 2025 PatSnap. All rights reserved.Legal|Privacy policy|Modern Slavery Act Transparency Statement|Sitemap|About US| Contact US: help@patsnap.com


