A tobacco market big data visualization method based on space-time grids
A market data and big data technology, applied in the field of spatiotemporal data mining and tobacco market big data analysis, can solve the problem of rare big data, and achieve the effect of reducing data dimension, high computing efficiency, and protecting user privacy information.
- Summary
- Abstract
- Description
- Claims
- Application Information
AI Technical Summary
Problems solved by technology
Method used
Image
Examples
Embodiment 1
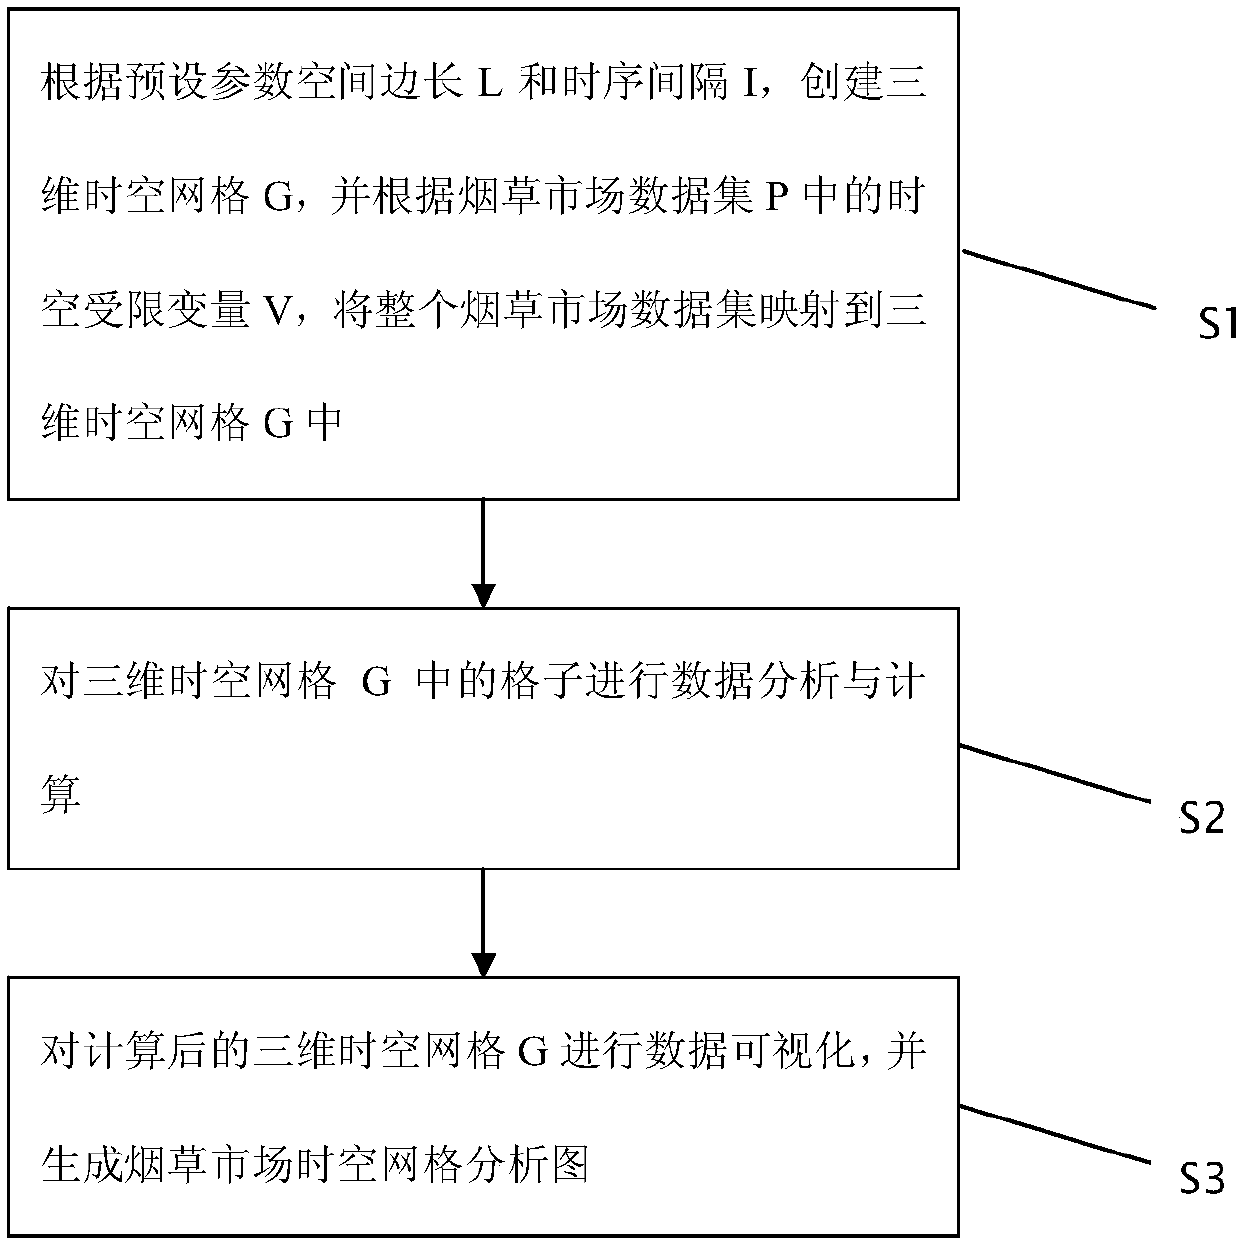
[0037] This embodiment provides a method for visualization of tobacco market big data based on spatio-temporal grid, such as figure 1 shown, including:
[0038] S1: Create a three-dimensional space-time grid G according to the preset parameter space side length L and time series interval I, and map the entire tobacco market data set to the three-dimensional space-time grid G according to the time-space limited variable V in the tobacco market data set P middle.
[0039] S2: Perform data analysis and calculation on the grids in the three-dimensional space-time grid G.
[0040] S3: Perform data visualization on the calculated three-dimensional space-time grid G, and generate a space-time grid analysis diagram of the tobacco market.
[0041] In the above scheme, first construct a space-time grid structure of the tobacco market; then perform data analysis and calculation on the space-time grid; and finally visualize the space-time grid. This method can integrate massive mar...
Embodiment 2
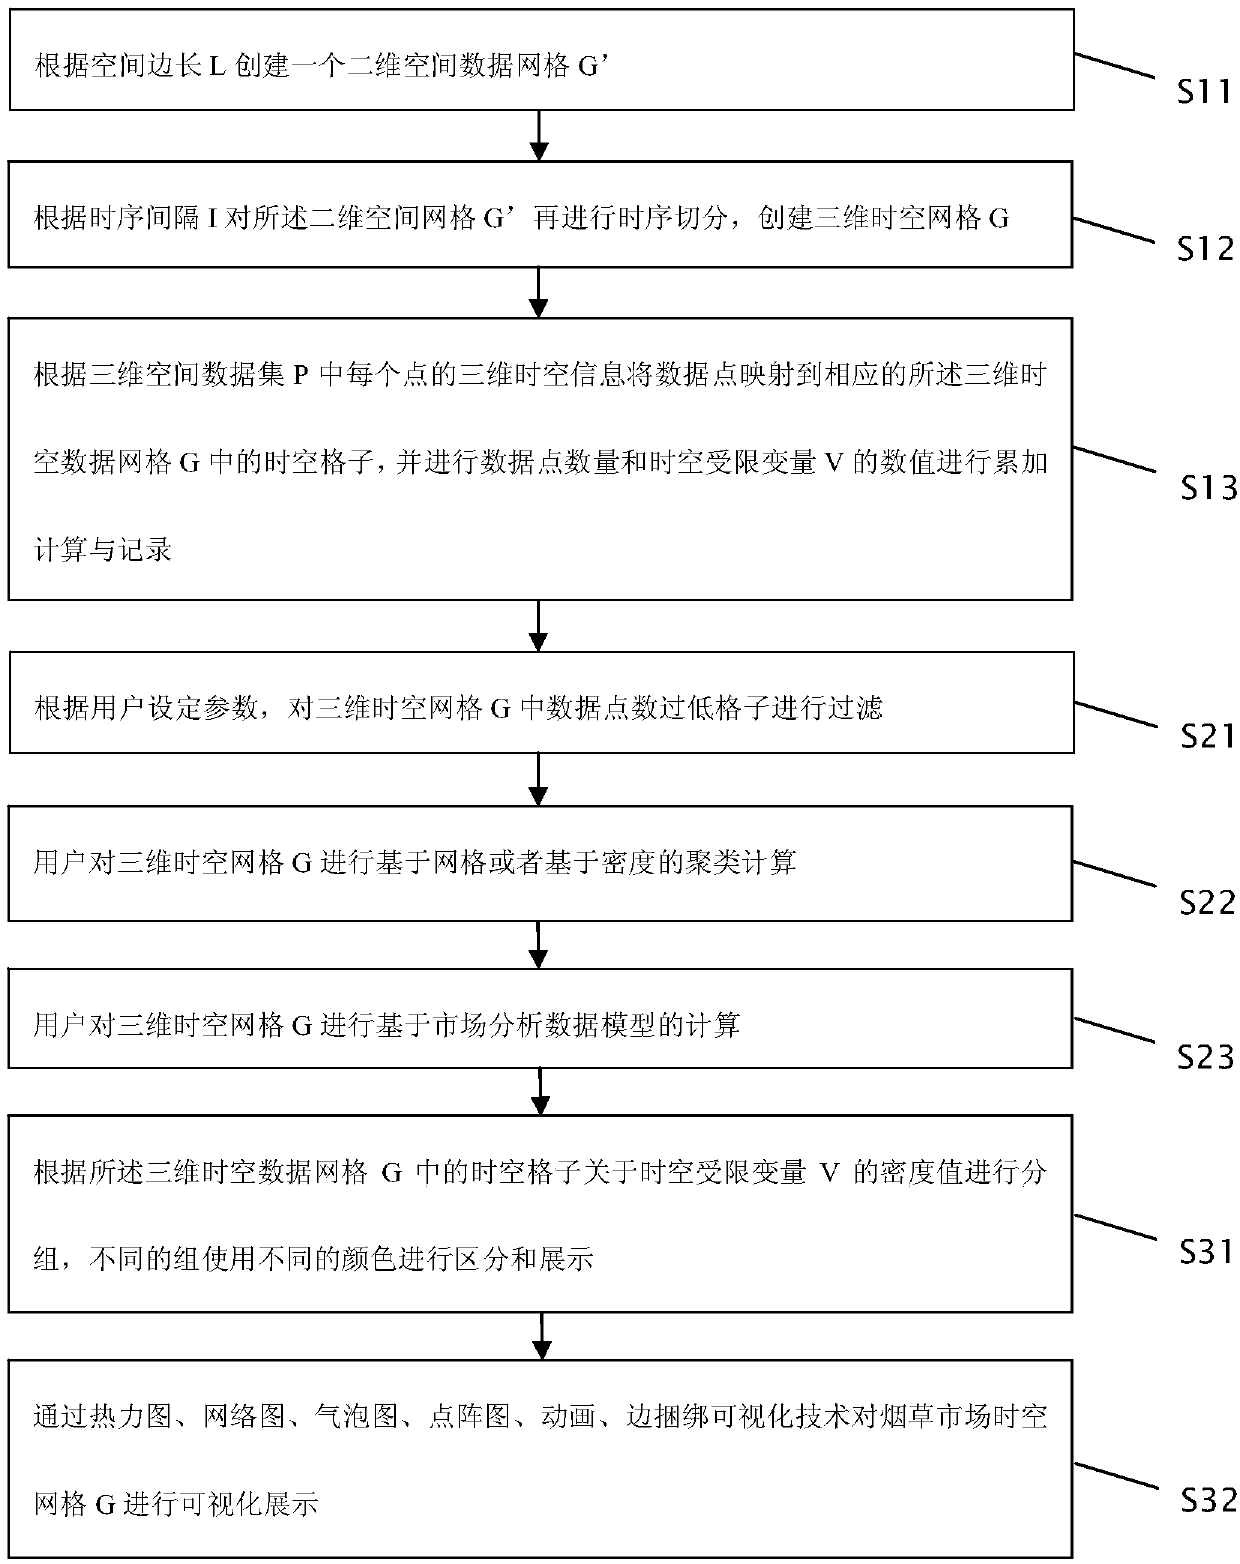
[0043] In the above step S1, the method for creating the space-time grid of the tobacco market can be decomposed into three steps. An implementation is provided in this embodiment, including:
[0044] Specifically, such as figure 2 shown, including the following steps:
[0045] S11: Create a two-dimensional spatial data grid G' according to the spatial side length L;
[0046] S12: Perform time-series segmentation on the two-dimensional spatial grid G' according to the time-series interval I, to create a three-dimensional space-time grid G;
[0047] S13: According to the three-dimensional space-time information of each point in the three-dimensional space data set P, the data points are mapped to the corresponding space-time grids in the three-dimensional space-time data grid G, and the number of data points and the value of the space-time limited variable V are calculated. Cumulative calculation and recording;
[0048] In the above step S2, the data analysis and calculati...
Embodiment 3
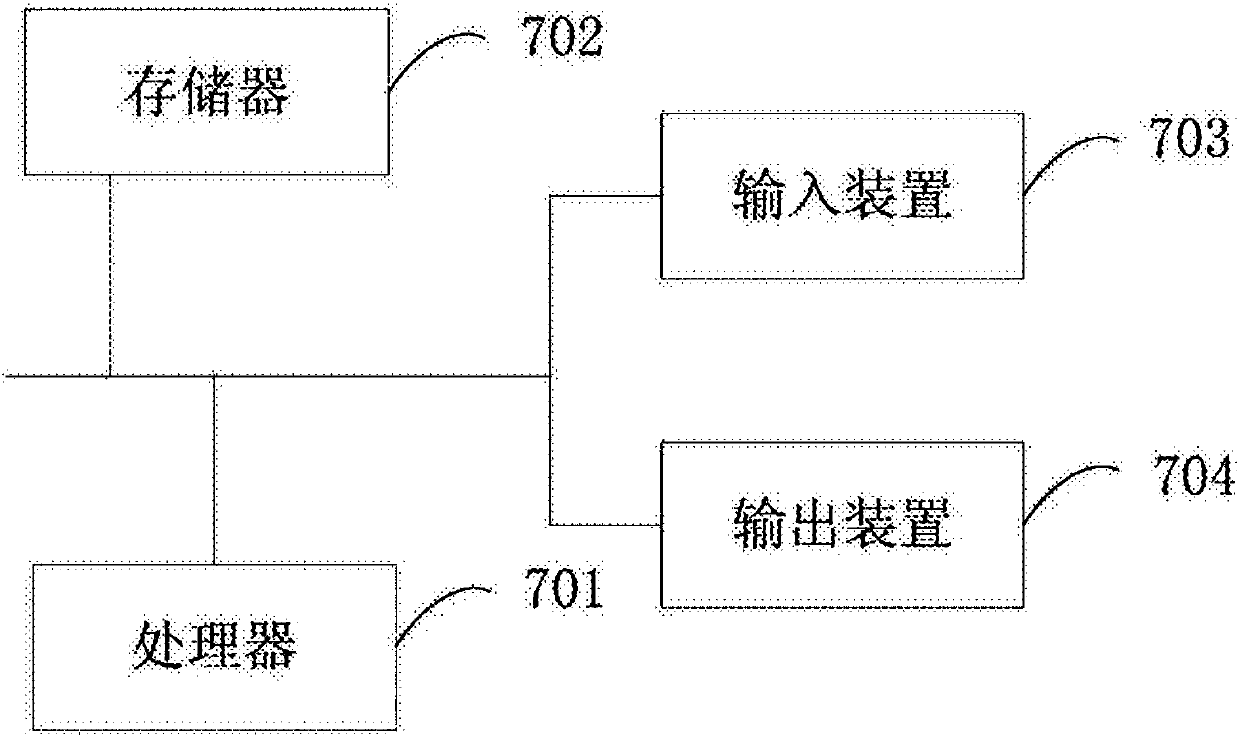
[0058] Figure 4 It is a schematic diagram of the hardware structure of the electronic device for visualization of big data in the tobacco market based on the spatio-temporal grid provided in this embodiment, such as Figure 4 As shown, the equipment includes:
[0059] one or more processors 701 and memory 702, Figure 4 A processor 701 is taken as an example.
[0060] The device for realizing big data visualization of the tobacco market based on spatio-temporal grid may also include: an input device 703 and an output device 704 .
[0061] The processor 701, the memory 702, the input device 703 and the output device 704 may be connected via a bus or in other ways, Figure 4 Take connection via bus as an example.
[0062] The memory 702, as a non-volatile computer-readable storage medium, can be used to store non-volatile software programs, non-volatile computer-executable programs and modules, such as the implementation of the space-time grid-based tobacco Program instruc...
PUM
 Abstract
Description
Claims
Application Information
 - R&D
- Intellectual Property
- Life Sciences
- Materials
- Tech Scout
- Unparalleled Data Quality
- Higher Quality Content
- 60% Fewer Hallucinations
Browse by: Latest US Patents, China's latest patents, Technical Efficacy Thesaurus, Application Domain, Technology Topic, Popular Technical Reports.
© 2025 PatSnap. All rights reserved.Legal|Privacy policy|Modern Slavery Act Transparency Statement|Sitemap|About US| Contact US: help@patsnap.com


