

Voltage flicker measuring method for wind generating set
A technology for wind power generators and voltage flicker, which is applied to measuring devices, measuring electrical variables, frequency measuring devices, etc., and can solve problems such as large measurement errors and inability to obtain flicker time and frequency and amplitude of flicker voltage
- Summary
- Abstract
- Description
- Claims
- Application Information
AI Technical Summary
Problems solved by technology
Method used
Image

Examples
example 1
[0089] Example 1: Flicker caused by wind turbines
[0090] Set the simulation signal according to formula (20) or formula (21), and conduct a simulation analysis on the accuracy of the measurement results of flicker caused by the method proposed in this paper. The sampling rate f of the simulated signal in this example s 2000Hz
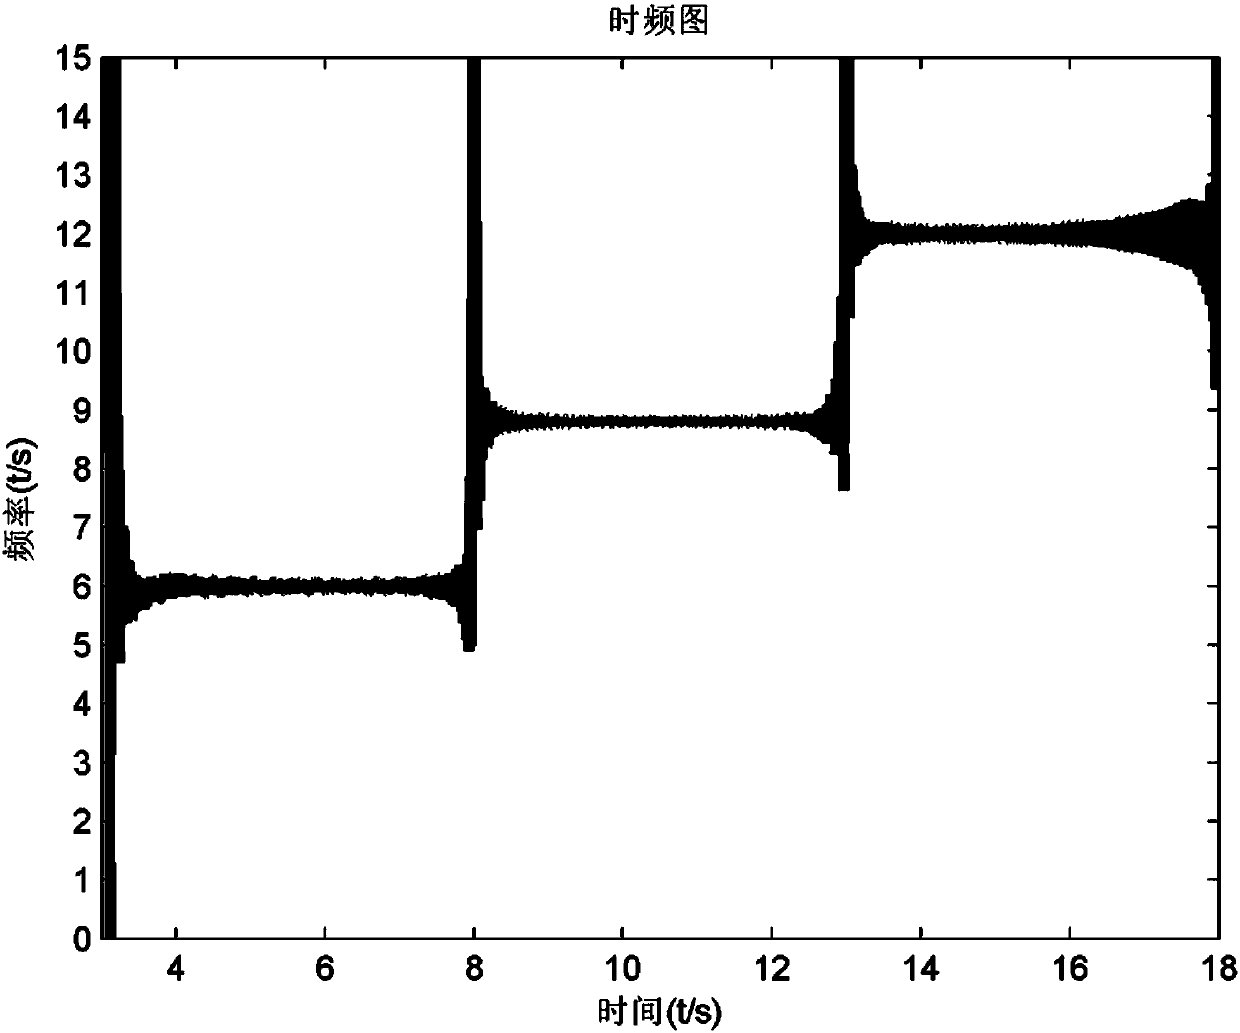
[0091] From 3s to 18s, three flicker changes with frequencies of 6Hz, 8.8Hz, and 12Hz occurred respectively. The relationship between the frequency, amplitude and time of the flicker voltage is as follows: Figure 3a and Figure 3b shown.
[0092] The standard parameters of S(t)=1 within 25Hz given by the IEC standard are selected to simulate and analyze the short-term severity of flicker caused by wind turbines. Based on the method proposed in this paper, the short-term flicker severity errors at different frequencies are as follows: Figure 3c shown.
[0093]
[0094]
[0095] In formula (20), A 0 is the fundamental wave voltage amplitu...
example 2
[0101] Example 2: Harmonics caused by wind turbines
[0102] In order to verify the accuracy of the method proposed in this paper to detect the harmonics caused by wind turbines, the harmonic signal is set according to formula (22). The sampling rate f of the simulated signal in this example s 4000Hz
[0103] Harmonics of different times are set to occur at different times. Since the energy of the fundamental wave is much greater than the energy of the harmonics, it is necessary to perform FFT filtering on the harmonic signals truncated by the 4 smallest sidelobe Nuttall windows to filter out the 50Hz fundamental wave. Then find out the frequency and amplitude of the harmonic through HHT. The harmonic measurement results of the simulation experiment are shown in Fig. 4. in Figure 4a is the relationship between time and frequency of the harmonic signal, Figure 4b is the relationship between the time and amplitude of the harmonic signal.
[0104]
[0105] In formula (...
example 3
[0107]Example 3: Voltage swell caused by wind turbines
[0108] Uncertainty of wind speed leads to unstable output current and power of grid-connected wind turbines, which causes voltage swell in grid voltage. The simulation signal is set according to formula (23), and the accuracy of the algorithm proposed in this paper to detect the voltage swell caused by the wind turbine is simulated and verified. The sampling rate f of the simulated signal in this example s 2000Hz
[0109] The grid voltage has two 5% voltage swells at different times. The measurement results of the voltage swell caused by the wind turbine are shown in Fig. 5. Figure 5a is the relationship between time and frequency, Figure 5b is the relationship between time and amplitude.
[0110]
[0111]
[0112]
[0113] In formula (23), f s = 2KHz; A 0 is the fundamental wave voltage amplitude of the power grid, is the initial phase angle, φ 0 =0; the simulation time is 10s.
[0114] It can be s...
PUM
 Abstract
Description
Claims
Application Information