Visual graph system of data blood relations in data management

A blood relationship and graphics system technology, applied in the direction of electrical digital data processing, special data processing applications, database indexing, etc., can solve the lack of settings, lack of description of data extraction methods and loading strategies, and visual graphic deviation of data blood relationship And other issues

Inactive Publication Date: 2018-06-29
江苏数加数据科技有限责任公司
View PDF6 Cites 15 Cited by
  • Summary
  • Abstract
  • Description
  • Claims
  • Application Information

AI Technical Summary

Problems solved by technology

On the one hand, this invention lacks the setting of various rules, which makes the judgment of cleaning, conversion and destruction prone to problems. On the other ...

Method used


Image

  • Visual graph system of data blood relations in data management
  • Visual graph system of data blood relations in data management
  • Visual graph system of data blood relations in data management

Examples


Embodiment 1

[0048] Visualization, from a technical concept point of view, is the theory, method and technology of using computer graphics and image processing technology to convert data into graphics or images and display them on the screen for interactive processing. The significance of visualization is to quickly and quickly transmit signals, visually and intuitively display data and their relationships, and facilitate users to discuss, explore the essence, and find problems.

[0049] Visualization is especially important for data kinship. Only through visualization can the blood relationship be clearly displayed in front of users.

[0050] According to the characteristics of the blood relationship of the data, we designed the visual graph of the blood relationship of the data.

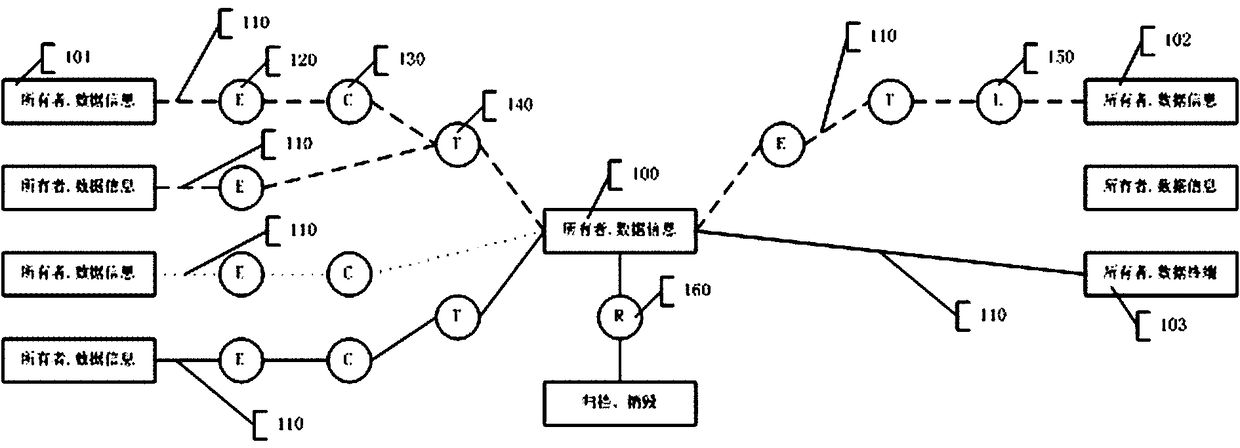
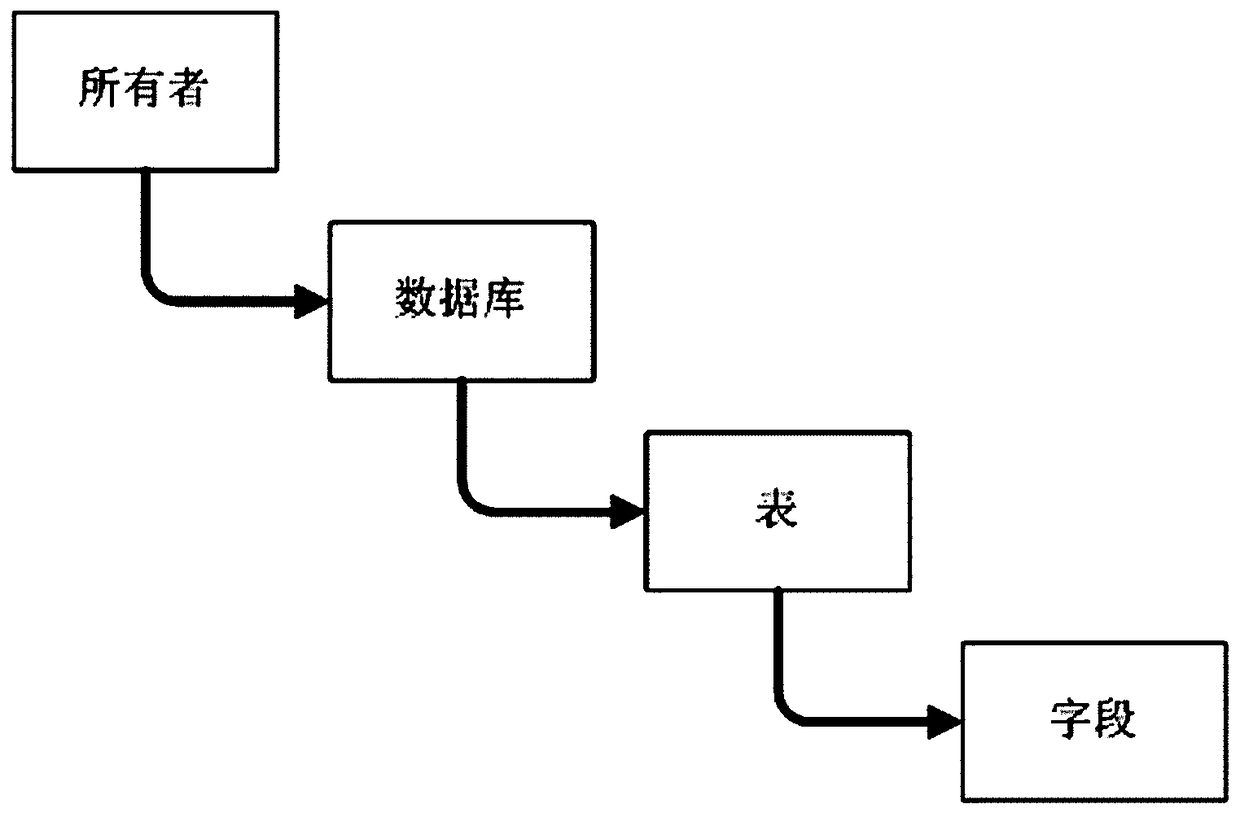
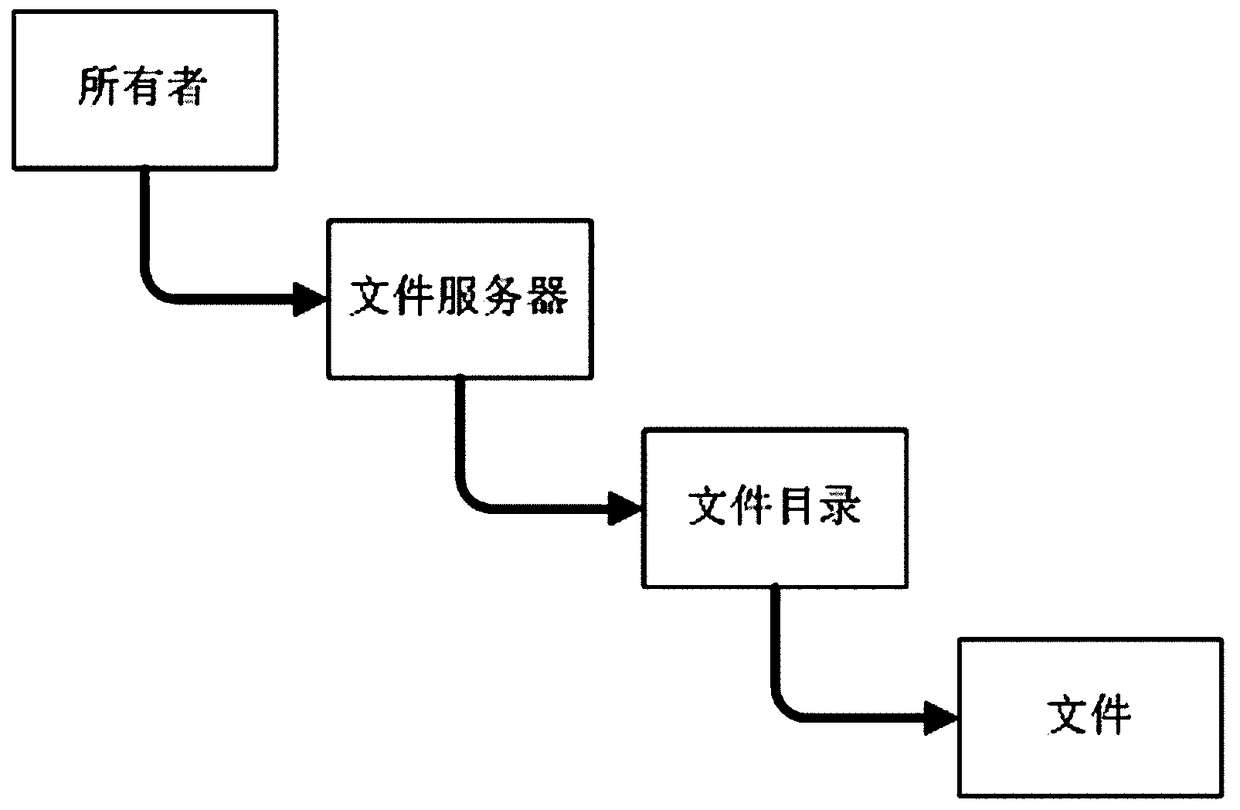
[0051] According to different meanings, the visual graph of blood relationship includes 5 kinds of visual elements, which are distributed in different positions of the graph. like figure 1 As shown, the visu...

Embodiment 2

[0082] The visualization of blood relationship is a relatively complicated process. At present, there are no formed visualization graphics for reference. The blood relationship visualization graphic component we designed can clearly express the blood relationship of data, which is very helpful for the organization's data governance.

[0083] The role of data blood relationship can be summed up in the following aspects:

[0084] 1. Data traceability

[0085] Tracing to the source refers to exploring the root and source of things. The data we analyze and process may come from a wide range of sources, including government data, Internet data, data obtained from third parties through data transactions, and data we own. The quality of data from different sources is uneven, and the impact on the results of analysis and processing is also different. When the data is abnormal, we need to be able to trace the cause of the abnormality and control the risk at an appropriate level.

[...

Embodiment 3

[0097] The cleaning rules are as follows:

[0098] 1. Determine whether there are Chinese characters in the content, if there are Chinese characters, return true, otherwise return false;

[0099] 2. Determine whether the content is an integer, if it is an integer, return true, otherwise return false;

[0100] 3. Determine whether the content is a percentage, if it is a percentage, return true, otherwise return false;

[0101] 4. If the Json string is not [] and the deserialization is successful, return true, otherwise return false;

[0102] 5. Determine whether the content is separated by the characters of the input parameters, if it is separated by the characters of the input parameters, return true, otherwise return false;

[0103] 6. Determine whether the value is within the given value range, if it is within the given value range, return true, otherwise return false;

[0104] 7. Account type verification, if the value is within the code value range, return TRUE; otherwi...


PUM


Abstract

The invention provides a visual graph system of data blood relations in data management. The system comprises an information node and also comprises the following modules: a data flow line which refers to the path of data flow and at least one node of an extraction strategy node, a cleaning rule node, a conversion rule node, a loading rule node and a processing rule node. The extraction strategy node is used for indicating how data is extracted; the cleaning rule node is used for showing screening criteria of the data in the data flow process; the conversion rule node is used for showing changing criteria of the data in the data flow process; the loading rule node is used for indicating how the data is loaded; the processing rule node is used for showing data archiving or destruction. According to the system, migration and flow of data can be clearly understood through blood relations of different levels, and the system provides the basis for data value evaluation and data management.

Description

technical field [0001] The invention relates to the field of enterprise portraits, in particular to a visual graphics system for blood relationship of data in data governance. Background technique [0002] In human society, blood relationship refers to the interpersonal relationship arising from marriage or childbirth. Such as the relationship between parents and children, the relationship between brothers and sisters, and other kinship relationships derived from it. It is an innate and innate relationship of human beings. It has existed since the beginning of human society, and it is the earliest social relationship formed. [0003] In today's big data era, data is growing explosively, and massive amounts of various types of data are being generated rapidly. These huge and complex data information, through marriage fusion, conversion transformation, circulation and circulation, generate new data and converge into an ocean of data. [0004] From the generation, processing...

Claims


Application Information

Patent Timeline
IPC IPC(8): G06F17/30
CPCG06F16/215G06F16/22G06F16/254G06F16/26
Inventor 朱科支欧阳翔
Owner 江苏数加数据科技有限责任公司
Why Eureka
Try Eureka