Campus big data-oriented visual analysis method

An analysis method and big data technology, applied in other database browsing/visualization, other database retrieval, electronic digital data processing, etc., can solve the problem of lack of good human-computer interaction analysis methods, inability to systematically support management decisions, and low data analysis efficiency And other issues

Active Publication Date: 2018-08-24
湖南工商大学
View PDF3 Cites 16 Cited by
  • Summary
  • Abstract
  • Description
  • Claims
  • Application Information

AI Technical Summary

Problems solved by technology

It can solve the problems of low data analysis efficiency in modern education management, insufficient connection between information and business, failure to systematically support management decision-making, lack of good human-computer interaction analysis methods, etc.

Method used


Image

  • Campus big data-oriented visual analysis method
  • Campus big data-oriented visual analysis method
  • Campus big data-oriented visual analysis method

Examples


Embodiment 1

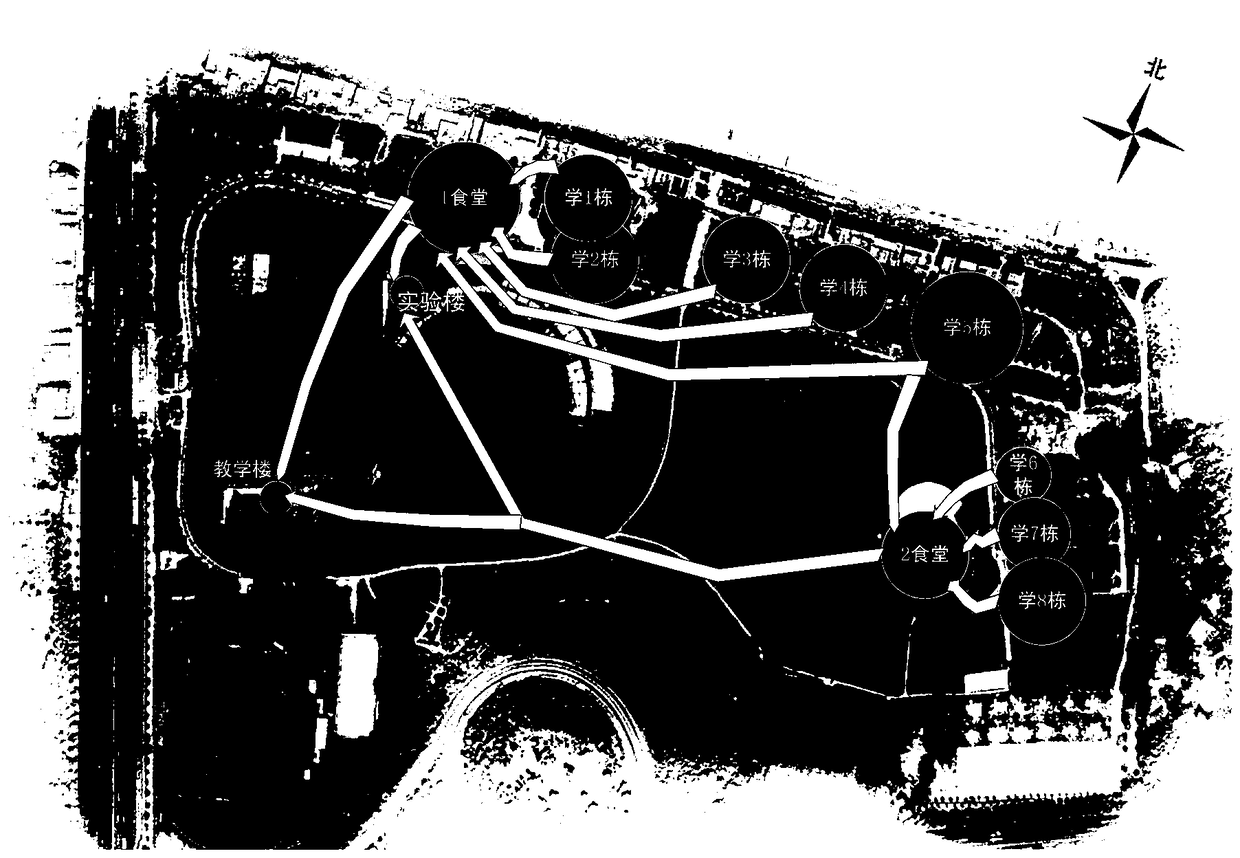
[0037] Example 1 Visual representation and analysis of the temporal and spatial distribution and flow direction of students in a college in the morning

[0038] see in conjunction figure 1 , using the heat flow map for analysis, the method is as follows:

[0039] Step S01. Divide the original campus big data of a university collected in the original information system, including student information, wireless network and mobile terminal data, campus card circulation data, and educational affairs scheduling data, into the environmental service category, and classify these The campus big data is reclassified by structured data, semi-structured data and unstructured data to distinguish different forms of big data; then it is transmitted and stored from the original information system to the new distributed system based on Hadoop in the database;

[0040] Step S02, extract the classified data from the database, and perform data preprocessing on the classified data, the preprocess...

Embodiment 2

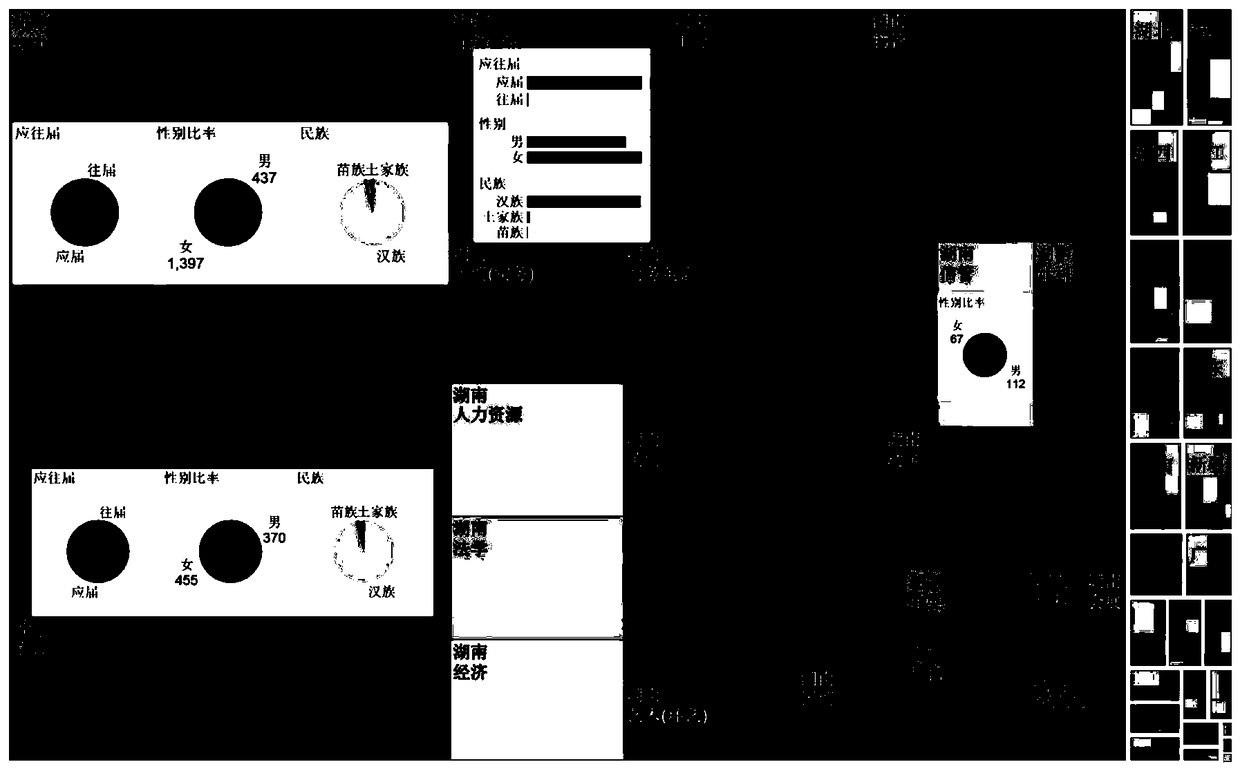
[0045] Example 2 Visual representation and analysis of the real enrollment data of a university

[0046] see in conjunction figure 2 , using the embedded hierarchical tree diagram to realize the visual representation and analysis of the hierarchical data of the real enrollment data, the specific steps are as follows:

[0047] Step S01. Divide the original campus big data collected in the original information system, including student information and enrollment information, into the teaching service category, and divide the campus big data into structured data, semi-structured data and unstructured data. Classify the data again to distinguish different forms of big data; then transfer and store from the original information system to the new distributed database based on Hadoop;

[0048] Step S02, extract classified data from the database, and perform data preprocessing on the extracted data to clean up unsuitable data, construct new attributes and presentation methods, stand...

Embodiment 3

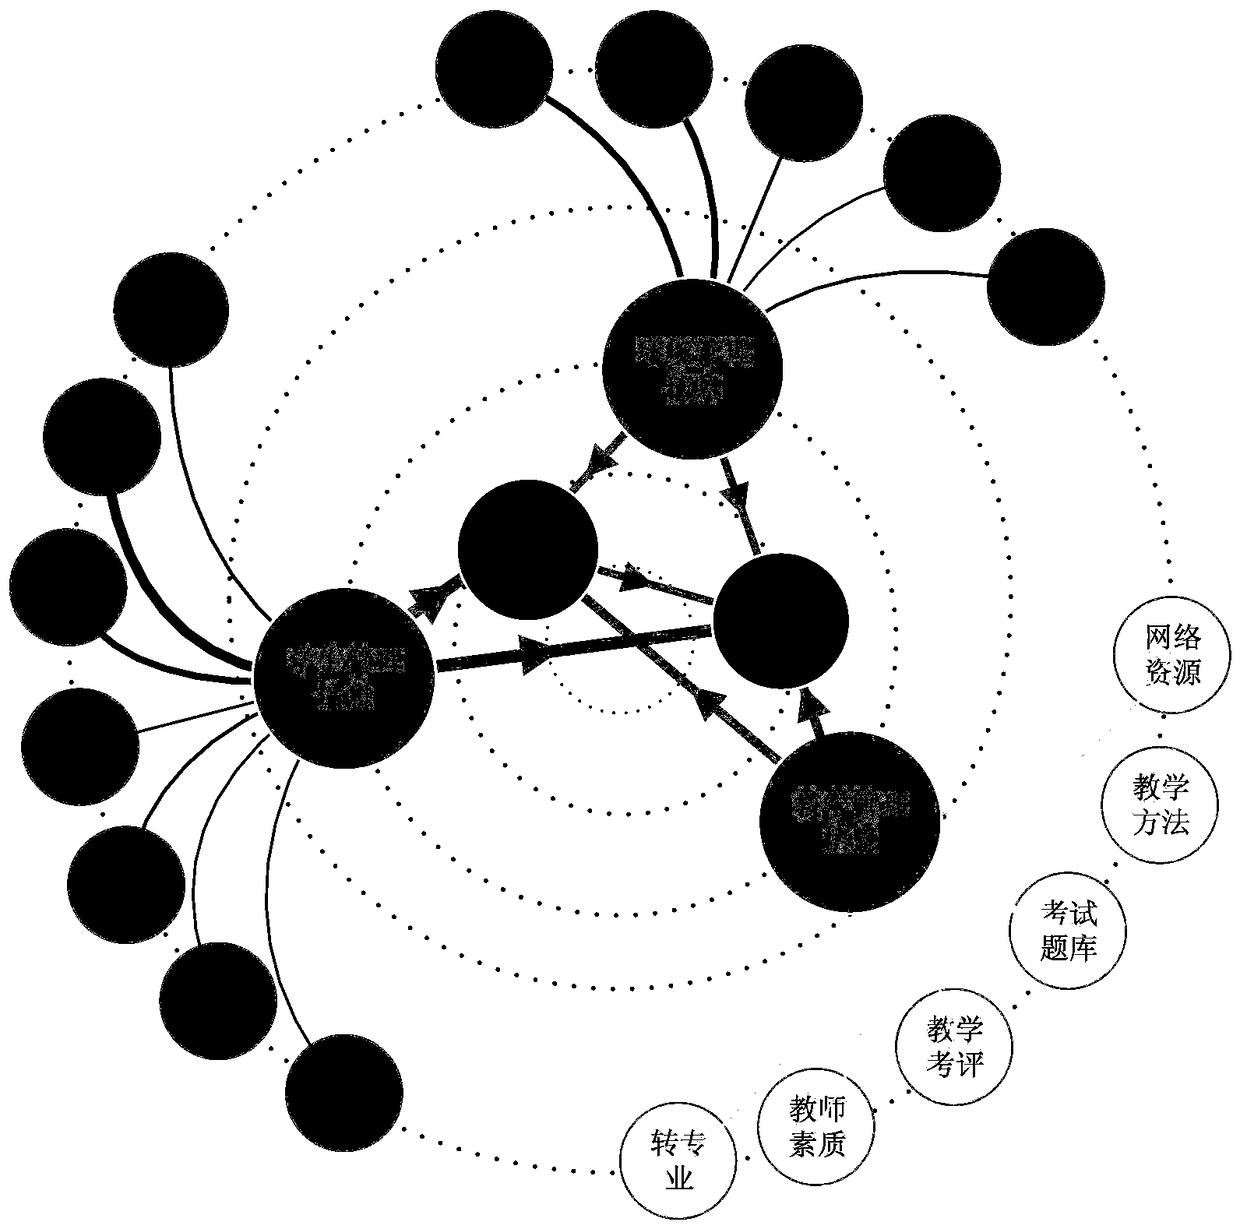
[0054] Example 3 Realize the visual representation and analysis of event correlation for the real management data of a university

[0055] see in conjunction image 3, using the event aggregation graph to analyze the real management data of a university, the specific steps are as follows:

[0056] Step S01. Divide the real management original campus big data of a university collected in the original information system, including school management service data (student management, educational management, logistics management), management files, management web pages, etc., into the management service category, and Classify these campus big data again into structured data, semi-structured data and unstructured data to distinguish different forms of big data; then transfer and store from the original information system to the new Hadoop-based architecture In a distributed database;

[0057] Step S02, collect data from the database, and perform data preprocessing on the collected...


PUM


Abstract

The invention discloses a campus big data-oriented visual analysis method. The method comprises the steps of classifying collected original campus big data into an environment service class, a teaching service class, a management service class and the like according to functions and characteristics, and performing transmission and storage; performing preprocessing of cleaning, conversion, integration and the like to form a campus big data basic platform; and according to data characteristics and an application direction, selecting a proper data processing algorithm and a visual expression mode, fusing the data characteristics, discovering knowledge hidden in the big data, and proposing a thermodynamic flow map-based smart environment service, embedded tree graph-based smart teaching service and event aggregation graph-based smart management service big data visual analysis method, thereby assisting in smart teaching, smart management and smart decision. Through the method, various information in the campus big data can be comprehensively analyzed and mined; a conventional data chart mode is abandoned; and more effective decision channels are opened up for school work in various aspects through an intuitive and novel visual graph.

Description

technical field [0001] The invention relates to the field of data visualization analysis, in particular to an intelligent data visualization analysis method for campus big data. Background technique [0002] With the continuous development of modern education, teachers, students, and managers have accumulated massive amounts of data in the process of teaching, life, and management, and it is still growing at a faster rate. Data has become an increasingly important intangible asset for schools. How to display, analyze, and mine data has become the driving force and foundation for the rapid development of the school. As a basic platform for the deep integration of "Smart Campus" and "Internet +", campus big data visualization analysis uses the Internet of Things and cloud computing to emphasize the acquisition, understanding and intelligent processing of various data such as teaching, scientific research, campus life and management. . It can solve the problems of low data an...

Claims


Application Information

Patent Timeline
Patent Type & Authority Applications(China)
IPC IPC(8): G06F17/30
CPCG06F16/904Y02D10/00
Inventor 张胜赵珏
Owner 湖南工商大学
Why Eureka
Try Eureka