
Multi-station linkage rating curve fitting method

A relationship curve and flow coefficient technology, applied in image data processing, instrumentation, climate change adaptation, etc., can solve problems such as difficulty in roping curve alignment, affecting the accuracy of flood forecasting, and inability to update measured data, reaching the technical level and forecasting. The effect of improved accuracy

Active Publication Date: 2018-08-28
POWERCHINA ZHONGNAN ENG
View PDF9 Cites 6 Cited by
  • Summary
  • Abstract
  • Description
  • Claims
  • Application Information

AI Technical Summary

Problems solved by technology

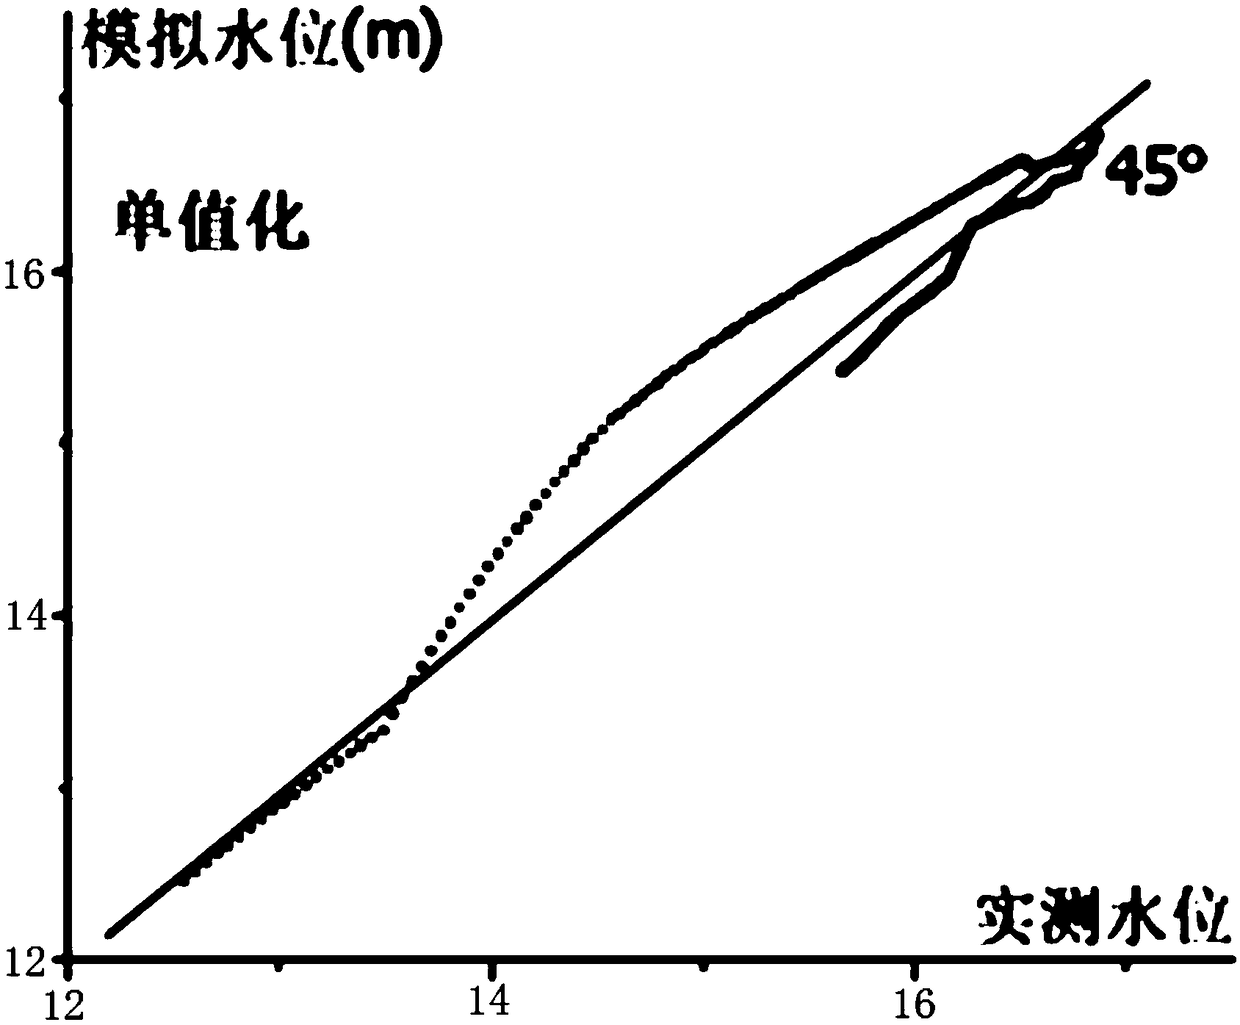
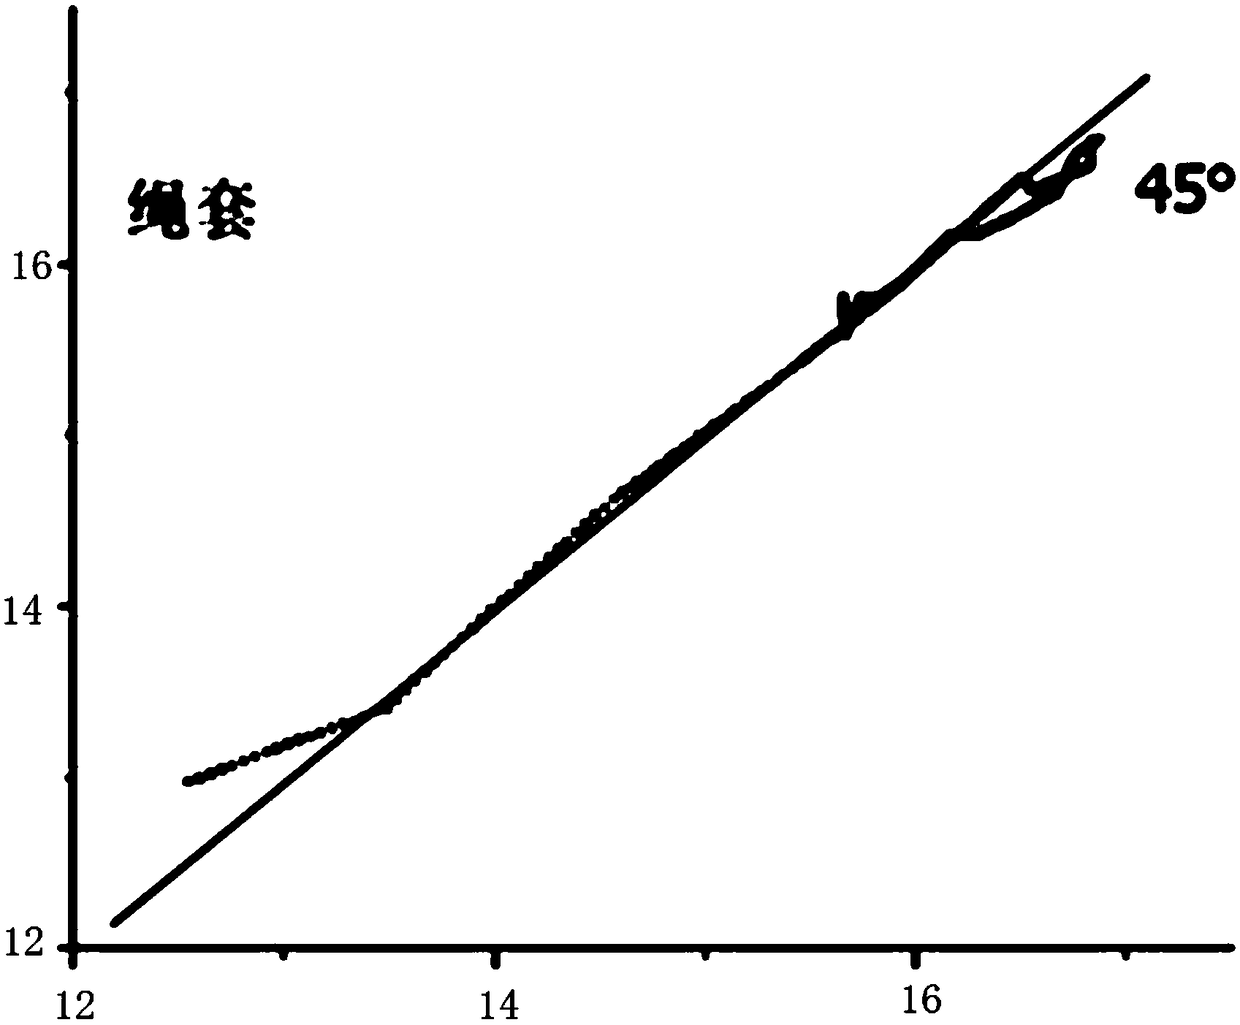
However, in the river section where the fluctuation of the flood is obviously affected, it is difficult to determine the line of the noose curve, and it is generally necessary to go through trial and error
[0006] Whether it is the traditional single-value method or the rope loop method, they can only set the line in advance on the existing historical data. In the application of real-time flood forecasting, the parameters and equation structures in the above two methods are fixed, and the latest measured data cannot be integrated. Updates applied to level-flow relationships
Therefore, the above two methods only consider the conversion relationship between the water level and flow of the test site in the fixed forecast period, only consider the historical data of the current test site, and do not consider other factors affecting the current test site. In the application of real-time flood forecasting, both will affect the accuracy of flood forecasting

Method used


Image

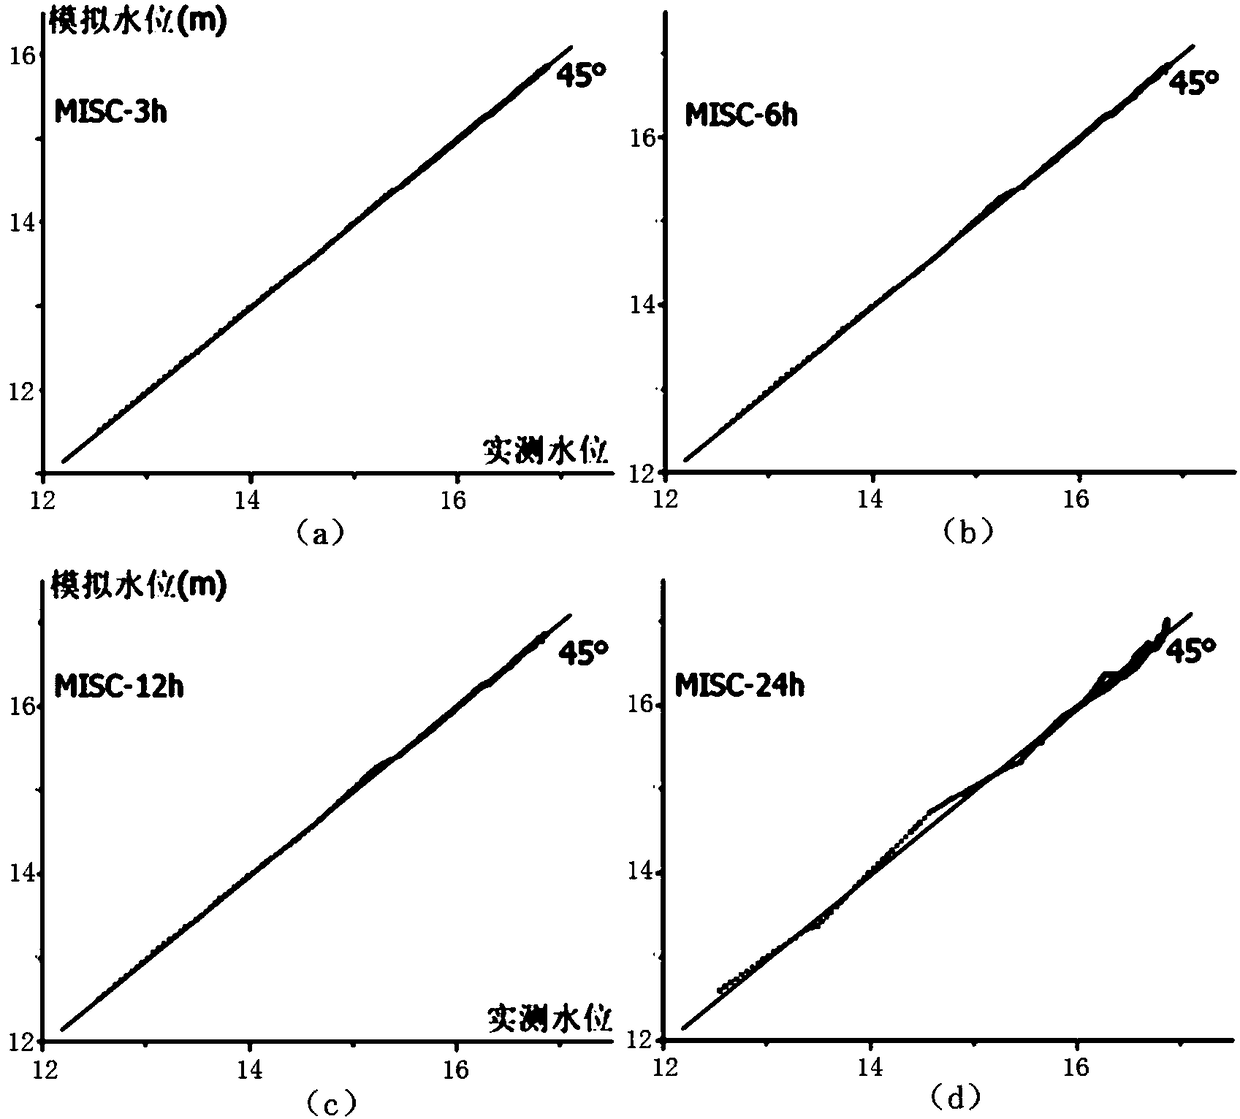
  • Multi-station linkage rating curve fitting method
  • Multi-station linkage rating curve fitting method
  • Multi-station linkage rating curve fitting method

Examples


Embodiment Construction

[0024] In this embodiment, the multi-station linkage water level flow relationship curve fitting method of the present invention includes steps:

[0025] A. Selected test site:

[0026] Xiaoliuxiang Hydrological Station was established in April 1981. It is located in Xiaoliuxiang Town, Mingguang City, Anhui Province. It is the last control station for the main flow of the Huaihe River into Hongze Lake, with a drainage area of ​​123,950km 2 , 100m downstream is the Bogang river diversion project, and 630km downstream is Hongze Lake. Affected by the additional gradient, the relationship between water level and flow at Xiaoliuxiang Station presents a complicated counterclockwise noose curve. Because the fluctuation rate of each flood is different, the corresponding noose curve is also different in size, and the parameters of each flood noose curve are different. If there is a large difference, it is difficult to determine the relationship between water level and flow. In additi...


PUM


Abstract

The invention discloses a multi-station linkage rating curve fitting method, and the method comprises the steps: selecting a test station; determining a flood forecast period l of the test station; constructing a rating curve (shown in the description) of the test station, wherein t is a sampling moment, N is the number of actual measurement stations of the upstream side of the test station, i isthe serial number of the actual measurement stations of the upstream side of the test station, Z<t+l>, Q<t+l> and a<t+l> are respectively are a water level predicted value, a flow predicted value anda flow coefficient of the test station in the forecast period, a<i, t>, Q<i, t>, Ab<i, t> and Z<i, t> are respectively a flow coefficient, a flow value, a water level coefficient and a water level value of the i-th actual measurement station at a moment t, c is an offset of the flow of the test station relative to the water level in the forecast period, Epsilon is a remainder term and approaches to an infinitesimal value, and l is nit greater than the time lag of a flood wave from the upstream side to a downstream side. According to the invention, the real-time stage-discharge relation of thetest station is represented as a function of the water level of the upstream station and the flow at a historical moment, and the method can obtain the more precise result in the real-time flood forecast applications in different forecast periods, and provides a real-time flood forecast level and the forecast precision.

Description

technical field [0001] The invention belongs to the field of water level and flow relationship forecasting of hydrological stations, and in particular relates to a multi-station linkage water level and flow relationship curve fitting method. Background technique [0002] The relationship between water level and flow is an important content in the analysis of flood components and real-time flood forecasting. There are many factors that affect the relationship between water level and flow. It is not only affected by geometric factors such as river scouring and silting, blocking, but also by flood fluctuation trends and tributary water exchange. The influence of hydraulic factors, in the study of the relationship between water level and flow in plain rivers, factors such as backwater jacking and flood storage areas have a significant impact on the relationship between water level and flow. Due to the significant uncertainty of various factors, the relationship between water lev...

Claims


Application Information

Patent Timeline
IPC IPC(8): G06T11/20G06F17/50
CPCG06T11/203G06F30/20Y02A10/40
Inventor 刘代勇邓思滨贺丽阳黄佩瑾王伟费如君彭亚兰
Owner POWERCHINA ZHONGNAN ENG
Learn More