Automatic drawing method for geographical indentation of electrical power system diagram

A power system and automatic drawing technology, applied in the fields of electrical digital data processing, data processing applications, special data processing applications, etc., can solve the problem of not being able to objectively display the wiring conditions of equipment in the station, unable to reflect the geographical direction information of equipment, and drawing drawings. Different styles, etc., to achieve the effect of clear and beautiful layout of drawings, reduction of human resource costs, and accurate layout of equipment

Active Publication Date: 2018-09-07
FOSHAN POWER SUPPLY BUREAU GUANGDONG POWER GRID
View PDF5 Cites 13 Cited by
  • Summary
  • Abstract
  • Description
  • Claims
  • Application Information

AI Technical Summary

Problems solved by technology

However, the efficiency of traditional manual drawing is slow, requiring a large number of drafters to maintain manually, the cost of human resources is high, the drawings are not updated in time, and there is no unified standard for graphics elements and drawing specifications, resulting in different drawing styles and equipment display. It is confusing, and manual drawing is prone to errors, which brings safety hazards to line operation and maintenance; the force-directed algorithm is used to automatically draw the power system diagram. If there are a large number of power equipment in the drawing, the algorithm needs to iteratively and cyclically process the positional relationship between the equipment. The graphing efficiency is slow, taking up more computing resources, and the number of devices participating in the layout is inversely proportional to the final layout effect, that is, the more the number of devices, the less ideal the layout effect; The horizontal and vertical layouts of the system diagrams used by power supply enterprises are inconsistent, and the geographical direction information of the equipment cannot be reflected in the drawings; the wiring situation of the equipment in the station building cannot be objectively displayed

Method used


Image

  • Automatic drawing method for geographical indentation of electrical power system diagram

Examples


Embodiment 1

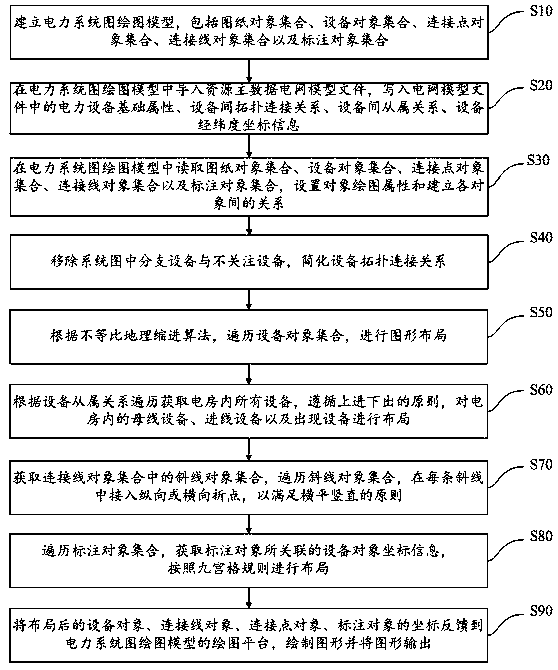
[0045] like figure 1 Shown is the flow chart of the geographical indentation automatic drawing method of the power system diagram of the present invention, comprising the following steps:

[0046] S10. Establish a drawing model of the power system diagram, including a collection of drawing objects, a collection of equipment objects, a collection of connection point objects, a collection of connection line objects, and a collection of label objects;

[0047] S20. Import the data resource master data grid model file into the power system diagram drawing model, write the basic attributes of the power equipment in the grid model file, the topological connection relationship between equipment, the affiliation relationship between equipment, and the latitude and longitude coordinate information of equipment;

[0048] S30. Read the drawing object collection, equipment object collection, connection point object collection, connection line object collection and label object collection ...


PUM


Abstract

The invention relates to the technical field of the electrical power system monitoring and managing method, in particular to an automatic drawing method for the geographical indentation of an electrical power system diagram. A non-uniform geographical indentation layout algorithm is used, a substation refers to a practical coordinate to carry out indentation layout, and a relative position betweenstations is kept; outgoing switches are evenly distributed around the substation, a drawing space is used, and line cross is reduced; equipment annotation carries out vertical and horizontal malposition on the annotation of adjacent equipment according to the blank space of the drawing so as to realize the non-overlapping annotation of the equipment; and a layout algorithm guarantees that a lineis only a straight line, the drawing layout is clear and attractive, and the integral style is horizontal and vertical. The system diagram drawing drawn by the method disclosed by the invention is characterized in that the line is horizontal and vertical, the equipment layout is accurate, reasonable and attractive, the annotation is protected from excessive overlapping so as to be similar to the use habits of electrical power business departments, in addition, the expenditure of manpower resource cost and a manual mistake possibility can be reduced, the intellectualization of drawing work is improved, and the drawing is guaranteed to be correctly generated and updated in time.

Description

technical field [0001] The present invention relates to the technical field of power system monitoring and management methods, and more specifically, relates to a method for automatically drawing geographical indentations of power system diagrams. Background technique [0002] The system diagram is one of the core drawings of the power system, which can clearly show the overall wiring network relationship of the substation / power supply station in the power system. The system diagram can ensure the network management and control of the distribution network's full wiring for distribution network dispatching, that is, through the visual display of the contact relationship of power equipment in the distribution network system diagram, the monitoring and management capabilities of the entire distribution network dispatching can be improved. For example, when the power grid encounters heavy overload of the main network and needs to control the load immediately, the contact relatio...

Claims


Application Information

Patent Timeline
Patent Type & Authority Applications(China)
IPC IPC(8): G06F17/50G06Q50/06
CPCG06F30/18G06F30/20G06Q50/06
Inventor 吴丽贤林钰杰庞伟林杨峰欧阳卫年李高明杜家兵庞维欣刘胜强朱延延
Owner FOSHAN POWER SUPPLY BUREAU GUANGDONG POWER GRID
Why Eureka
Try Eureka