Double-layer traffic network model-based anti-congestion method

A traffic network and bus network technology, applied in data processing applications, forecasting, instruments, etc., can solve problems such as the difficulty of studying urban traffic multi-mode situations, urban traffic network congestion obstacles, etc.

Active Publication Date: 2018-10-12
FUDAN UNIV
11 Cites 14 Cited by

AI-Extracted Technical Summary

Problems solved by technology

In recent years, due to the complexity of urban traffic network structure and the diversity of urban traffic travel modes, Ding Qianxing, Yan Ling, Yan Min. The Research of the Key Issues of Innovation Based on BT Transaction Mode in Urban Rail. Intelligent Transportation, Big Data and Smart City (ICITBS). 2016: 914-917, the influence of many factors such ...

Method used

As can be seen from Fig. 11, original data presents following rule: travel distance and average cost present the relation of non-linear growth, along with the increase of travel distance, the rate of increase of average cost can be bigger and bigger, and this also reflects from the side This shows that the actual travel distance and the cost function are nonlinear. Under the effect of the improved UE traffic allocation algorithm, we can see that as the travel distance increases, the average cost will decrease significantly. However, in the improved UE allocation algorithm, we can see that the travel distance has a nearly linear relationship with the average cost, because when the travel distance is less than 25km, the traffic network is in a state of low traffic flow. In addition, by comparing the final equilibrium cost of the improved two-layer traffic network UE distribution model and the single-layer traffic network UE distribution model, it can be seen that the double-layer traffic network UE distribution model reduces the equilibrium cost to a certain extent, reflecting the rationality of our model.
As can be seen from Fig. 12, original data presents following rule: travel distance and average cost present the relation of non-linear growth, along with the increase of travel distance, the rate of increase of average cost will be bigger and bigger, and this also reflects from the side This shows that the actual travel distance and the cost function are nonlinear. Under the effect of the improved UE traffic allocation algorithm, it can be seen that as the travel distance increases, the average cost will decrease significantly. However, in the improved UE allocation algorithm, the travel distance and the average cost sh...

Abstract

The invention discloses a double-layer traffic network model-based anti-congestion method. The method can describe a coupling dynamic characteristic of a real traffic network comprehensively, and canrelieve urban traffic congestion to a large extent. Based on a double-layer network framework and a UE flow mathematical model, the method builds a model for traffic network congestion and demonstrates traffic network congestion. On the one hand, the traffic network congestion degree is reflected through congestion coefficients; and on the other hand, the traffic network efficiency is reflected through an average cost function. Empirical data simulation proves that speed ratio of the upper and lower networks of the double-layer traffic network is closely rated to coupling coefficients. Under actual speed ratio, the congestion coefficient of the method is reduced by 14.28% compared with average congestion coefficient of the prior art, so that the anti-congestion performance of the traffic network is improved effectively.

Application Domain

Forecasting

Technology Topic

Traffic congestionEmpirical data +3

Image

  • Double-layer traffic network model-based anti-congestion method
  • Double-layer traffic network model-based anti-congestion method
  • Double-layer traffic network model-based anti-congestion method

Examples

  • Experimental program(1)

Example Embodiment

[0136] Example
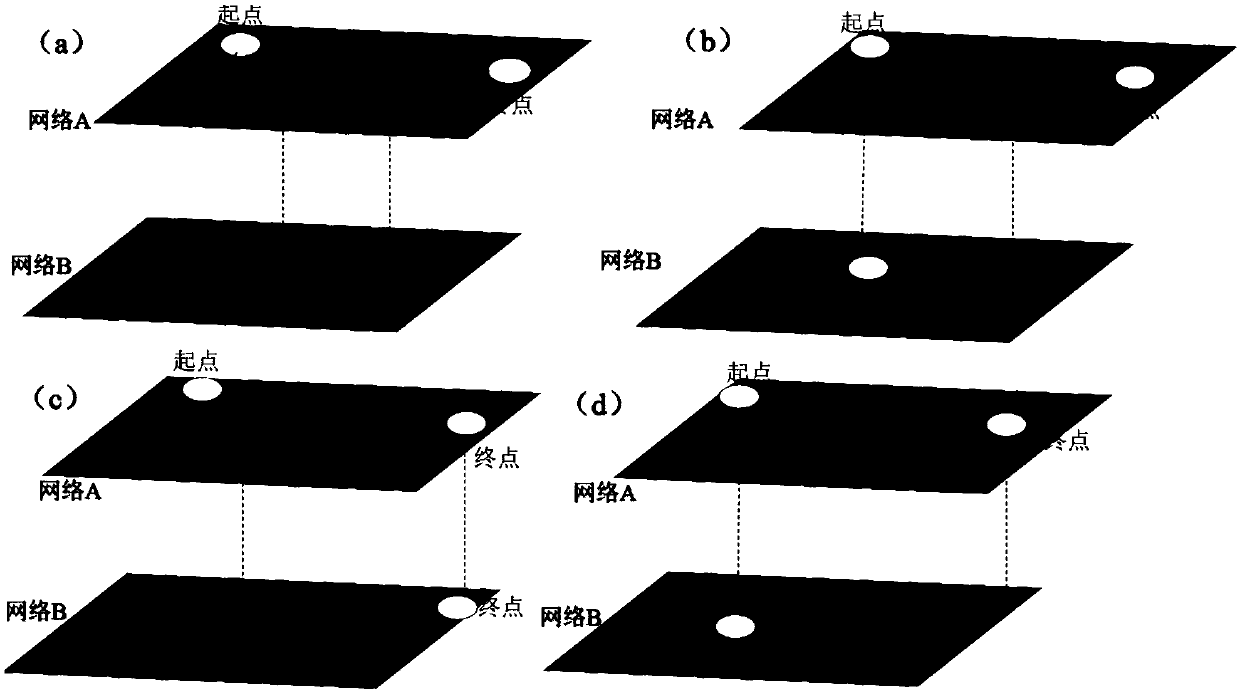
[0137] The present invention considers that the upper-layer network is a low-speed network, that is, the running speed is slower and dense; the lower-layer network is a high-speed network, and the running speed is faster and sparse. Taking into account the actual situation, passengers will choose the shortest route during travel, and will try to avoid transfers as little as possible. Transfer refers to the jump between the corresponding nodes of the upper and lower layers of the network. Therefore, assume that the number of passengers transfers Not more than 2 (ie n≤2). Generally speaking, in real life, there are more bus stations than subway stations, that is, N A ≥N B , The random coupling method is used to realize the coupling of the upper and lower layers of the network: for each node in the network B, a node is randomly selected from the network A, if there is no edge between the two points, connect them. Repeat this process until all nodes in the lower network are connected.
[0138] Passengers will appear during travel figure 1 In four situations. For (a), there is no coupling between the start node and the destination node. In this case, passengers have only two choices to ride: use the upper bus network only or transfer twice (driving on the bus network first, Find the coupling node, then go to the subway network to drive, then find the coupling node, transfer again, and finally reach the destination node); for (b), the starting node has a coupling node, and the destination node does not have a coupled node. In this case, there are only two ways for passengers to ride: only use the upper bus network or transfer once (start from the subway network station, drive on the subway network, and transfer to the bus network when the coupled node is found to reach the destination) ; For (c), the starting node does not have a coupled node, and the destination node has a coupled node. Similar to (b), there are only two cases: only use the upper bus network or transfer once (from the bus network station) , Driving on the bus network, find the coupled node, transfer to the subway network and finally reach the destination); for (d), the starting node and the destination node are both coupled nodes, in this case, it can be transformed into For the problems corresponding to (a), (b), and (c), the path with the least cost can be compared comprehensively.
[0139] Numerical simulation and empirical results
[0140] All the results of the present invention are obtained under an 8-core, 64-bit Windows 10 operating system, and MATLAB 2012b experimental environment. Each group of networks randomly selects 100 OD pairs for simulation, and the experimental simulations are performed 1000 times and the obtained values ​​are finally averaged. Here, the cellular automata model is used to simulate the traffic flow. In the simulation experiment, the road length is set to 500m, the maximum speed of the road is 50m/s, the simulation time is 10000s, the time step is 1s, and the probability of random slowing down Is 0.3.
[0141] In the simulation stage, the present invention constructs an upper network A with 100 nodes and a lower network B with 50 nodes. The combination of the two networks A and B may have the following forms: BA+BA, ER+ ER, BA+ER, where the average degree of the BA network is =10, the probability of random connection of the ER network is: 0.1, the average length of the ER network is 3, and the tolerance coefficient is taken as ψ=1.5. The two networks are coupled by random coupling. At the initial moment, the traffic in the network is 0. In each time step, a unit traffic flow is randomly generated between any two OD pairs, and the traffic capacity limit for each side is randomly distributed in the interval [20,60] according to the uniform distribution. . The traffic flow distribution method is mainly to use the transfer-based congestion UE flow allocation algorithm to balance the traffic flow in the network. Total traffic capacity Is the total amount of traffic flow in the network. In the actual simulation process, it is assumed that even if the network is in a congested state, the congested edge will not be removed from the network, but the cost function of this edge will become infinite.
[0142] by image 3 It can be seen that the average coupling coefficient of the BA+BA network always remains unchanged and the value is 1. As the speed ratio increases, the coupling coefficient of the BA+ER network first remains unchanged and then increases. When the speed ratio is 5, the coupling coefficient reaches saturation State; as the speed ratio increases, the coupling coefficient of the ER+ER network continues to increase. When the speed ratio is about 2, the coupling coefficient reaches a saturated state, and the stable value is 1. The difference is that the homogeneous combination network (ER+ Compared with the heterogeneous combination network (BA+BA) and the hybrid network (BA+ER), the average coupling coefficient of the two-layer network system composed of ER) has a smaller final stable value, while the homogeneous combination network is stable Maximum value. The phenomenon reflected by the average coupling coefficient shows that when the B-layer network is an ER network, the two-layer network system is easier to use the B-layer network. The reason for this phenomenon is that when passengers travel in the network, in the case of four different coupling node OD pairs, the selection rules of coupling nodes are more inclined to choose the network travel with less connection cost, because the B-layer network is A When the sub-network is a homogeneous network (ER), the average cost of connecting the edges of the B-layer network is relatively small; on the contrary, if the A-layer network is a homogeneous network, the two-layer network is connected to the edges. The average cost is basically the same.
[0143] Figure 4 It shows that under different network topologies, with the increase of network capacity, the change law of equilibrium cost shows an increasing trend. When the capacity is small (Q <60), the equilibrium cost shows a nearly linear growth trend with the change of capacity. By comparing three different network topologies, it is found that the heterogeneous combined network has the fastest increase rate and the homogeneous combined network has the slowest increase rate. This reflects that when passengers adopt selfish and self-interested strategies to choose the mode of travel, the cost of a homogeneous combined network is the smallest and the cost of a heterogeneous combined network is the largest; when the capacity is large (Q> 60). Due to the emergence of congestion, if there are heterogeneous networks in the two-layer network, the equilibrium cost changes with the capacity to show nonlinear characteristics, which also shows that the homogeneous network is more important than the heterogeneous network. Congestion is not easy to occur, and it has strong anti-congestion ability. The main reason for this phenomenon is that for the ER heterogeneous network, due to its high coupling coefficient, when the traffic capacity continues to increase, passengers are more likely to choose a network with a lower cost function when choosing a network for travel. Internet travel. Naturally, it will increase avoidance of congestion, and traffic efficiency will increase accordingly.
[0144] by Figure 5 (a) It can be seen that when α=1, the fixed value Q of traffic flow c At 30 o'clock, the double-decker traffic network will be congested. As the traffic volume increases, the congestion coefficient will increase. When the traffic volume reaches 85, the traffic congestion coefficient will remain unchanged, and the entire system will be saturated. Congestion when the network is stable The maximum value of the coefficient is higher than 70%. Figure 5 (a) and Image 6 (a) J-Q and J A -Q trends are roughly the same, indicating that when the upper and lower network speeds are the same, it is mainly the topological structure of the upper network that determines the network congestion coefficient, that is, the main reason for traffic network congestion is that passengers choose the upper low-speed network. Figure 7 (a) Middle J B The relationship between -Q also illustrates this point well. In addition, the congestion coefficient of the upper-layer network can better reflect the congestion situation of the entire network, indicating that the upper-layer network is dominant in the entire traffic transport, while the lower-layer network basically does not play any role. This can also be explained from another aspect. When the upper and lower network speeds are the same, the introduction of the multi-layer network framework increases network congestion, which is caused by the imbalance of the shortest path distribution in the upper and lower networks.
[0145] by Figure 5 (b) It can be seen that when α=5, the maximum value of the congestion coefficient is less than 70% when the network is stable, which is smaller than when α=1. This is because when the lower network speed is high, more passengers tend to Choose the lower network, the upper and lower networks will show a cooperative relationship, which will relieve the pressure of traffic jams, and finally reduce the congestion coefficient of the entire system to a certain extent, and improve the network efficiency. Combining the previous analysis, we can see that the main reason that the cooperation of the two-tier transportation network can improve the network efficiency is the difference of the upper and lower network speeds. On the other hand, by comparing the two-tier traffic network with different structures, it is found that the capacity and the congestion coefficient present the following law: within a certain range of traffic flow, the congestion coefficient will remain unchanged. When the capacity reaches a fixed value, as the capacity Increase, the congestion coefficient will continue to increase, and when a certain capacity is reached, the congestion coefficient will remain unchanged.
[0146] Synthesizing the ratio of the upper and lower layers of the network, the difference between the network congestion coefficients under different topological structures can be analyzed. by Figure 5 (a) and Figure 5 (b) It can be seen that when the traffic flow is relatively low, the BA+BA network is more prone to congestion than the ER+ER network. When the traffic flow is high, the BA+BA network is less prone to congestion than the ER+ER network. The conclusions of the single-layer network are similar. This is because when the upper and lower network speeds are the same, passengers mainly use the upper network. The whole process is actually equivalent to the single-layer network situation, which also shows the rationality of the design algorithm of the present invention. In addition, it can be found that there is no significant difference in congestion between the BA+BA network and the BA+ER network; when α=5, a significant change can be seen. When the traffic flow is low, the BA+BA network is easier than the BA+ER network Withstand congestion; when the traffic flow is high, the BA+ER network is easier to withstand congestion than the BA+BA network, and the ER+ER network has the strongest ability to withstand congestion, which is obviously opposite to the single-layer phenomenon. This shows that when the speeds of the upper and lower layers are quite different, there is a significant difference between the analysis of the two-layer network framework and the conclusions on the single-layer network. The main reason for this opposite phenomenon is as follows: When the ratio of the upper and lower network speeds is equal, passengers mainly use the upper network. Because there are multiple Hub nodes in the BA network, as the traffic volume increases, passengers will appropriately bypass the Hub. Nodes avoid congestion; because the distribution of the shortest path of the ER network presents a community phenomenon, passengers will congest more nodes due to the intersection of multiple shortest paths. However, when the lower-layer network speed is greater than the upper-layer network, as the traffic volume increases, passenger transfers will increase, and the number of passengers using the lower-layer network will also increase. For the ER network, multiple shortest paths may alleviate congestion to a certain extent. However, due to the limitation of the number of shortest paths passing through the Hub node in the BA network, passengers will be blocked at the Hub node, and congestion will increase.
[0147] In the empirical stage, the data is preprocessed in the following ways: (1) Preliminarily construct a two-layer transportation network model based on the road network data and subway network, such as Figure 8-10 As shown, the coupling rules are: for each subway station to be coupled with the nearest bus station; (2) Preliminarily judge the range of travel distance based on the distance matrix of the road network; (3) Under the fixed travel distance, construct the OD pair Set, use the dual-layer network UE allocation algorithm to allocate flows to all OD pairs.
[0148] Through the above processing methods, the relationship between travel distance and average congestion coefficient is compared, such as Picture 11 As shown, the relationship between travel distance and cost function, such as Picture 12 Shown.
[0149] by Picture 11 It can be seen that when the two-tier UE allocation algorithm is not used, as the travel distance increases, the average congestion coefficient is smaller at the travel distance (d <5) is zero. When the travel distance increases, the total congestion coefficient first increases and then decreases. When d is about 15, the average congestion coefficient reaches the maximum value of 0.4. On the basis of the original data, after using the double-layer UE allocation algorithm and the single-layer traffic network UE allocation algorithm, it can be found that as the travel distance increases, the average congestion coefficient shows a clear downward trend, and the maximum value of the average congestion coefficient is in the double The UE allocation algorithm of the two-layer transportation network is 0.3, and the average congestion coefficient is reduced by 2%; in the single-layer transportation network UE allocation algorithm is 0.35, the average congestion coefficient is reduced by 1.8%, and the UE allocation algorithm of the two-layer transportation network is compared with the single-layer transportation network. In other words, the average congestion factor is reduced by 14.28%. This shows that the dual-layer UE allocation algorithm plays a certain role in alleviating traffic congestion and is better than a single-layer network.
[0150] by Picture 11 It can be seen that the original data presents the following law: travel distance and average cost show a non-linear growth relationship. With the increase of travel distance, the increase rate of average cost will increase, which also reflects the actual travel distance and cost from the side. The function exhibits the characteristic of nonlinearity. Under the effect of the improved UE allocation algorithm, we can see that as the travel distance increases, the average cost will be significantly reduced. However, in the improved UE allocation algorithm, we can see that the travel distance has a nearly linear relationship with the average cost. This is because when the travel distance is less than 25km, the transportation network is in a state of low traffic flow. In addition, by comparing and improving the final equilibrium cost of the UE allocation model of the double-layer transportation network and the UE allocation model of the single-layer transportation network, it can be seen that the UE allocation model of the double-layer transportation network reduces the equilibrium cost to a certain extent, reflecting the rationality of our model.
[0151] by Picture 12 It can be seen that the original data shows the following law: travel distance and average cost show a non-linear growth relationship. With the increase of travel distance, the increase rate of average cost will increase, which also reflects the actual travel distance and cost from the side. The function exhibits the characteristic of nonlinearity. Under the action of the improved UE allocation algorithm, it can be seen that as the travel distance increases, the average cost will be significantly reduced. However, in the improved UE allocation algorithm, the travel distance and the average cost show a nearly linear relationship, because when the travel distance is less than 25km, the transportation network is in a state of low traffic flow. In addition, by comparing and improving the final equilibrium cost of the UE allocation model of the double-layer transportation network and the UE allocation model of the single-layer transportation network, it can be seen that the UE allocation model of the double-layer transportation network reduces the equilibrium cost to a certain extent, reflecting the rationality of the model.

PUM

no PUM

Description & Claims & Application Information

We can also present the details of the Description, Claims and Application information to help users get a comprehensive understanding of the technical details of the patent, such as background art, summary of invention, brief description of drawings, description of embodiments, and other original content. On the other hand, users can also determine the specific scope of protection of the technology through the list of claims; as well as understand the changes in the life cycle of the technology with the presentation of the patent timeline. Login to view more.
Why Eureka
Try Eureka