Automatic visual analysis method for big data platform

A big data platform and analysis method technology, applied in the field of big data visualization technology and big data analysis, automatic visualization analysis, can solve the time-consuming and labor-intensive, do not have automatic visualization methods and approaches, influence the display of diverse and massive data value universal adaptability Sex and other issues, to achieve the effect of easy and convenient access

Inactive Publication Date: 2018-11-13
EAST CHINA INST OF COMPUTING TECH
View PDF7 Cites 23 Cited by
  • Summary
  • Abstract
  • Description
  • Claims
  • Application Information

AI Technical Summary

Problems solved by technology

Seriously restricting the convenient and fast presentation of massive data by the big data platform, every time a visual chart is displayed, it needs to be designed and developed separately, which is time-consuming and laborious, and there is no method and approach for automatic visualization, which affects the value of displaying diverse massive data universal adaptability

Method used


Image

  • Automatic visual analysis method for big data platform

Examples


Embodiment Construction

[0028] The present invention will be described in detail below in conjunction with specific embodiments. The following examples will help those skilled in the art to further understand the present invention, but do not limit the present invention in any form. It should be noted that those skilled in the art can make several changes and improvements without departing from the concept of the present invention. These all belong to the protection scope of the present invention.

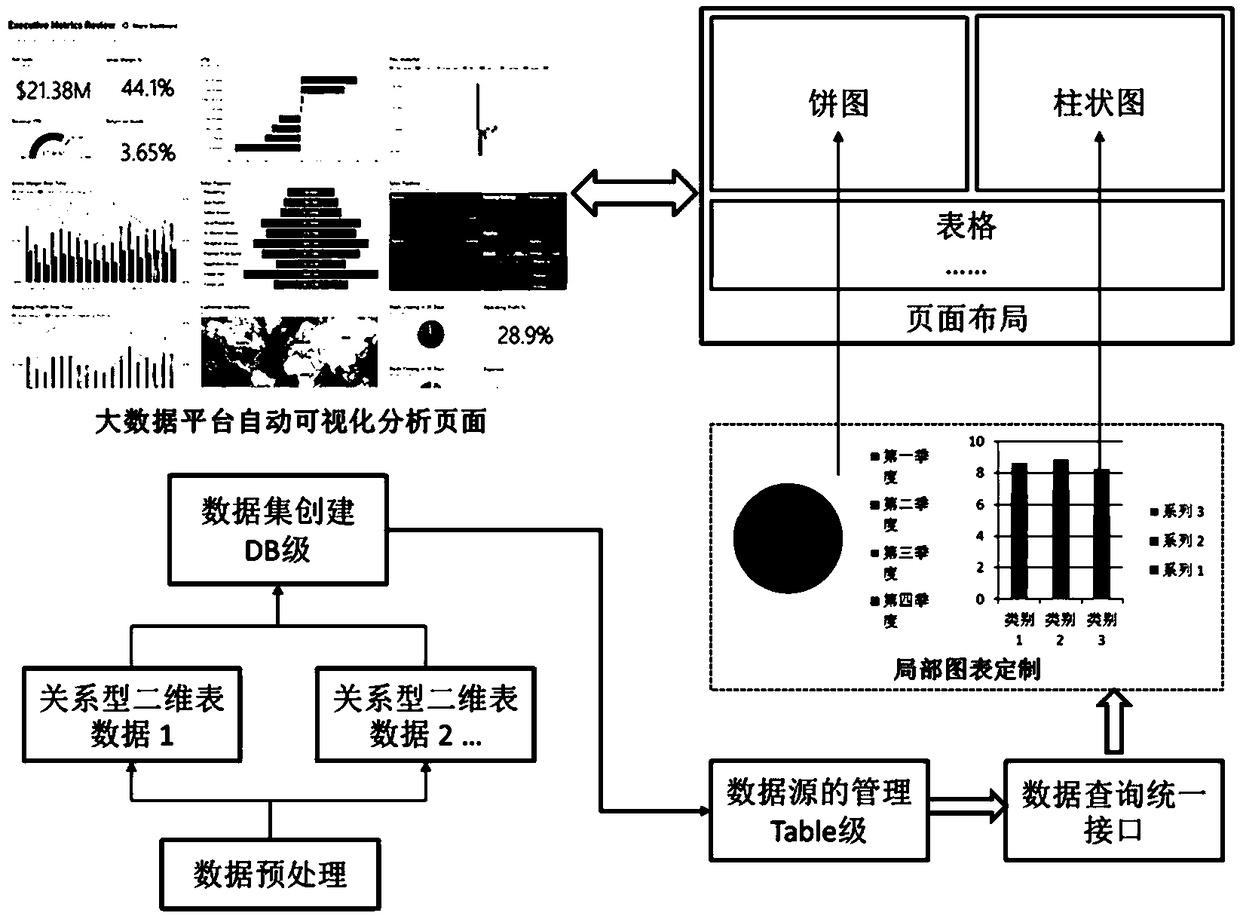
[0029] figure 1 It is a schematic diagram of the automatic visual analysis method of the big data platform of the present invention, combined with figure 1 , the automatic visualization analysis method of a kind of big data platform of the present invention, comprises the following steps:

[0030] Step S1: Data preprocessing: transform unstructured data into relational two-dimensional table data for direct query, analysis and presentation, and store it;

[0031] Step S2: Management and addition of dat...


PUM


Abstract

The invention provides an automatic visual analysis method of a big data platform. The method comprises the steps of extracting two-dimensional relation data table data generated by performing offlineanalysis on the Hadoop big data platform; performing offline analysis and real-time analysis to generate a relational two-dimensional table; performing a select query on fields of the two-dimensionalrelation table to obtain all table field columns; performing charting according to a relation between the fields; displaying a layout through an automatic customizing interface; and by taking data inthe relational two-dimensional table as a mainly presented dimension, performing visual presentation on the analyzed data. According to the method, the general adaptability of data value display of the big data platform is greatly improved; the data can be intuitively displayed before the eyes of a user through relevant chart views, so that the adaptability of data use is greatly improved, and the difficulty of acquiring core service data of the big data platform is lowered; and according to the requirements of services, the page layout and the chart customization are automatically carried out, so that the convenience of data analysis application and display is improved.

Description

technical field [0001] The present invention relates to the fields of cloud computing and big data, in particular to an automatic visualization analysis method for a big data platform, and specifically requires the application of a big data visualization technology and a big data analysis method. Background technique [0002] Existing big data platforms such as Hadoop mainly focus on distributed storage of data, offline analysis of data, transformation of data storage format and content, and attempts to mine the intrinsic value of data. In this case, only very professional data experts and technical experts can understand the internal correlation of massive data and the essence expressed by the data itself. Seriously restricting the convenient and fast presentation of massive data by the big data platform, every time a visual chart is displayed, it needs to be designed and developed separately, which is time-consuming and laborious, and there is no method and approach for au...

Claims


Application Information

Patent Timeline
Patent Type & Authority Applications(China)
IPC IPC(8): G06F17/30G06F9/451
CPCG06F9/451
Inventor 刘银平李龙凌波彭癸先
Owner EAST CHINA INST OF COMPUTING TECH
Why Eureka
Try Eureka