A bus missing data recovery method based on coupling information

A technology for driving data and missing data, which is applied to the redundancy in the operation for data error detection, electrical digital data processing, response error generation, etc.

Active Publication Date: 2019-01-04
温州大学苍南研究院
5 Cites 1 Cited by

AI-Extracted Technical Summary

Problems solved by technology

[0004] On the one hand, the bus trajectory has obvious time-varying dynamics and volatility, and traditional meth...

Method used

2, data fitting training of the present invention and data recovery calculate separation, and utilize combination index field to store and obtain model parameter, improve the speed of real-time recovery data;
3, the model output weight of the present invention is set to zero by the abnormal trigger of output value, when the output value of certain model is not in preset range, corresponding weight is 0, makes this model temporary invalidation, when avoiding individual model abnormality adversely affect the recovery data;
In one e...

Abstract

The invention provides a method for recovering bus missing driving data, which includes steps: establishing master information and selecting missing data to be recovered; establishing the recovery model data set of the same line coupling information; establishing a recovery model data set of coupling information of other lines of the same section from the station i to the station j; the coupling data fitting model being established by using a limit learning machine ELM; taking the bus main information and the corresponding model parameters coupled with the same line to calculate the corresponding output values and weights; at the same time, the bus information and the correspond model parameters of the other route being coupled at the same time, and the corresponding output values and weight being calculated; the output of each model being processed by accumulating and normalizing weights, a weighted output estimate of the line l from the station i to the station j being calculated, and obtaining missing data to be recovered based on the driving data associated before and after the same bus shift and the number of buses traveling on other routes at similar times on the same road section. According to the construction of data recovery model, the missing data of bus driving can be recovered with high precision, and the data base of bus data mining can be established.

Application Domain

Redundant operation error correction

Technology Topic

Similar timeModel parameters +7

Image

  • A bus missing data recovery method based on coupling information
  • A bus missing data recovery method based on coupling information
  • A bus missing data recovery method based on coupling information

Examples

  • Experimental program(1)

Example Embodiment

[0041] In order to make the object, technical solution and advantages of the present invention clearer, the present invention will be further described in detail below in conjunction with the accompanying drawings.
[0042] like figure 1 As shown, in the embodiment of the present invention, a kind of method for bus missing driving data recovery proposed, comprises the following steps:
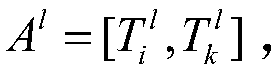
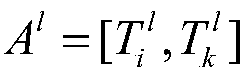
[0043] Step S1, establish the main information of the bus line l to be restored and in the master message , select the missing data to be recovered in, is the arrival time of a bus on line l at station i; is the arrival time of the bus at the follow-up station k, k>=i+2; and are non-missing data; is the arrival time of the bus at the follow-up station j, j=i+1;
[0044] The specific process is to transform the data recovery problem into the travel time estimation problem of adjacent stations. set up is the elapsed time of the line bus from station i to station j; similarly, set is the elapsed time of the line bus from station i to station k. like can be estimated from coupling information, then available by be restored.
[0045] In one embodiment, as shown in Table 1 below, the driving data of a certain bus line 10 in a certain city is given. In order to simplify the problem, only the arrival information of station 6, station 7 and station 8 are given in the table. In Table 1, the arrival time is converted into minutes counted from 00:00:00. Taking 638.92 as an example, its real arrival time is 10:38:55, and the corresponding calculation process is 10×60+38+55/ 60=638.92, the data expression of converting the arrival time into minutes is convenient for data calculation.
[0046] Table 1: Bus Arrival Information Form for a Certain Shift
[0047] id
[0048] In Table 1, the row with id=1 records the arrival time of the shift at stations 6 and 8, and the real value of station 7 is 641.42. Assuming that site 7 is a site with missing data, it needs to be recovered and the recovery error evaluated. At this time, according to step S1, take i=6, k=8, l=10, j=7, main information A l =[638.92,642.55], data to be restored Transformed into a driving estimation problem from station 6 to station 7.
[0049] Step S2, establishing a recovery model data set X of coupling information on the same line (0) and Y (0);
[0050] Take line l to the historical data of sites i, j, and k that are not missing to form coupling information And by formula (1), by H (0) Construct the corresponding information matrix X (0) and Y (0) :
[0051]
[0052] Among them, N represents the number of data samples that meet the conditions, and H (0) One row of data corresponds to the arrival time of a certain shift on the line at stations i, j, and k; X (0) for H (0) Column 3 H (0) (:,3) minus column 1 H (0) (:,1) The resulting value represents Historical data; Y (0) for H (0) Column 2H (0) (:,2) minus column 1 H (0) (:,1) The resulting value represents historical data;
[0053] The specific process is to establish the same-line coupling information based on the historical data associated with the bus of the same shift, and further establish the corresponding data set required for the data recovery model based on the same-line coupling information.
[0054] In one embodiment, taking the above table 1 as an example, for the missing data of station 7, all the arrival data of line 10 that are not missing at station 6, station 7 and station 8 can be taken in the database to form H (0) matrix.
[0055] According to 4 months as a batch of processing data, according to Table 1, there are 4704 pieces of coupling information on the same line, so the obtained H (0) The size of the matrix is ​​4704×3, according to the formula (1), the recovery model data set X of the coupling information of the same line can be obtained (0) and Y (0).
[0056] Step S3, establish recovery model data set X of coupling information of other lines in the same section from site i to site j (m) and Y (m) , m=1,2,...,M;
[0057] Take the time window of S minutes before and after the arrival time of line l at station i, and construct the historical data set of the m-th coupled bus And by formula (2), by H (m) Construct the corresponding information matrix X (m) and Y (m) :
[0058]
[0059] Among them, M means that there are M lines running on the road section formed by station i to station j; X (m) , have the same data dimension, and represent the coupling information set formed by the m-th line pair line l; N m The number of coupling messages generated for the mth line in the data set; X (m) for H (m) Column 4 H (m) (:,4) minus column 3 H (m) (:,3) the resulting value; Y (m) for H (m) Column 2H (m) (:,2) minus column 1 H (m) (:,1) the resulting value.
[0060] The specific process is to set the time window S = 2 minutes in the similar time period, and construct the historical data set of the m-th coupled bus according to the time window of 2 minutes before and after the arrival time of station i on line l
[0061] In one embodiment, taking the above Table 1 as an example, there are 3 coupled lines in the section from station 6 to station 7 corresponding to line 10, and the database ids of the lines are 48, 194 and 278 respectively, so M=3, 1 1 =48,l 2 =194, l 3 =278.
[0062] for l 1 = 48, from the historical data set to filter out the main line l = 10 and coupled line l 1 =48 The data that are not missing at both station 6 and station 7, and the difference between the arrival time of the coupling line at station 6 and the arrival time of the main line is within 2 minutes constitutes H (1) Data set, according to the actual data set in the system, get H (1) The matrix size is 582×4.
[0063] Get H in the same way (2) The matrix size is 876×4, H (3) The matrix size is 359×4.
[0064] According to the formula (2), the training data set X of the three coupled lines from station 6 to station 7 in Table 1 is obtained (m) and Y (m) , specifically X (1) and Y (1) , X (2) and Y (2) , and X (3) and Y (3).
[0065] Step S4, using the extreme learning machine ELM to establish a coupling data fitting model, and storing the model parameters in the database;
[0066] In ELM, the number of neurons is set to T, the commonly used value of T is 10, the activation function uses the Sigmoid function, and the input weight Use a random number in the interval [-1,1], input bias Using a random number in the interval [0,1], for the training data X (m) and Y (m) , m=0,1,2,...,M, then the model parameters are determined by the following formula (3):
[0067]
[0068] Further, according to the model parameters, the fitting root mean square error of the training data is calculated by the formula (4):
[0069]
[0070] When m=0, take (l, i, k, 0) as the combined index field, and set the model parameters (W in ,b in ,β,e rmse ) into the database; when m>0, (l m ,i,j,1) is the combined index field, and the model parameters (W in ,b in ,β,e rmse ) into the database.
[0071] The specific process is, in one embodiment, continue the above Table 1 as an example, in the ELM, the number of neurons is set to T=10, the activation function adopts the Sigmoid function, and the input weight Use a random number in the interval [-1,1], input bias Using a random number in the interval [0,1], for the training data X(m) and Y (m) , m=0, 1, 2, 3, a total of 4 fitting models are trained.
[0072] When m=0, the combined index field of (l,i,k,0) is (10,6,8,0); when m=1, (l 1 , i, j, 1) the combined index field is (48, 6, 7, 1); when m=2, (l 2 , i, j, 1) the combined index field is (194, 6, 7, 1); when m=3, (l 3 , i, j, 1) the combined index field is (278, 6, 7, 1). When the fitting model is trained, the model parameters are stored in the database with the corresponding index fields.
[0073] Step S5. Get the main information of the bus coupled with the same line Construct model input variables with m=0 And use (l, i, k, 0) as the combined index field to get the model parameters (W in ,b in ,β,e rmse ), according to the input variable x (0) and model parameters (W in ,b in ,β,e rmse ), the corresponding output variable is calculated by formula (5) and the output weight W (0) :
[0074]
[0075] Among them, y min for The minimum value of the allowable output, y max for The maximum value of the allowable output, when the output value is not within the allowable range, the output weight is directly triggered to zero; k w To control the fitting root mean square error e rmse The impact on the weight of the model forecast, the value is a positive real number, k w The larger the value, the larger the output weight of the model with a smaller fitting error.
[0076] The specific process is as figure 2 The shown flow of the left branch corresponds to the specific flow of this step. At this point, take y min =0.3,y max =30,k w = 2, and take (l, i, k, 0) as the combined index field to obtain the model parameters (W in ,b in ,β,e rmse ), calculate the main line coupling information output variable and the output weight W (0).
[0077] In one embodiment, continuing the above Table 1 as an example, x (0) =642.55-638.92=3.63, take (10,6,8,0) as the combined index to obtain the model parameters from the database (W in ,b in ,β,e rmse ),Specifically:
[0078] W in =[-0.2967,0.6617,0.1705,0.0994,0.8344,-0.4283,0.5144,0.5075,-0.2391,0.1356]
[0079] b in =[0.0759,0.0540,0.5308,0.7792,0.9340,0.1299,0.5688,0.4694,0.0119,0.3371]
[0080] β=[-7.925,6.091,13.94,-2.694,16.87,8.001,-330.4,298.2,12.85,-2.049]×10 4
[0081] e rmse =0.4441
[0082] According to the formula (5), it is calculated W (0) = 0.411.
[0083] Step S6, get the bus information of other lines coupled with the same road section at a similar time m=1,2,...M, and (l m , i, j, 1) get the model parameters from the database for the composite index field (W in ,b in ,β,e rmse ), and further according to the model parameters (W in ,b in ,β,e rmse ), the corresponding output variable is calculated by formula (6) and weight W (m) :
[0084]
[0085] The specific process is as figure 2 The processes shown in the middle branch and the right branch correspond to the specific process of this step. At this time, y min 、y max and k w Same as the value in step S5, that is, y min =0.3,y max =30,k w = 2, and with (l m , i, j, 1) get the model parameters from the database for the composite index field (W in ,b in ,β,e rmse ), calculate the output variable corresponding to the coupling line of the same road section and the output weight W (m).
[0086] For example, the departure time of line l at station i to be restored as a benchmark, take The travel time of other buses departing from station i to station j within the time period Assuming that a total of M lines generate coupling information during this period, there are a total of M models to calculate the corresponding output variables and the output weight W (m).
[0087] In one embodiment, continuing the above Table 1 as an example, Then look up the bus information of other lines departing from station 6 to station 7 within the time period of [636.92, 640.92] on that day. The information is shown in Table 2, and the line ids of 278 and 48 meet the conditions. According to step S6, it is obtained:
[0088]
[0089] Table 2: Arrival Information Form of Coupling Lines in the Same Road Section
[0090] line_id
[0091] Take (278, 6, 7, 1) as the combined index field to obtain the model parameters, and according to the formula (6), calculate W (1) =0.337; take (48, 6, 7, 1) as the combined index field to obtain model parameters, and calculate according to formula 6 W (2) = 0.359.
[0092] Step S7, perform weight accumulation and normalization processing on the output of each model, and calculate the weighted output estimated value of line l from station i to station j by formula (7) And further according to the formula (8), calculate the missing data to be restored
[0093]
[0094]
[0095] The specific process is, according to the formula (7) and the calculation results of steps S5 and S6, the weighted running time from station 6 to station 7 is obtained:
[0096]
[0097] Furthermore, through the formula (8), the arrival time of station 7 after recovery is obtained as
[0098] Comparing the actual values ​​in Table 1, it can be seen that the recovery error in the embodiment of the present invention is only 0.02 minutes, and a good effect has been achieved. If linear interpolation is used, then: The error is 0.685 minutes, much larger than the method of the embodiment of the present invention.
[0099] In the embodiment of the present invention, when there is missing data of consecutive stations, it can be recovered by j=i+1 Afterwards, the progressive method of i=j, j=i+1 is used to recover the next missing value according to steps S1 to S7 until all missing data between site i and site k are recovered.
[0100] Taking Table 3 as an example, the data of stations 7 and 8 are continuously missing, and i=6, j=7, k=9 can be set to recover the data of station 7. After station 7 recovers, let i=7, j=8, k=9, then the data of station 8 can be restored.
[0101] Table 3: Bus arrival information for two consecutive stations with missing data
[0102] id
[0103] In order to verify and count the data recovery performance of the embodiment of the present invention, the collected data of Suzhou public transport is verified, and the data collection time of the data set is from August 1, 2012 to December 9, 2012. The verification data is the bus arrival data of line 10, 80% of the data is taken as the training data, and 20% is used as the verification data. Table 4 shows the recovery root mean square of the missing data on the 45 stations from station 2 to station 46. Error, as can be seen from Table 4, in most site tests, the data recovery error of the present invention is significantly improved compared with the traditional linear interpolation method.
[0104] Table 4: Comparison table of data recovery root mean square error between the method of the embodiment of the present invention and the linear interpolation method
[0105]
[0106] Implementing the embodiment of the present invention has the following beneficial effects:
[0107] 1. Compared with the traditional linear interpolation, the present invention can make full use of the coupled driving information of the associated stations on the same line and the coupled driving information of other lines on the same road section to establish a data fitting model, and calculate the weight of the corresponding model according to the model fitting error, Realize multi-model weighted calculation of the travel time of adjacent stations, and then realize the recovery of corresponding missing data, so as to make full use of the coupling information associated with the same line and the coupling information of different lines in the same road section, which can achieve lower data recovery errors and improve data accuracy. reliability;
[0108] 2. The data fitting training and data recovery calculation of the present invention are separated, and the combination index field is used to store and acquire model parameters, so as to improve the speed of real-time data recovery;
[0109] 3. The output weight of the model of the present invention is set to zero when the output value is abnormal. When the output value of a certain model is not within the preset range, the corresponding weight is 0, which makes the model temporarily invalid and avoids the recovery of data when individual models are abnormal. produce adverse effects;
[0110]4. The model output weight of the present invention is controlled by the fitting error, so that the output weight of the model with a small fitting error is large, and the robustness of the data recovery model is improved.
[0111] Those of ordinary skill in the art can understand that all or part of the steps in the method of the above-mentioned embodiments can be completed by instructing related hardware through a program, and the program can be stored in a computer-readable storage medium, and the storage Media such as ROM/RAM, magnetic disk, optical disk, etc.
[0112] The above disclosure is only a preferred embodiment of the present invention, which certainly cannot limit the scope of rights of the present invention. Therefore, equivalent changes made according to the claims of the present invention still fall within the scope of the present invention.

PUM

no PUM

Description & Claims & Application Information

We can also present the details of the Description, Claims and Application information to help users get a comprehensive understanding of the technical details of the patent, such as background art, summary of invention, brief description of drawings, description of embodiments, and other original content. On the other hand, users can also determine the specific scope of protection of the technology through the list of claims; as well as understand the changes in the life cycle of the technology with the presentation of the patent timeline. Login to view more.
Why Eureka
Try Eureka