Flood loss assessment method and system based on statistical yearbook and geographic information

A geographic information and evaluation system technology, applied in the field of flood loss assessment based on statistical yearbooks and geographic information, can solve problems such as analysis and assessment of flood disaster impact and loss

Inactive Publication Date: 2019-02-22
CHINA INST OF WATER RESOURCES & HYDROPOWER RES
View PDF5 Cites 13 Cited by
  • Summary
  • Abstract
  • Description
  • Claims
  • Application Information

AI Technical Summary

Problems solved by technology

However, this method can only generate the spatial distribution results of flood disaster risk assessment, and cannot effectively analyze and evaluate the impact and loss caused by flood disasters.

Method used


Image

  • Flood loss assessment method and system based on statistical yearbook and geographic information
  • Flood loss assessment method and system based on statistical yearbook and geographic information
  • Flood loss assessment method and system based on statistical yearbook and geographic information

Examples


Embodiment 1

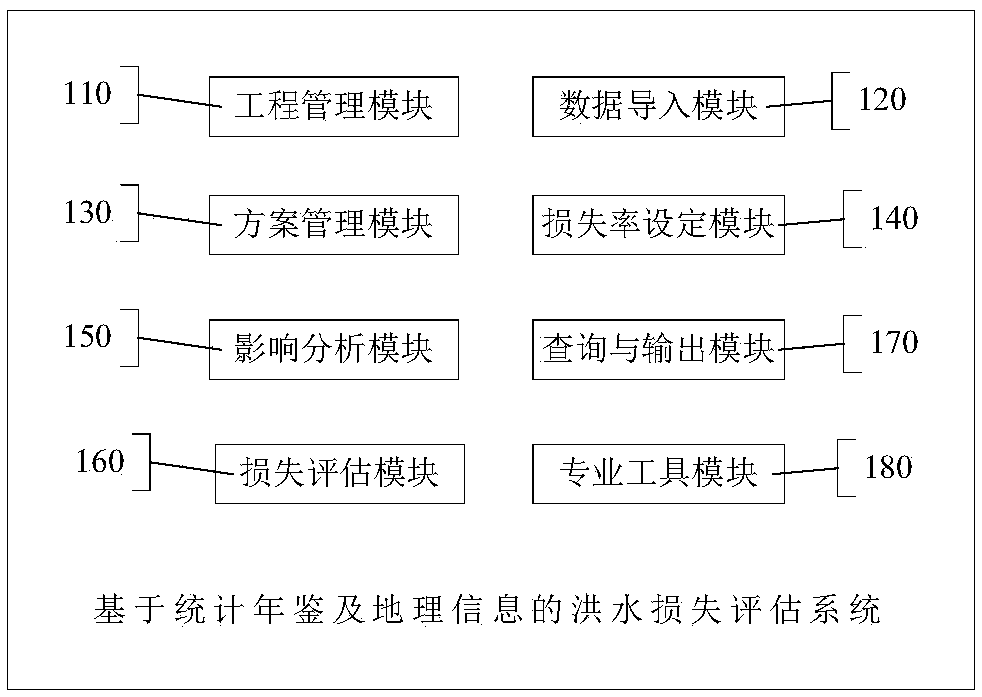
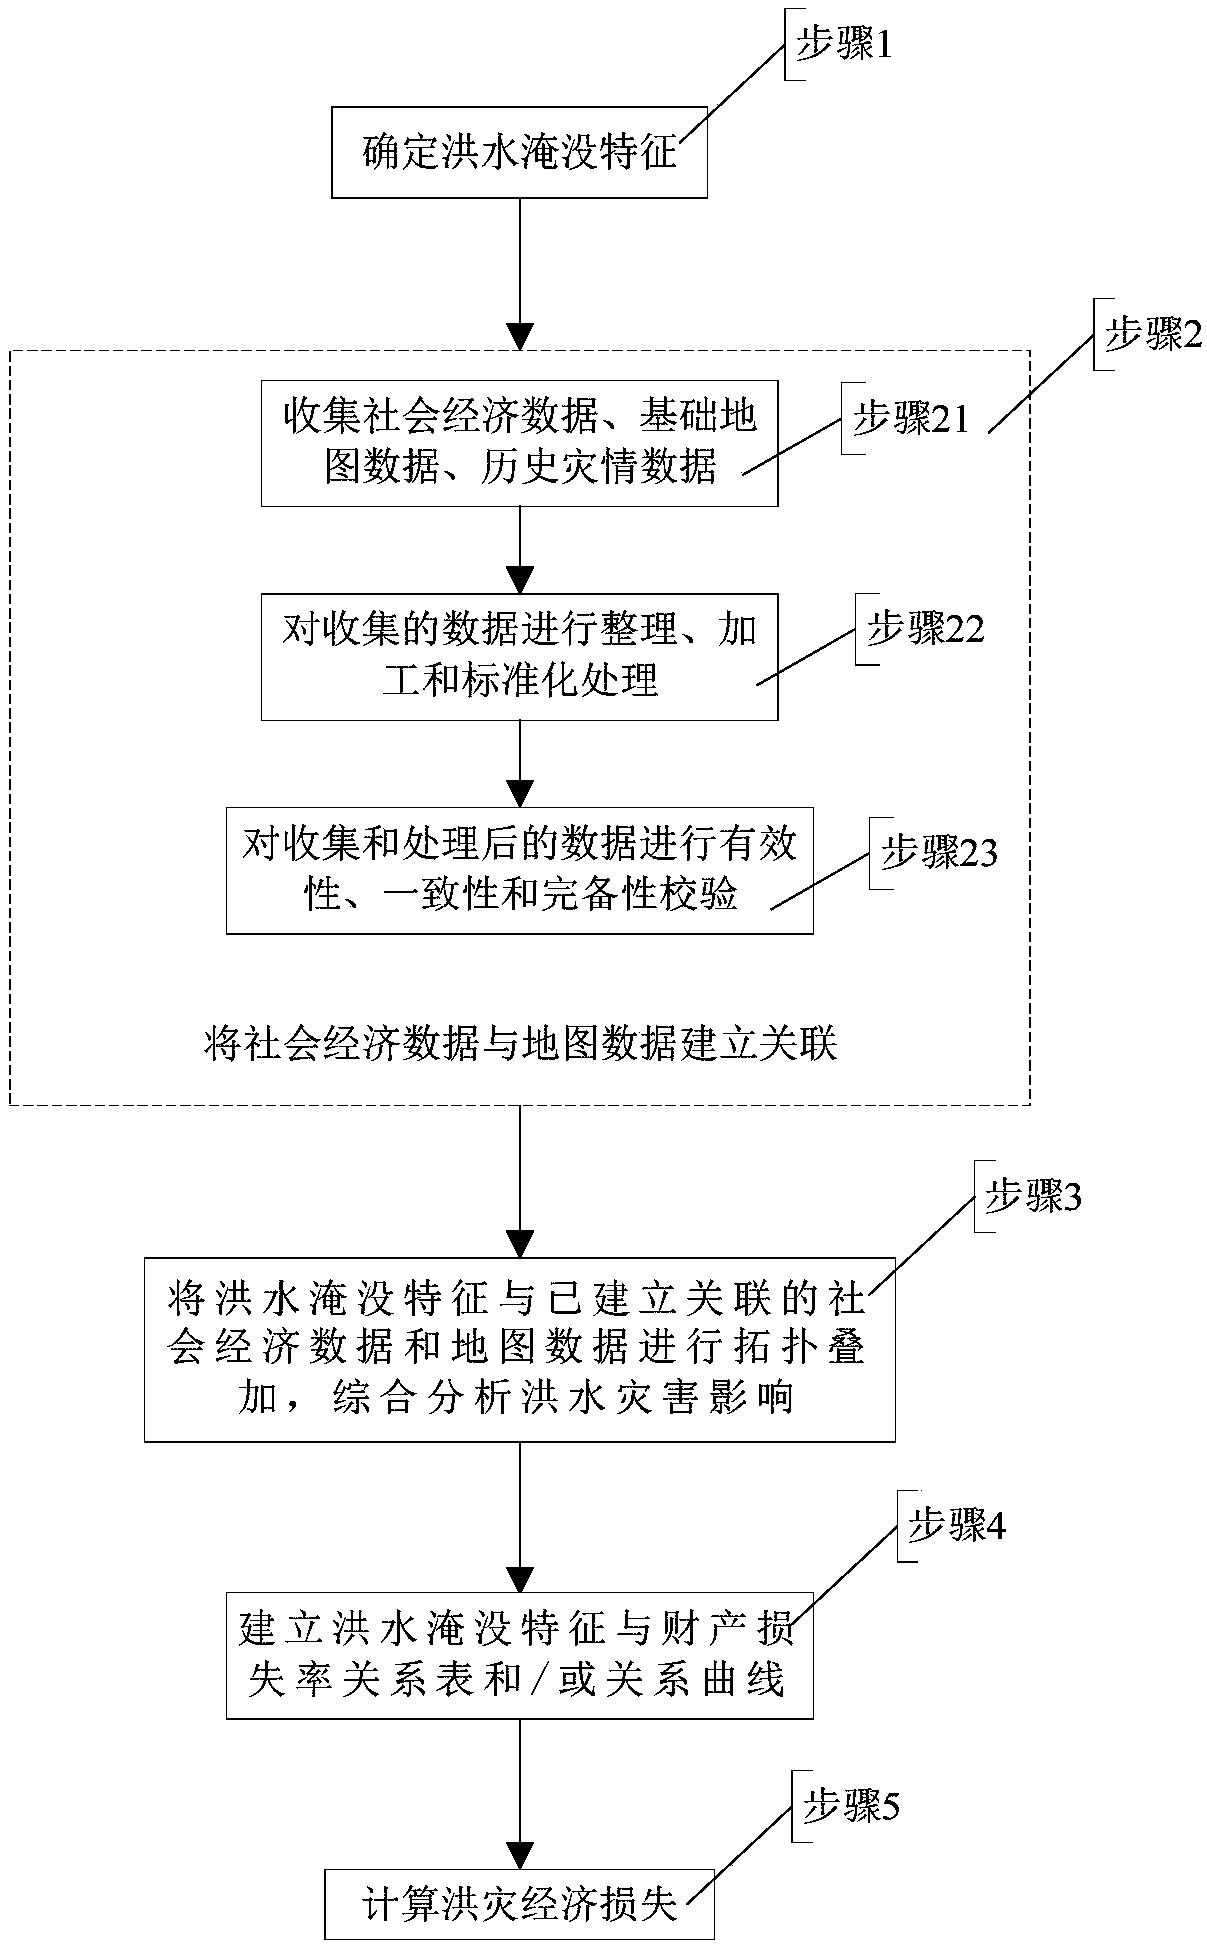
[0115] The flow of the flood loss assessment method based on the statistical yearbook and geographic information, such as figure 1 shown.

[0116] Execution Step 1: Determine the flood submergence characteristics, and determine the flood submergence characteristics such as the flood submergence range, submergence depth, submergence duration, and flood velocity based on mathematical model simulation, historical investigation or field measurement.

[0117] Execute Step 2: Link socioeconomic data with map data. Execute Step 21: Collect socioeconomic data, basic map data and historical disaster data. The socioeconomic data mainly come from the socioeconomic statistical yearbooks of administrative units at all levels. At the same time, typical survey data of regional socioeconomic and special statistical data of key objects can be used Published data; the basic map data mainly comes from the administrative division map, the distribution map of residential areas, agricultural land,...

Embodiment 2

[0124] Such as figure 1 As shown, steps 1 to 3 are the impact analysis of flood disasters. The indicators for flood disaster impact analysis include social impact indicators and economic impact indicators, and the social impact indicators include affected population and casualties; the economic impact Impact indicators include the GDP of the submerged area, the submerged administrative area, the submerged residential area, the submerged simulated industrial land area, the number of submerged enterprises and institutions, the length of submerged traffic lines, and submerged important facilities. Flood economic loss indicators include family housing loss, family property loss, agriculture, forestry, animal husbandry and fishery loss, enterprise and institution asset loss, industrial and commercial enterprise production stoppage loss, traffic road loss, water conservancy project damage loss, and other infrastructure loss, etc.

Embodiment 3

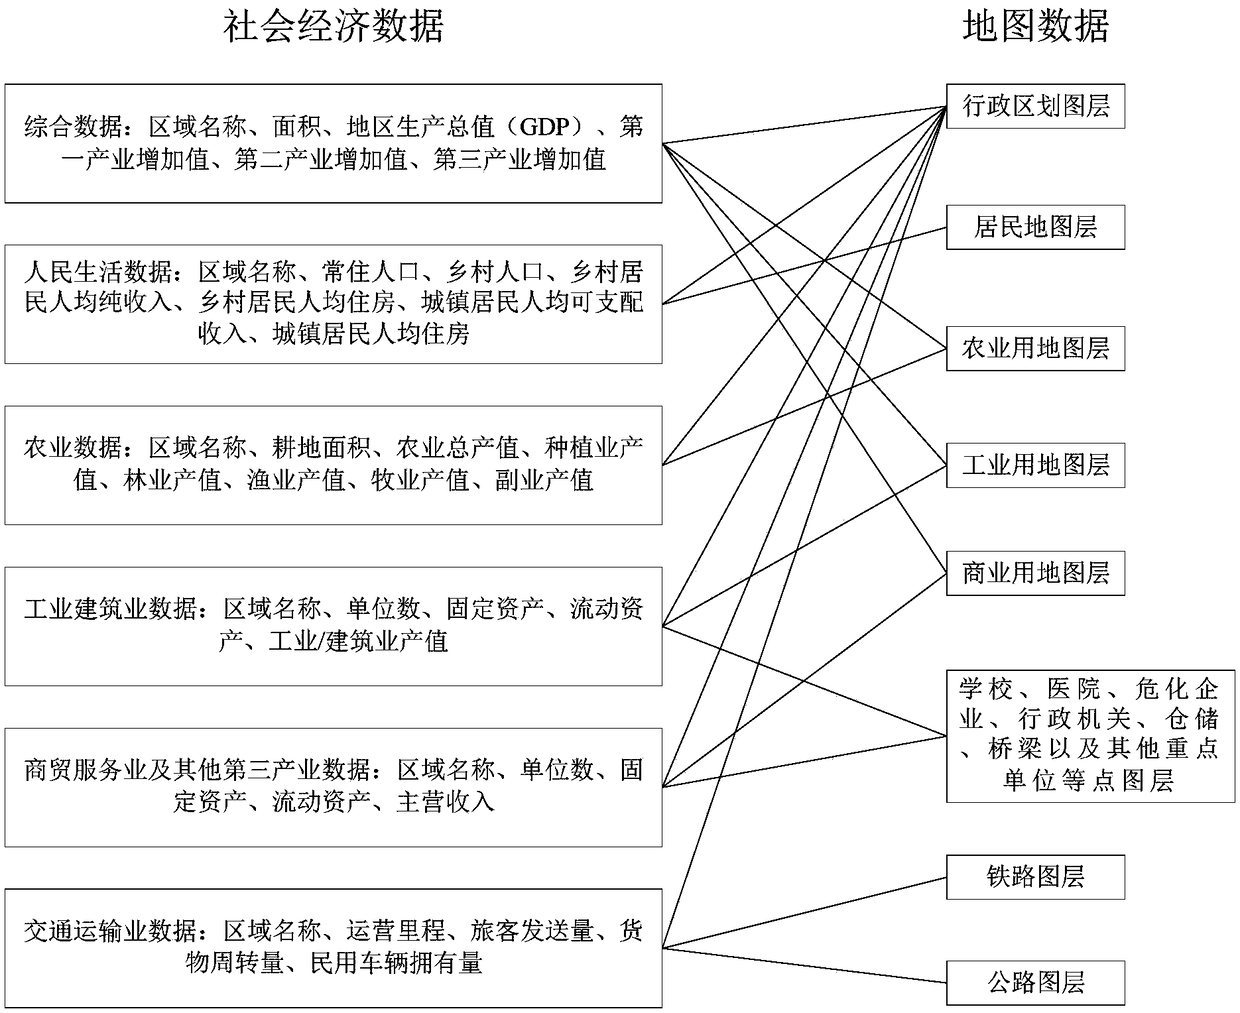
[0126] The relationship between socioeconomic data and map data is as follows: figure 2 shown. According to the flood loss assessment method of the present invention, the social and economic data are divided into several categories: comprehensive data, people's living data, agricultural data, industrial construction data, commercial service industry and other tertiary industry data, and transportation industry data. Process map data, filter and extract administrative division layers, residential map layers, agricultural map layers such as cultivated land and woodland, industrial map layers, commercial map layers, etc. Point layers such as warehouses, bridges, and other points of interest, and line layers such as railway layers and road layers.

[0127] The comprehensive data includes region name, area, gross regional product (GDP), primary industry added value, secondary industry added value, and tertiary industry added value data, which are combined with the administrative ...


PUM


Abstract

The invention provides a flood loss assessment method and system based on statistical yearbook and geographic information. The method includes the step 1: determining a flood submerging feature;2, associating socio-economic data with map data; 3, topologically superimposing that flood submergence feature with the established associated socio-economic data and map data, and comprehensively analyzing the flood disaster impact; 4, establishing a relationship table and / or a relationship curve between flood submergence characteristics and property loss rate; Step 5: calculating flood economic losses. The method and system of the invention can effectively analyze and evaluate the impact and loss caused by flood disaster, and provide important basis for formulating disaster prevention, disaster resistance, disaster relief and post-disaster reconstruction schemes.

Description

technical field [0001] The invention relates to the field of flood disaster loss assessment, in particular to a flood loss assessment method and system based on statistical yearbooks and geographical information. Background technique [0002] China is a country with frequent natural disasters. Flood disasters have always seriously threatened the safety of people's lives and property as well as social stability and development. In recent years, extreme weather events have occurred frequently, and the frequency of rainstorms and floods and the losses caused by them have also continued to increase. Therefore, rapid and scientific assessment of flood losses is an important basis for formulating disaster prevention, disaster relief, disaster relief and post-disaster reconstruction programs, and is of great significance to flood control and disaster reduction. Flood loss assessment is a basic research work in the field of flood control and disaster reduction research. Flood disas...

Claims


Application Information

Patent Timeline
Patent Type & Authority Applications(China)
IPC IPC(8): G06Q10/06G06Q50/26G06F17/24G06T11/20
CPCG06F40/18G06Q10/0639G06Q50/26G06T11/206Y02A10/40
Inventor 王艳艳李娜向立云王杉杜晓鹤韩松俞茜徐卫红王静张念强丁志雄陈明伟
Owner CHINA INST OF WATER RESOURCES & HYDROPOWER RES
Why Eureka
Try Eureka