Optimization method for spectrum harmonic averaging of rotating machinery
An optimization method and technology of rotating machinery, applied in the testing of mechanical components, testing of machine/structural components, complex mathematical operations, etc., can solve the problems of difficult feature extraction, influence of co-frequency interference, low energy of feature information, etc., to achieve the effect Obviously, improve the signal-to-noise ratio, the effect of simple process
- Summary
- Abstract
- Description
- Claims
- Application Information
AI Technical Summary
Problems solved by technology
Method used
Image
Examples
Embodiment 1
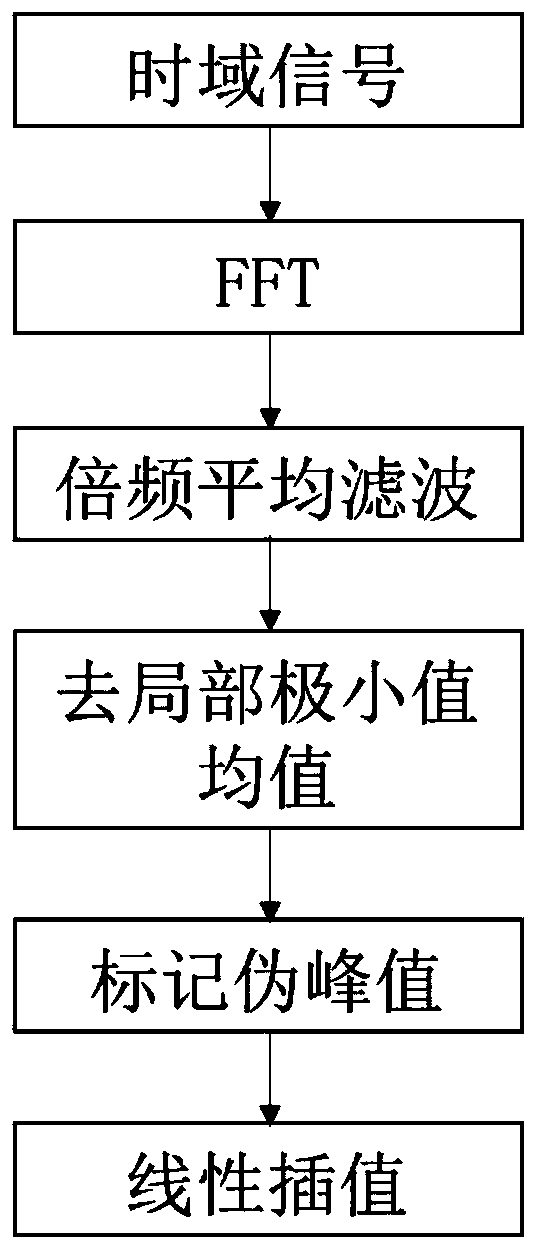
[0029] Embodiment 1, with reference to figure 1 , a method for optimizing the frequency spectrum harmonic averaging of rotating machinery, comprising the following steps:
[0030] Step 1) Perform Fourier transform on the original vibration signal to obtain the signal spectrum amplitude sequence {A i}, {i=1,2,L,N}, N is the number of sampling points;
[0031] Step 2 Determine the upper limit F of the signal analysis frequency band according to the equipment operating conditions and component parameter information, and obtain the analysis frequency range 0-F. The analysis frequency range 0-F contains 2-6 harmonics of the characteristic frequency. Mapping to its frequency division area, causing unnecessary false frequencies, and calculating the frequency F t Get 2-5 times of F, and less than half of the sampling frequency, in the present embodiment, F=1000Hz, F t = 2000Hz;
[0032] Step 3) From raw spectrum 0-F t In the frequency band amplitude sequence, all the spectral lin...
Embodiment 2
[0040] Embodiment 2, with reference to figure 1 , a method for optimizing the frequency spectrum harmonic averaging of rotating machinery, comprising the following steps:
[0041] Step 1) Perform Fourier transform on the original vibration signal to obtain the signal spectrum amplitude sequence {A i}, {i=1,2,L,N}, N is the number of sampling points;
[0042] Step 2) Determine the upper limit F of the signal analysis frequency band according to the equipment operating conditions and component parameter information, and obtain the analysis frequency range 0-F. The analysis frequency range 0-F contains 2-6 harmonics of the characteristic frequency. The component is mapped to its frequency division area, causing unnecessary false frequencies, and the frequency F is calculated t Get 2-5 times of F, and less than half of the sampling frequency, in the present embodiment, F=200Hz, F t = 800Hz;
[0043] Step 3) From raw spectrum 0-F t In the frequency band amplitude sequence, all...
PUM
 Abstract
Description
Claims
Application Information
 - R&D
- Intellectual Property
- Life Sciences
- Materials
- Tech Scout
- Unparalleled Data Quality
- Higher Quality Content
- 60% Fewer Hallucinations
Browse by: Latest US Patents, China's latest patents, Technical Efficacy Thesaurus, Application Domain, Technology Topic, Popular Technical Reports.
© 2025 PatSnap. All rights reserved.Legal|Privacy policy|Modern Slavery Act Transparency Statement|Sitemap|About US| Contact US: help@patsnap.com


