GIS fault diagnosis method based on sound intensity cloud picture

A fault diagnosis and cloud map technology, applied in circuit breaker testing, machine/structural component testing, ultrasonic/sonic/infrasonic measurement, etc., can solve the problem of poor anti-noise interference ability, inability to monitor signals effectively, and inability to obtain vibration characteristics and other issues, to achieve the effect of reducing the difficulty of measurement and making accurate judgments

Inactive Publication Date: 2019-06-14
ELECTRIC POWER RESEARCH INSTITUTE OF STATE GRID NINGXIA ELECTRIC POWER COMPANY +2
View PDF9 Cites 5 Cited by
  • Summary
  • Abstract
  • Description
  • Claims
  • Application Information

AI Technical Summary

Problems solved by technology

Among them, the ultra-high frequency method mainly realizes the detection of internal partial discharge by monitoring high-frequency signals, and cannot effectively monitor the low-frequency signals generated by mechanical failures.
The ultrasonic method monitors the insulation state by monitoring the ultrasonic signal generated by partial discharge, but it is easily affected by background noise such as partial discharge and wind, and has poor anti-noise interference ability
The vibration analysis method monitors the mechanical state of the GIS by measuring the vibration signal of the GIS shell, but this method is easily affected by the measurement position and cannot obtain the overall vibration characteristics of the GIS

Method used


Image

  • GIS fault diagnosis method based on sound intensity cloud picture
  • GIS fault diagnosis method based on sound intensity cloud picture
  • GIS fault diagnosis method based on sound intensity cloud picture

Examples


Embodiment 1

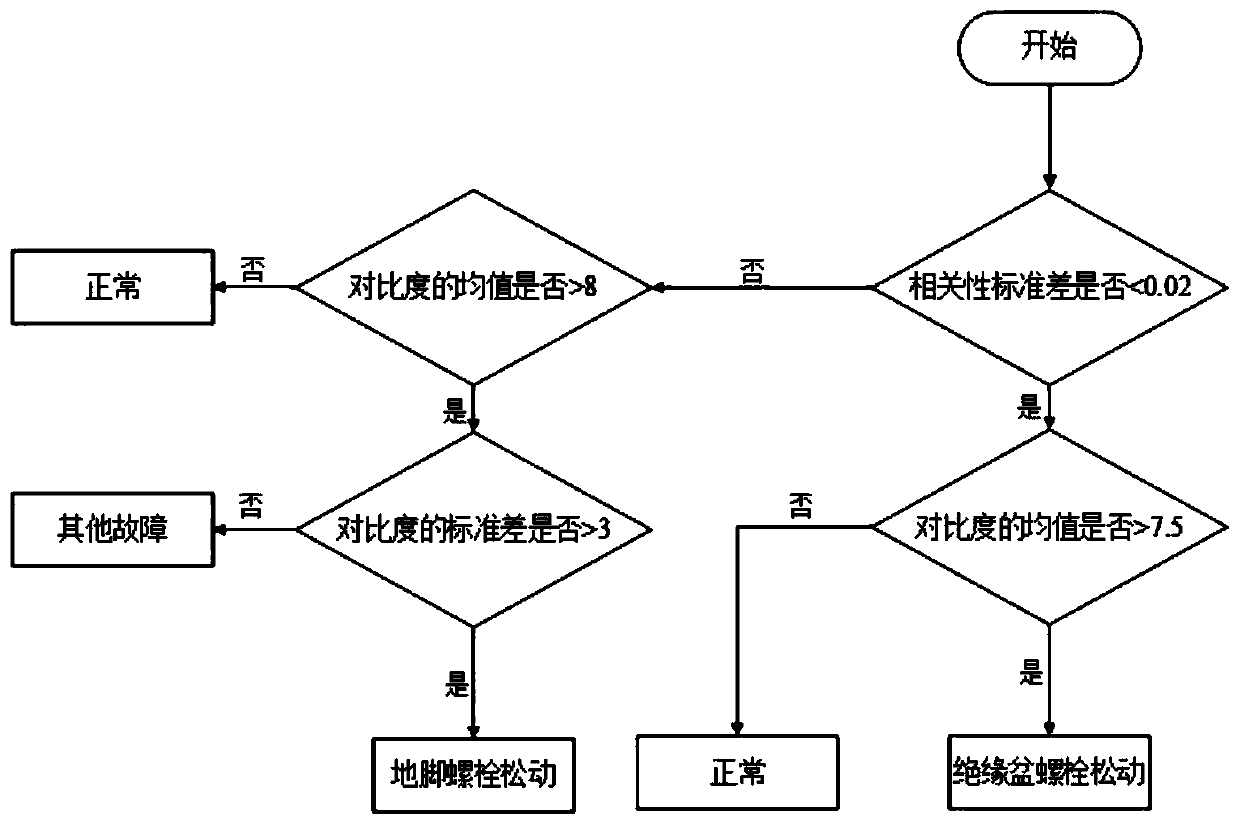
[0043] The inventive method comprises the following steps to the diagnosis of GIS mechanical failure:

[0044] (1) Set equally spaced measuring points at the GIS bus barrel and switchgear, and sweep all the measuring points sequentially through a hand-held ring-shaped sound pressure sensor array with 5 pairs of sensors, to obtain the GIS bus barrel and switch under different working conditions Acoustic pressure signal at the device;

[0045] (2) Calculate the sound pressure signals obtained by 5 pairs of sensors in step (1), obtain the sound intensity value at each pair of sensors, and finally obtain a sound intensity matrix of 5×N, where N is the number of measuring points;

[0046] (3) Carry out cubic spline interpolation drawing to the obtained sound intensity matrix, obtain the overall sound intensity nephogram at the GIS bus barrel and switchgear, then convert the color nephogram into a gray scale image;

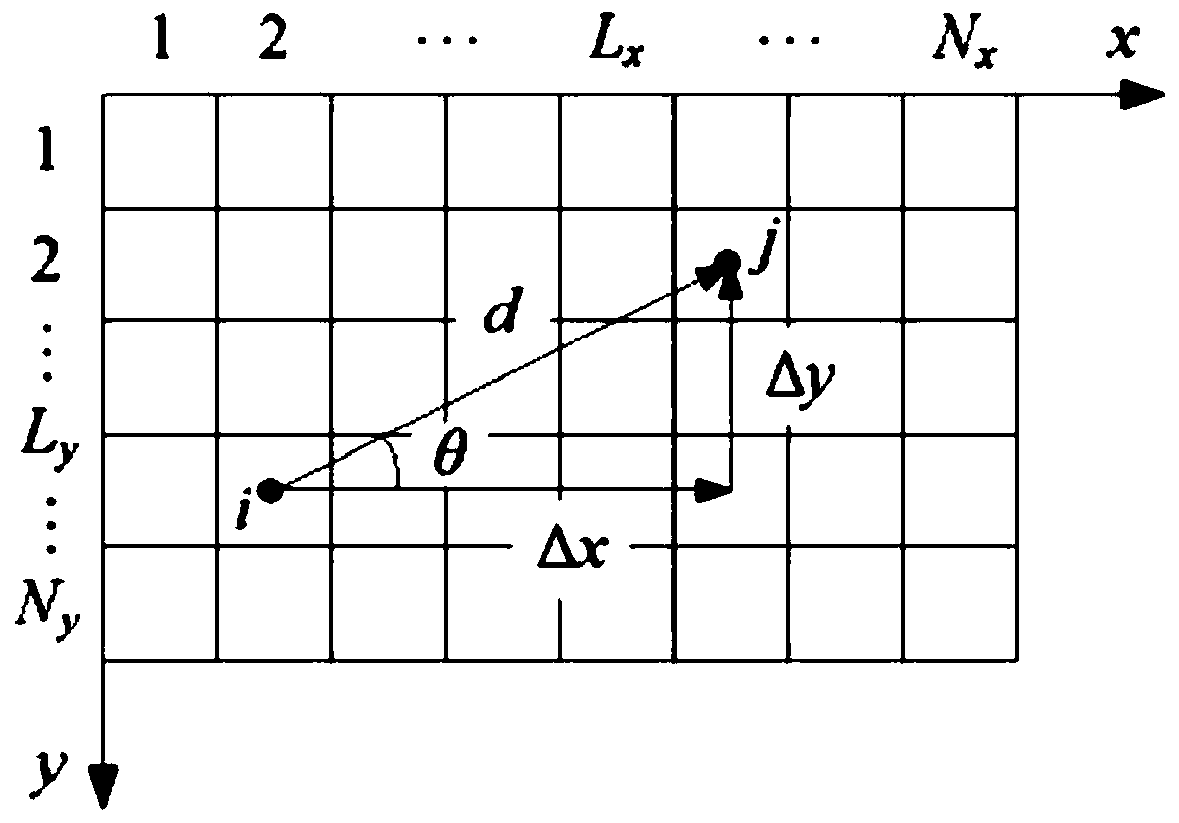
[0047] (4) Let the pixels of the grayscale image be N x ×N y , ...


PUM


Abstract

The invention relates to a GIS fault diagnosis method based on a sound intensity cloud picture. The method is characterized by comprising the following steps: (1) arranging equally-spaced measure points at a GIS busbar tube and switch equipment, orderly scanning all measure points through a handheld annular sound pressure sensor array with five pairs of sensors, thereby obtaining sound pressure signals of the GIS at the busbar tube and the switch equipment at different working conditions; (2) computing the sound pressure signals obtained by five pairs of sensors in the step (1) to obtain a sound intensity value at each pair of sensors, and finally obtaining the 5*N sound intensity matrix, wherein the N is the amount of the measure point; and (3) performing cubic spline interpolation on theobtained sound intensity matrix to obtain the entire sound intensity cloud picture at the GIS busbar tube and the switch equipment, and then converting the color cloud picture into a gray picture. The live line detection can be realized, the entire sound radiation characteristic of the GIS is acquired, the judgment is accurate, and the measurement difficulty can be reduced.

Description

technical field [0001] The invention relates to a GIS fault diagnosis method based on a sound intensity cloud image. Background technique [0002] GIS is one of the most important equipments in the power system, and its safe operation is closely related to the reliable operation of the power grid. If the GIS fails, it will lead to a large-scale power outage, which will not only affect the production of the factory, but also affect the lives of the people. Therefore, it is necessary to discover the hidden dangers of GIS in time, avoid sudden accidents, improve the reliability of power grid operation, and carry out research on GIS fault diagnosis methods is of great significance. [0003] In actual operation, the shell and conductive rod of GIS will vibrate due to the action of electromagnetic force. Common faults in GIS include internal partial discharge, loose bolts, poor contact of switches, etc. Partial discharge may be due to the reduction of dielectric strength caused...

Claims


Application Information

Patent Timeline
Patent Type & Authority Applications(China)
IPC IPC(8): G01M99/00G01H17/00G01R31/327
Inventor 李秀广吴旭涛张庆平闫振华周秀何宁辉汲胜昌朱洪波丁培郝金鹏马波马云龙刘世涛马飞越沙伟燕亓亮田禄
Owner ELECTRIC POWER RESEARCH INSTITUTE OF STATE GRID NINGXIA ELECTRIC POWER COMPANY
Why Eureka
Try Eureka