
Reservoir rock hole crack three-dimensional visualization and gas flow simulation method

A technology of gas flow and simulation method, which is applied in the field of three-dimensional visualization of rock pores and fissures and simulation of gas flow, which can solve the problems of incomparable distribution and strength indicators of rock pores and fissures, unreliable and accurate results, and time-consuming problems. , to achieve the effects of eliminating sample discreteness, promoting safe development, and reducing the probability of disasters

Inactive Publication Date: 2019-08-16
CHONGQING UNIV
View PDF2 Cites 14 Cited by
  • Summary
  • Abstract
  • Description
  • Claims
  • Application Information

AI Technical Summary

Problems solved by technology

[0004] Although the three-dimensional visualization method of reservoir rock studied above has promoted the development of intuitive and real observation of reservoir rock pores and fractures to a certain extent, there are still some deficiencies: 1) Although the two-dimensional image obtained by the sequential imaging method has a high resolution rate, but its samples may have irreversible errors after polishing and cutting, and it takes a lot of time
2) Compared with the sequential imaging method, the time spent by the focused scanning method is greatly reduced, but it can only scan slices of a certain thickness, which has certain limitations
3) Most of the samples used in CT research methods are small in size, which leads to the incomparability of rock pore crack distribution and strength indicators obtained in experiments.
4) Some of the CT research methods use CT numbers to indirectly infer the pore and fissure structure, which may lead to untrue and accurate results
5) Some CT research methods only analyze two-dimensional images, without establishing corresponding models, and cannot carry out the next step of simulation and 3D printing

Method used


Image

  • Reservoir rock hole crack three-dimensional visualization and gas flow simulation method

Examples


Embodiment Construction

[0045] Below in conjunction with accompanying drawing, the present invention will be further described, embodiment is exemplary, only for revealing and explaining the present invention, in order to fully understand the present invention, but does not therefore limit the present invention to described implementation within the scope of the example.

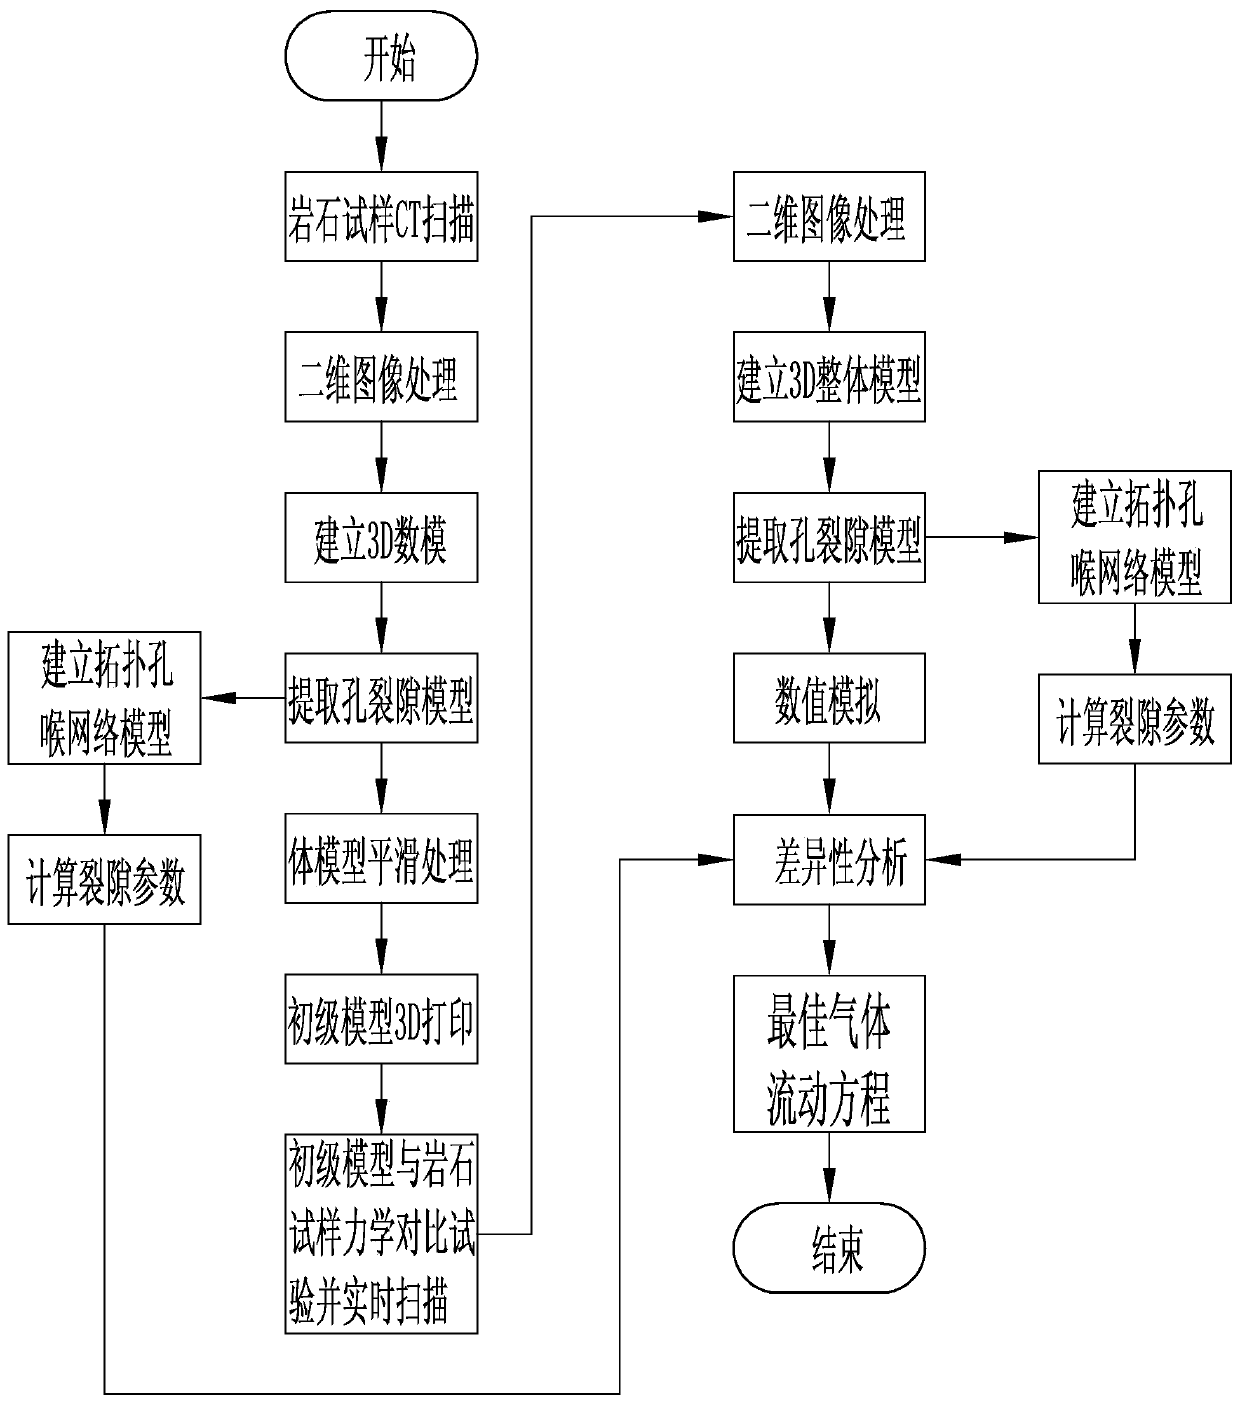
[0046] see figure 1 A method for three-dimensional visualization of reservoir rock pores and fractures and simulation of gas flow, comprising the following steps:

[0047] S1. Scanning of the original state of the rock sample and printing of the rock sample model: the rock sample model data is obtained by performing a three-dimensional CT scan on the rock sample in a non-stressed state, and the rock sample model is printed by processing the scanned data and 3D printing technology 3D printing;

[0048] S2, mechanical seepage physical experiment and real-time CT scanning simulation: conduct mechanical seepage physical experiment an...


PUM


Abstract

The invention discloses a reservoir rock pore fracture three-dimensional visualization and gas flow simulation method, which comprises the following steps: carrying out three-dimensional CT scanning on a rock sample in a non-stress state to obtain rock sample model data, and carrying out 3D printing on a rock sample model by processing the scanned data and a 3D printing technology; carrying out mechanical seepage physical experiments and real-time CT scanning on the rock sample and the rock sample model in a stress state respectively, and carrying out seepage numerical simulation on the basisof establishing a 3D digital model; analyzing the difference between the result of the mechanical seepage physical experiment and the result of gas seepage numerical simulation after real-time CT scanning, and deducing the most suitable gas flow equation in numerical simulation software through the result of the mechanical seepage physical experiment. The method has the beneficial effects that theapplication range is wide; compared with the prior art, the method has the advantages that visualization and reality are achieved, reservoir optimization can be carried out in the exploration stage,formulating of a construction scheme can be guided, the disaster occurrence probability can be reduced, safe development is promoted, and basic data are provided for exploring an efficient method.

Description

technical field [0001] The invention belongs to reservoir rock hole fissure simulation technology, in particular to a reservoir rock hole fissure three-dimensional visualization and gas flow simulation method. Background technique [0002] The 3D visualization of reservoir rock pores and fractures is an important method to study the structure of reservoir rock pores and fractures. The three-dimensional visualization of reservoir rocks refers to the acquisition of two-dimensional images of rocks with high-precision instruments such as high-power optical microscopes, scanning electron microscopes, or CT, and three-dimensional reconstruction of the two-dimensional images to achieve the goal of visualization. The experimental methods used to realize the three-dimensional visualization of reservoir rocks mainly include sequential imaging, focus scanning and CT scanning. [0003] The sequential imaging method is to grind and polish the rock sample used in the experiment to obtain...

Claims


Application Information

Patent Timeline
IPC IPC(8): G06T17/00G06F17/50
CPCG06T17/00G06F30/20
Inventor 蒋长宝尹光志刘晓冬吴家耀张东明段敏克杨阳陈昱霏金灼魏皑冬余塘李政科魏财
Owner CHONGQING UNIV
Learn More