Well leakage prediction method with seismic data

A technology of seismic data and prediction method, which is applied in the directions of surveying, earthwork drilling and production, wellbore/well components, etc. It can solve problems such as leakage channels, formation pressure deficit, pressure excitation, etc., achieve accuracy and efficiency improvement, and identification accuracy Effect of improvement, efficiency improvement of recognition

Active Publication Date: 2019-11-12
CHINA NAT PETROLEUM CORP CHUANQING DRILLING ENG CO LTD +1
View PDF10 Cites 3 Cited by
  • Summary
  • Abstract
  • Description
  • Claims
  • Application Information

AI Technical Summary

Problems solved by technology

[0002] During operations such as shale gas horizontal well drilling in the Sichuan Basin, lost circulation often occurs, which seriously affects the progress and development effect of shale gas exploration and development projects
[0006] 2. The performance of the drilling fluid is not good or the operation is improper, resulting in artificial leakage channels
[0007] 3. The pressure of the drilled formation is insufficient, or the density of the drilling fluid is too high, resulting in a large pressure difference
[0008] 4. The viscosity of the drilling fluid is too high and the shear force is too high, resulting in too high pressure to start the pump, resulting in pressure excitement and formation leakage
[0009] 5. The sand-carrying performance of the drilling fluid

Method used


Image

  • Well leakage prediction method with seismic data
  • Well leakage prediction method with seismic data
  • Well leakage prediction method with seismic data

Examples


Example Embodiment

[0042] Example 1

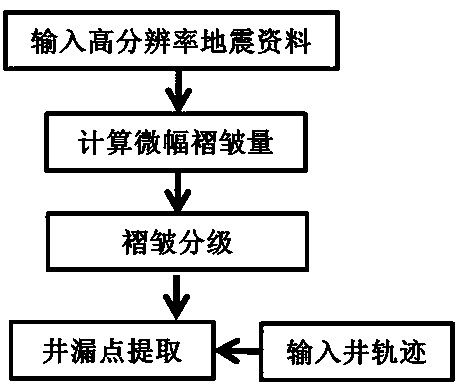
[0043] As a preferred embodiment of the present invention, it discloses a method for prediction of lost circulation from seismic data, the steps of which are:

[0044] a. High-resolution processing: processing conventional lower-resolution seismic data into high-resolution data;

[0045] b. Fine horizon comparison: Accurately pick up the seismic horizon according to the usual seismic horizon comparison technology;

[0046] c. Automatic recognition of folds: obtain the curvature of the stratum along the seismic horizon, find folds, and judge the positive or negative curvature at the same time;

[0047] d. Judgment of fold properties: judge whether it is an anticline or syncline according to the positive or negative change of curvature;

[0048] e. Extract the amplitude difference: calculate the amplitude difference in all directions within the range of the target layer based on the center of the slight fold;

[0049] f. Calculate the amount of slight wrinkles: comprehens...

Example Embodiment

[0056] Example 2

[0057] Reference figure 1 As the best embodiment of the present invention, the steps are:

[0058] a. High-resolution processing: processing conventional lower-resolution seismic data into high-resolution data; if the resolution of the seismic data is already high, this step can be ignored. The high-resolution processing method is arbitrary, but the resolution There should be a significant improvement.

[0059] b. Fine horizon comparison: Accurately pick up seismic horizons according to the usual seismic horizon comparison technology; the picked seismic horizons should be on the same reflection feature point or geological interface, and the reflection feature points are wave crests or troughs.

[0060] c. Automatic recognition of folds: obtain the curvature of the stratum along the seismic horizon, find folds, and judge the positive or negative curvature at the same time;

[0061] d. Judgment of fold properties: judge whether it is an anticline or a syncline accordin...

Example Embodiment

[0069] Example 3

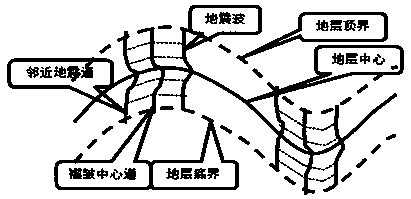
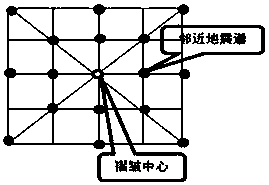
[0070] Specific application examples: Refer to 2 and 3 to clarify the principles of specific calculation methods.

[0071] figure 2 It contains an anticline and a syncline, just take an anticline as an example. Determine the center of the formation, and the thickness of the formation (the length of the time window when the seismic profile is in the time domain) is the range between the top and bottom of the formation. According to the horizon data picked up from the stratum center, the curvature can be calculated, the folds can be found, and the positive and negative of the curvature (anisotropic and syncline properties) can be obtained, and the seismic trace—the central trace—where the core of the fold and the center of the fold is located can be determined. Calculate the amplitude difference on both sides of the center track point by point. In actual calculations, it is also based on image 3 Calculate the amplitude difference between the multiple channels i...


PUM


Abstract

The invention discloses a well leakage prediction method with seismic data, and relates to the technical field of seismic data application of oil and gas field exploration and development. The well leakage prediction method includes the steps that a, high resolution processing is conducted; b, fine horizon correlation is conducted; c, a fold is automatically identified, specifically, formation curvature is obtained along the seismic horizon; d, the fold property is judged, specifically, anticline or syncline are judged according to positive and negative change of the curvature; e, amplitude difference is extracted, specifically, the amplitude difference of each direction in the range of a target layer is calculated with the center of a micro-amplitude fold; f, the micro-amplitude fold amount is calculated, specifically, according to three parameters of positive and negative sign symbols of the curvature, the curvature and an amplitude difference value, the micro-amplitude fold amount is calculated comprehensively; g, the micro-amplitude fold is classified, specifically, according to the calculated micro-amplitude fold amount, the micro-amplitude fold is classified; and h, a well leakage point is predicted, specifically, according to well trajectory coordinates, possible well leakage point positions are picked up from distribution data of the micro-amplitude fold. According to the well leakage prediction method, the accuracy and the efficiency for predicting the fractured leakage point of a horizontal well according to the micro-amplitude fold are significantly improved.

Description

technical field [0001] The invention relates to the technical field of application of seismic data in exploration and development of oil and gas fields, in particular to a method for predicting lost circulation of seismic data. Background technique [0002] During the drilling of shale gas horizontal wells in the Sichuan Basin, lost circulation often occurs, which seriously affects the progress and development effect of shale gas exploration and development projects. [0003] Lost circulation refers to a kind of downhole fluid that directly enters the formation under the action of pressure difference when various working fluids, including drilling fluid, cement slurry, completion fluid and other fluids, etc. Complications. The present invention mainly refers to the lost circulation in the drilling process. Most drilling processes have varying degrees of lost circulation. Severe lost circulation will lead to a drop in pressure in the well, affecting normal drilling, causin...

Claims


Application Information

Patent Timeline
IPC IPC(8): E21B47/00E21B47/10G06Q50/02
CPCE21B47/00E21B47/10G06Q50/02
Inventor 吴大奎吴宗蔚胡天文欧阳明华
Owner CHINA NAT PETROLEUM CORP CHUANQING DRILLING ENG CO LTD
Why Eureka
Try Eureka