Kelvin probe force microscope measurement method based on T-shaped cantilever beam probe
A Kelvin probe force, cantilever beam probe technology, applied in scanning probe microscopy, measuring devices, scanning probe technology, etc., can solve the problems affecting the accuracy of surface potential measurement results, and achieve suppression of homogenization effects , the effect of high practical value
- Summary
- Abstract
- Description
- Claims
- Application Information
AI Technical Summary
Problems solved by technology
Method used
Image
Examples
specific Embodiment approach 1
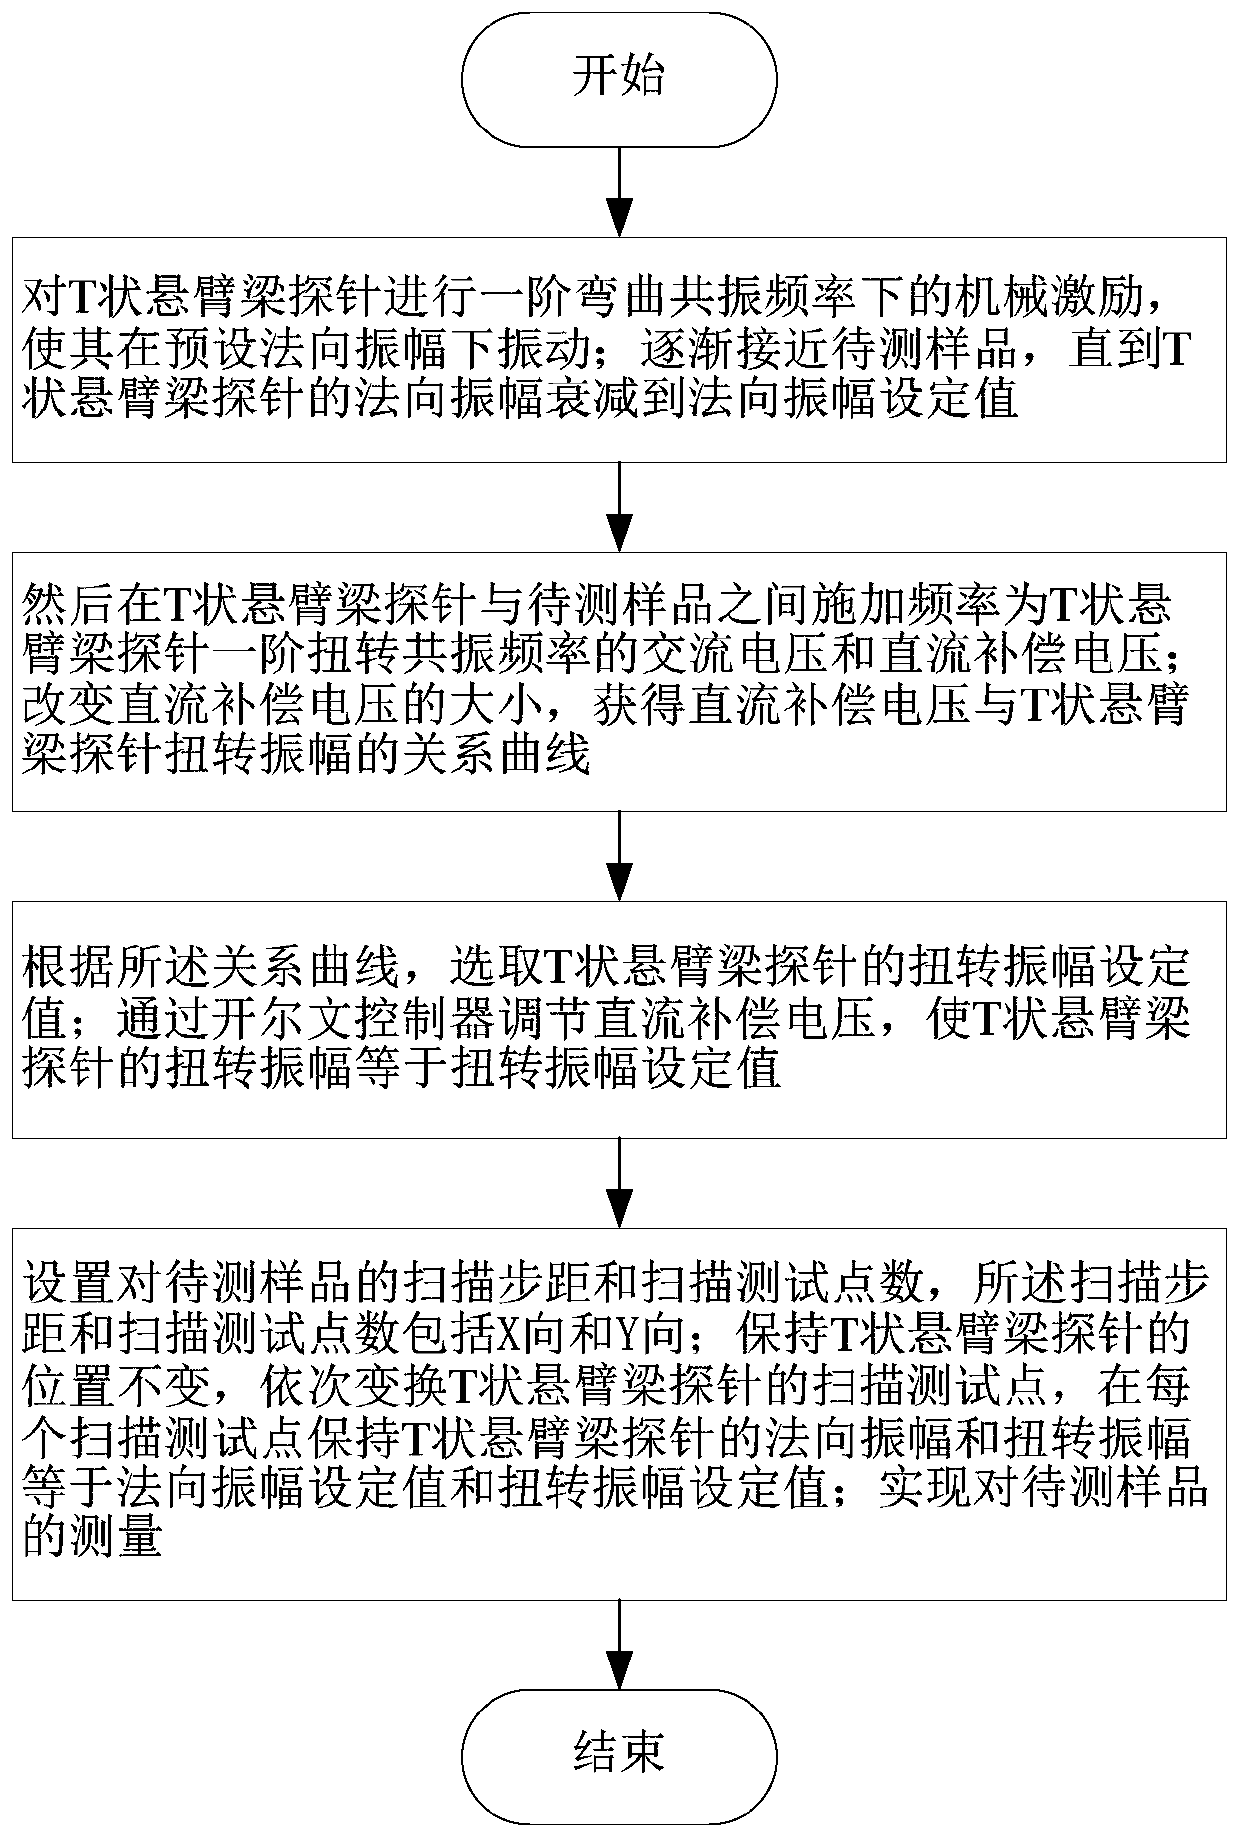
[0043] Specific implementation mode 1. Combination Figure 1 to Figure 7 Shown, the present invention provides a kind of Kelvin probe force microscope measurement method based on T-shaped cantilever beam probe, comprises the following steps:
[0044] Mechanically excite the T-shaped cantilever beam probe at the first-order bending resonance frequency to make it vibrate at the preset normal amplitude; gradually approach the sample to be tested until the normal amplitude of the T-shaped cantilever beam probe decays to the normal direction Amplitude setting value;
[0045] Then between the T-shaped cantilever beam probe and the sample to be tested, apply the AC voltage and the DC compensation voltage whose frequency is the first-order torsional resonance frequency of the T-shaped cantilever beam probe; change the size of the DC compensation voltage to obtain the DC compensation voltage and the T-shaped The relationship curve of the torsional amplitude of the cantilever beam prob...
specific Embodiment
[0088] Specific embodiment: Utilize the method of the present invention to measure the tobacco mosaic virus sample with nanoscale diameter; Figure 8 is the scanned surface topography of the tobacco mosaic virus sample, and the protruding linear part in the figure is the tobacco mosaic virus; Figure 9 is corresponding Figure 8 The profile line diagram of the marked line, the result shows that its height is 20nm; Figure 10 is the scanning surface potential difference map of the tobacco mosaic virus sample; Figure 11 is corresponding Figure 10 The statistical distribution of the data in and the bimodal fitting results show that the potential difference between the tobacco mosaic virus sample and the substrate is 94.1mV, the scanning range is 0.75μm*0.75μm, and the number of scanning points is 150*150.
PUM
| Property | Measurement | Unit |
|---|---|---|
| height | aaaaa | aaaaa |
Abstract
Description
Claims
Application Information
 - R&D
- Intellectual Property
- Life Sciences
- Materials
- Tech Scout
- Unparalleled Data Quality
- Higher Quality Content
- 60% Fewer Hallucinations
Browse by: Latest US Patents, China's latest patents, Technical Efficacy Thesaurus, Application Domain, Technology Topic, Popular Technical Reports.
© 2025 PatSnap. All rights reserved.Legal|Privacy policy|Modern Slavery Act Transparency Statement|Sitemap|About US| Contact US: help@patsnap.com


