Open source software reliability modeling method based on random fault introduction
A technology of open source software and modeling methods, applied in software testing/debugging, instrumentation, electrical digital data processing, etc., can solve problems such as missed opportunities and inconformity with the actual situation of open source software
- Summary
- Abstract
- Description
- Claims
- Application Information
AI Technical Summary
Problems solved by technology
Method used
Image
Examples
Embodiment 1
[0079] Description of Open Source Software Fault Dataset
[0080] The fault dataset used in the present invention is collected from three Apache open source software product projects (https: / / issues.apache.org / jira / issues), such as KNOX, NIFI and TEZ. Every project of open source software has three consecutive releases. The first fault dataset (DS1) collected from the Apache open source software product KNOX project has three subsets, namely KNOX 0.3.0 (DS1-1), knox0.4.0 (DS1-2) and knox0.5.0 (DS1- 3). The second set of fault data collected by Apache open source software product NIFI project has three subsets: NIFI 1.2.0 (DS2-1), NIFI 1.3.0 (DS2-2) and NIFI 1.4.0 (DS2-3). The third fault dataset collected from the TEZ project of Apache open source software products has three subsets: TEZ 0.2.0 (DS3-1), TEZ 0.3.0 (DS3-2), and TEZ 0.4.0 (DS3-3 ). Note that bug attributes in bug tracking systems include type, status, and resolution. The types of failure data we collect inclu...
Embodiment 2
[0092] Model Comparison Criteria
[0093] The present invention uses five model comparison criteria to evaluate the performance of the model.
[0094] 1. Mean Square Error (Mean Square Error, MSE)
[0095]
[0096] and
[0097]
[0098] 2. R-square (R 2 )
[0099]
[0100] 3. The Root Mean Square Error (RMSE)
[0101]
[0102] and
[0103]
[0104] 4.The Theil statistic(TS)
[0105]
[0106] and
[0107]
[0108] 5. Bias
[0109]
[0110] and
[0111]
[0112] In formula (6) ~ formula (14), ψ(t k ) means to time t k Estimate the number of detected faults so far. Λ(tk) means until time t k The number of failures observed so far. n and m denote the sample size of the failure dataset. In equations (7, 10, 12, 14), (n-m) fault points are used to estimate model parameter values, and the remaining fault points are used to calculate predicted values. MSE (MSE predict ), RMSE (RMSE predict ), TS (TS predict ) and Bias(Bias predict ) The sm...
Embodiment 3
[0114] Model performance comparison
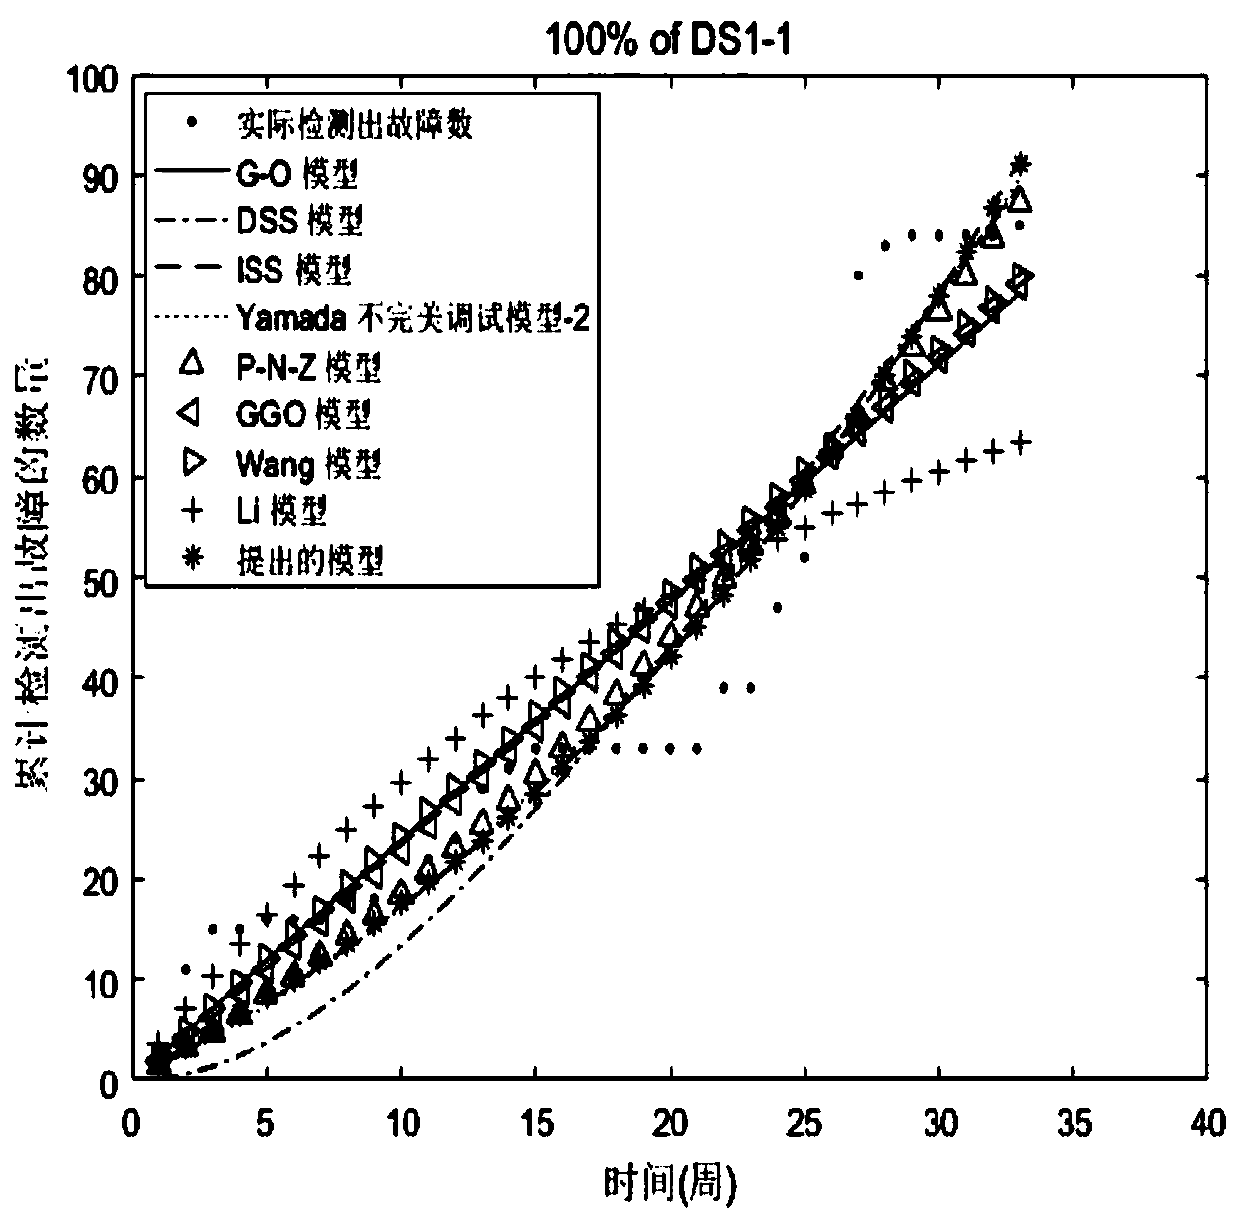
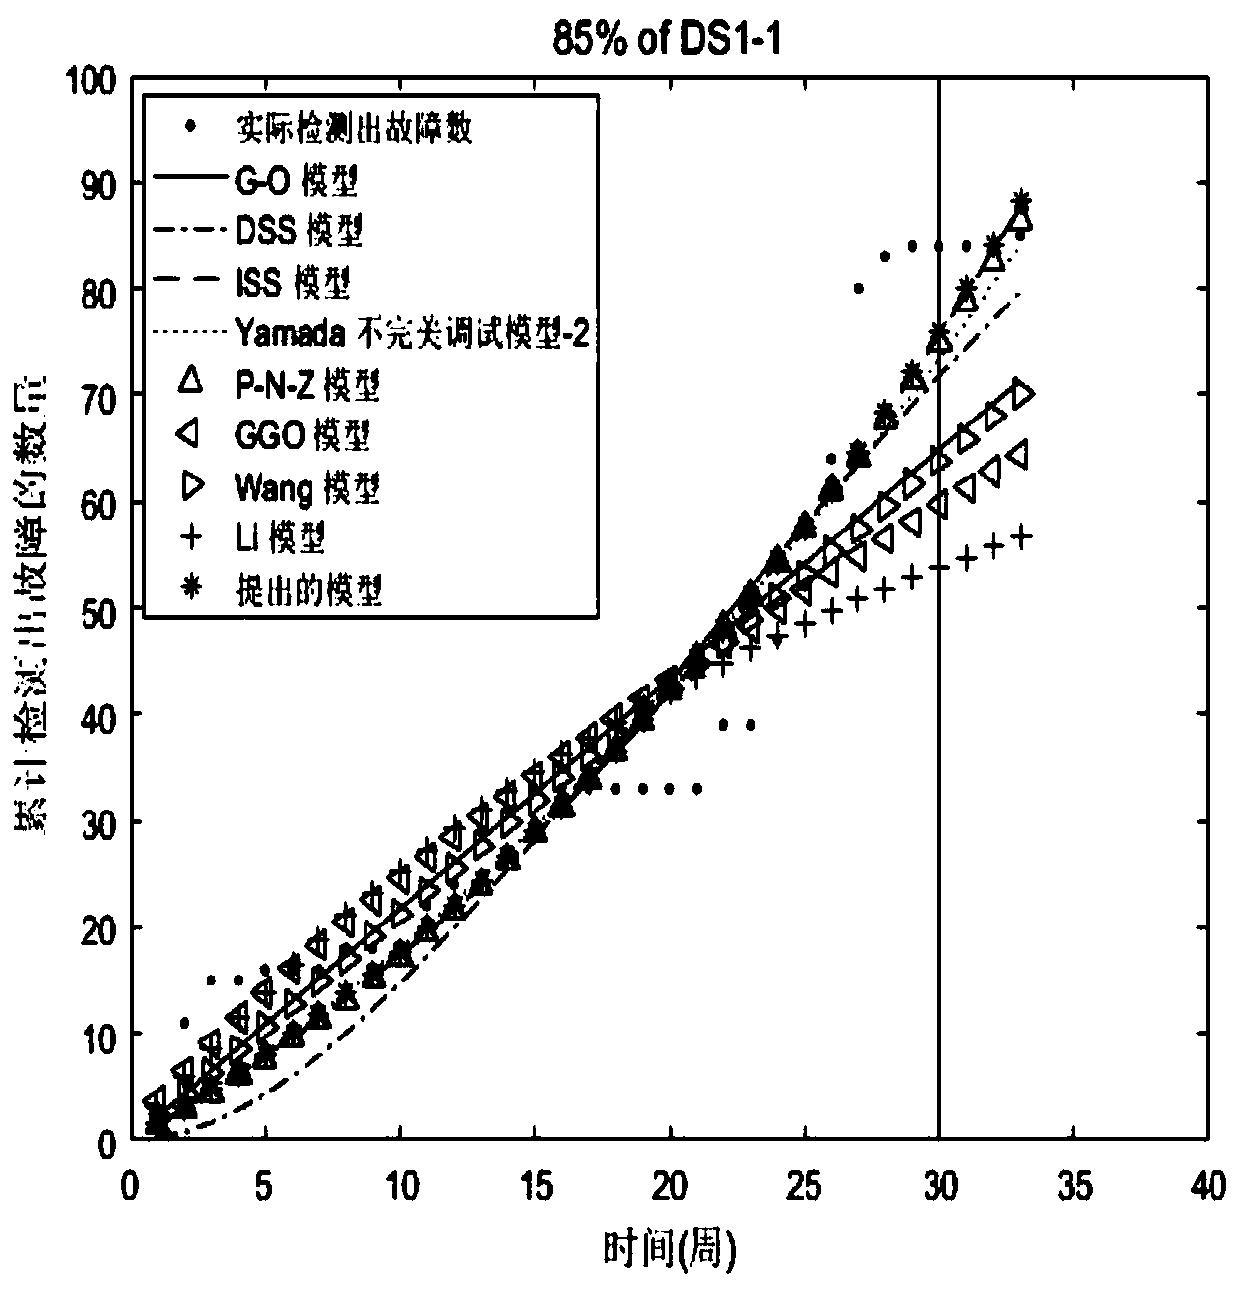
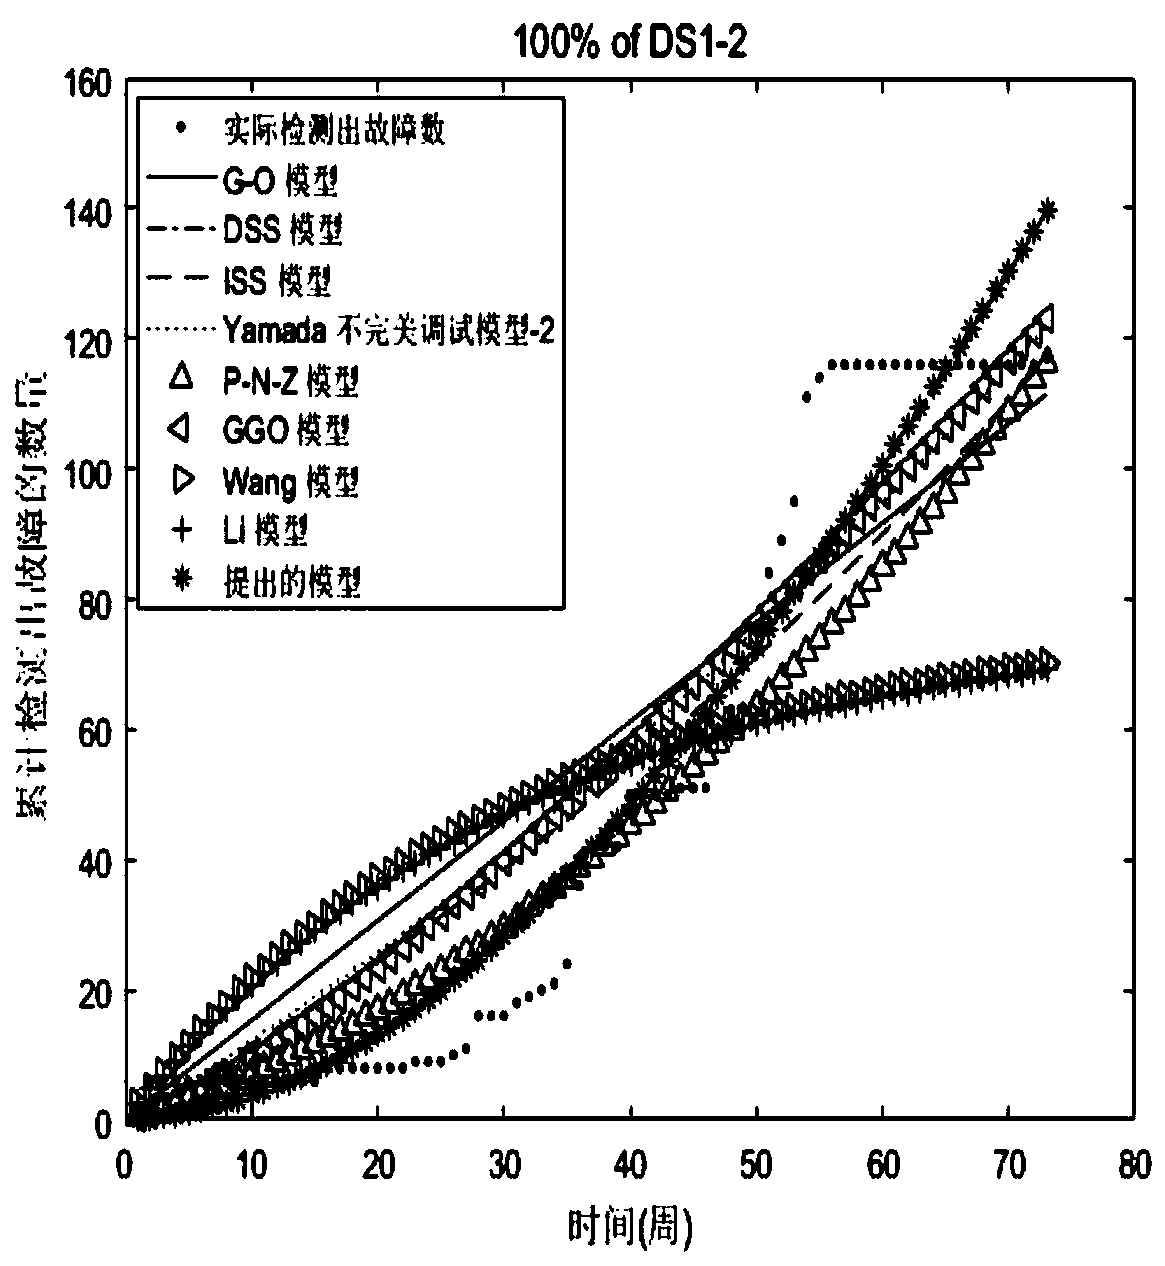
[0115] In terms of fitting, 100% of the fault data are used to fit and estimate the model parameter values, and the fitting performance of the models is compared. In terms of prediction, 85% of the fault data is used to fit and estimate the model parameter values, and the remaining fault data (25% of the fault data) is used to compare the model prediction performance.
[0116] It can be seen from Table 6 that using 100% of the data (DS1-1), the proposed model's MSE, R 2 , RMSE, TS and Bais are 49.5, 0.9249, 7.04, 14.9 and 5.95, respectively. The model has better fitting performance than G-O model, DSS model, ISS model, Yamada imperfect adjustment model-2, P-N-Z model, GGO model, Wang model and Li model. The second place is the ISS model with MSE (52.09), R 2 (0.921), RMSE (7.22), TS (15.28), and Bais (6.16). The worst is the Li model, with MSE (178.49), R 2 (0.7292), RMSE (13.36), TS (28.29), and Bais (11.25). When using 100% of the ...
PUM
 Abstract
Description
Claims
Application Information
 - R&D
- Intellectual Property
- Life Sciences
- Materials
- Tech Scout
- Unparalleled Data Quality
- Higher Quality Content
- 60% Fewer Hallucinations
Browse by: Latest US Patents, China's latest patents, Technical Efficacy Thesaurus, Application Domain, Technology Topic, Popular Technical Reports.
© 2025 PatSnap. All rights reserved.Legal|Privacy policy|Modern Slavery Act Transparency Statement|Sitemap|About US| Contact US: help@patsnap.com


