Voltage measurement data reduction method and identification method for different voltage levels in substations
A technology of voltage level and voltage measurement, which is applied in the direction of measuring current/voltage, measuring only voltage, and measuring electrical variables, etc., which can solve the problem of abnormal state identification, low precision and accurate deviation of calculated values that affect voltage measurement data Value and other issues
- Summary
- Abstract
- Description
- Claims
- Application Information
AI Technical Summary
Problems solved by technology
Method used
Image
Examples
Embodiment 1
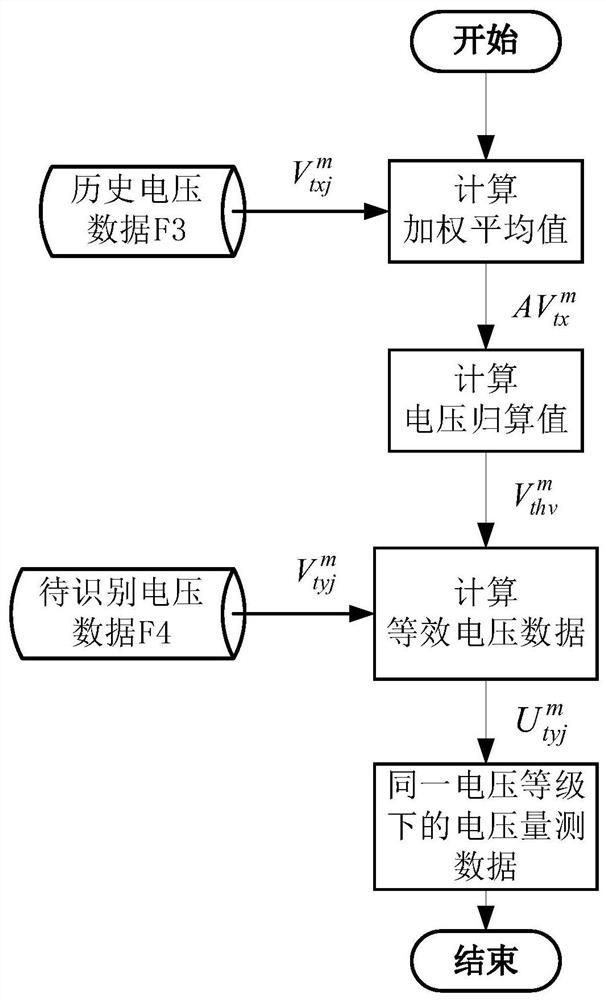
[0066] Such as figure 1 As shown, the voltage measurement data reduction method of different voltage levels of the substation of the present invention comprises the following steps:
[0067] S1: According to the historical voltage data F3, calculate the weighted average value of m different voltage levels of the transformer Among them, m represents the substation voltage level dimension, 1≤m≤N, N is a positive integer; tx represents the time moment, 1≤tx≤t s , t s is the total time of the historical voltage data file, take a positive integer;
[0068] S2: According to step S1, use the following formula to convert the m-side voltage of the transformer to the l-side voltage to obtain the voltage reduction value
[0069]
[0070] In the formula, is the weighted average value of m different voltage levels of the transformer, is the weighted average value of different voltage levels of the transformer l; tx means the txth moment; t s is the time moment; 1≤l≤N, l≠m, N ...
Embodiment 2
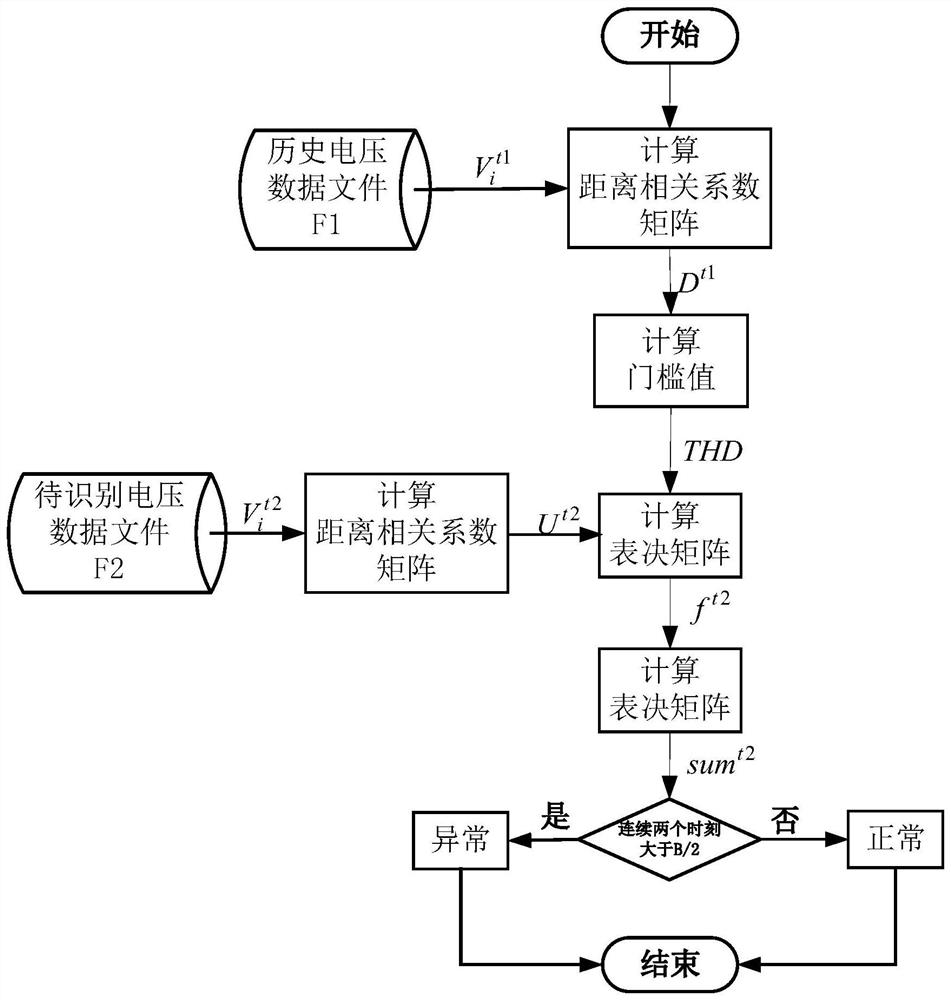
[0095] Such as figure 2 As shown, the difference between this embodiment and Embodiment 1 is that this embodiment provides a method for identifying anomalies in grid voltage measurement based on distance correlation coefficients, including the following steps:
[0096] S0: Use the grid voltage data acquisition system to collect historical voltage data and form a historical voltage data file F1; the historical voltage data file F1 includes voltage data of the same substation, different intervals, different voltage levels, and the same phase Among them, t1 represents the time scale, and the value range is T1 is the time length of the F1 file; sam is the sampling interval of the grid voltage data acquisition system; i is the different intervals of the same voltage level of the substation, the value range is 1≤i≤B, and B is the total number of intervals of the same voltage level of the substation;
[0097] S1: Using the voltage measurement data reduction method of different vo...
PUM
 Abstract
Description
Claims
Application Information
 - R&D
- Intellectual Property
- Life Sciences
- Materials
- Tech Scout
- Unparalleled Data Quality
- Higher Quality Content
- 60% Fewer Hallucinations
Browse by: Latest US Patents, China's latest patents, Technical Efficacy Thesaurus, Application Domain, Technology Topic, Popular Technical Reports.
© 2025 PatSnap. All rights reserved.Legal|Privacy policy|Modern Slavery Act Transparency Statement|Sitemap|About US| Contact US: help@patsnap.com


