Urban local climate region classification method based on multi-source data

A multi-source data and classification method technology, applied to computer parts, instruments, calculations, etc., can solve the problems of urban GIS data not being open to the public, lack of building height information, and difficult to obtain data, so that the technical route can be replicated and applied The effect of widening the target and improving precision

Pending Publication Date: 2020-11-10
HOHAI UNIV
View PDF1 Cites 2 Cited by
  • Summary
  • Abstract
  • Description
  • Claims
  • Application Information

AI Technical Summary

Problems solved by technology

This method is widely used due to its high efficiency, but because the input data of this method is Landsat data with medium resolution, and the input data lacks the building height information of the three-dimensional shape of urban buildings, the classification accuracy of this method is not high. and has been shown to be more suitable for local climate subregions in large regions
On the contrary, the GIS-based method uses the parameters extracted from a variety of high-precision urban GIS vector data, and performs LCZ classification through threshold division. Although the LCZ classification accuracy is high, it needs to input a large amount of urban GIS data, and these data are usually Difficult to access, as many urban GIS data are not available to the public

Method used


Image

  • Urban local climate region classification method based on multi-source data
  • Urban local climate region classification method based on multi-source data
  • Urban local climate region classification method based on multi-source data

Examples


Embodiment Construction

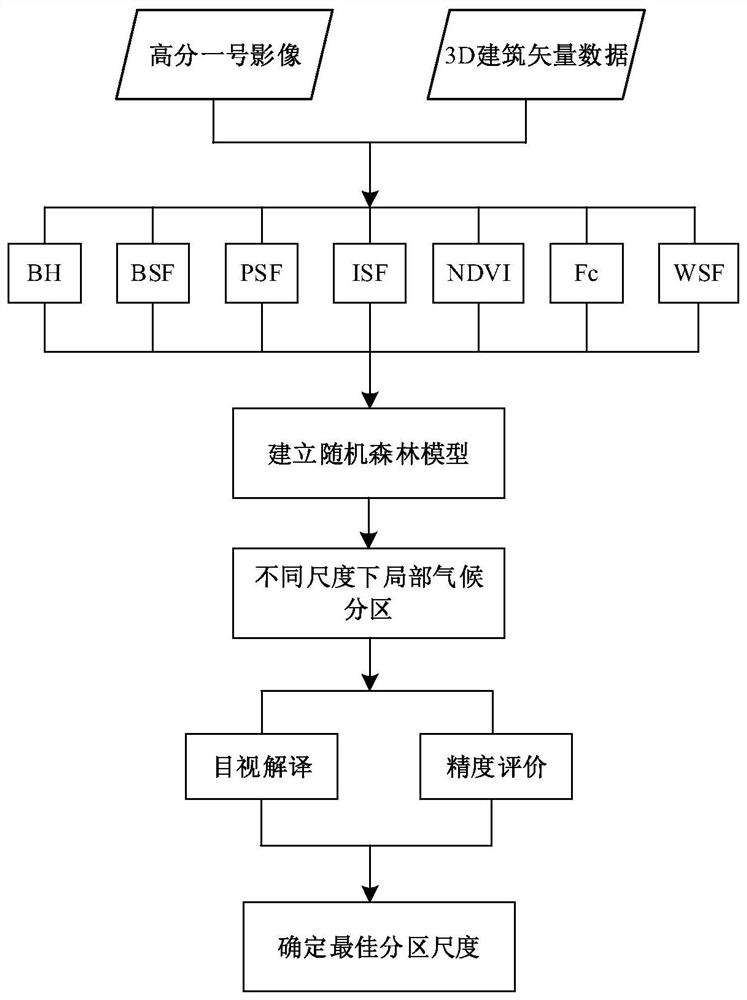
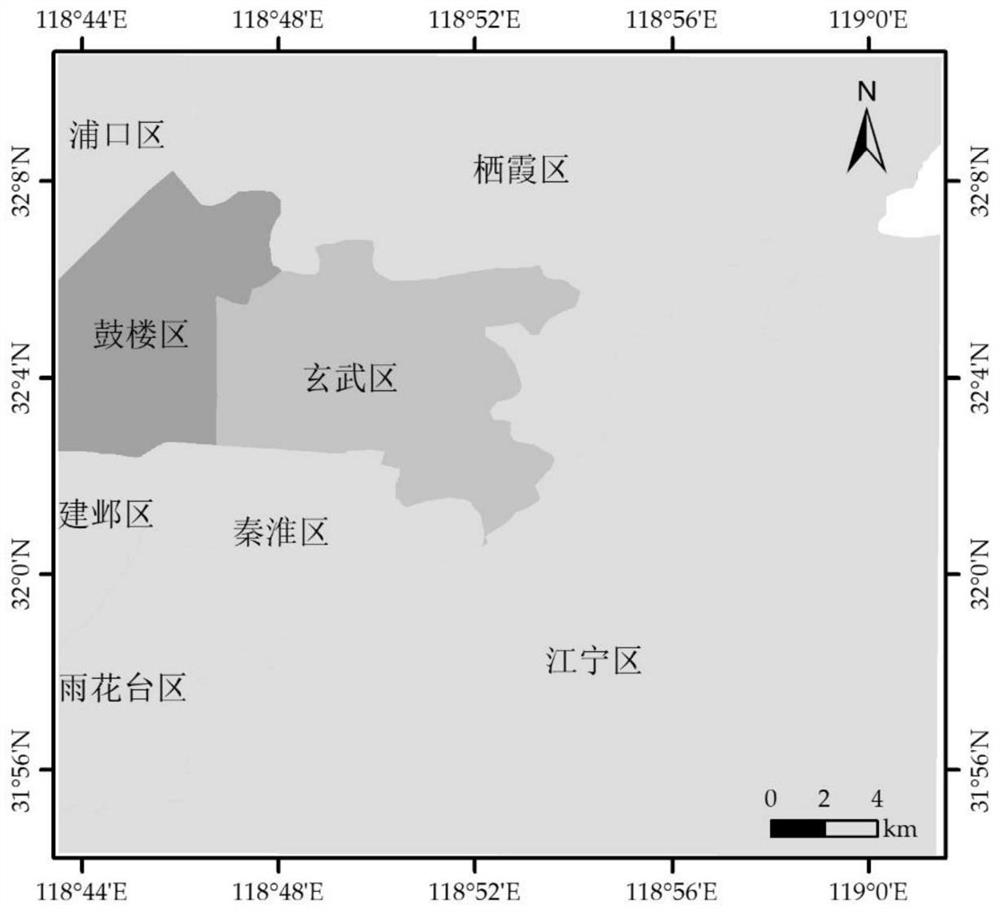
[0038] Such as Figure 1~2, taking the main urban area of ​​Nanjing as the research area, including the following steps:

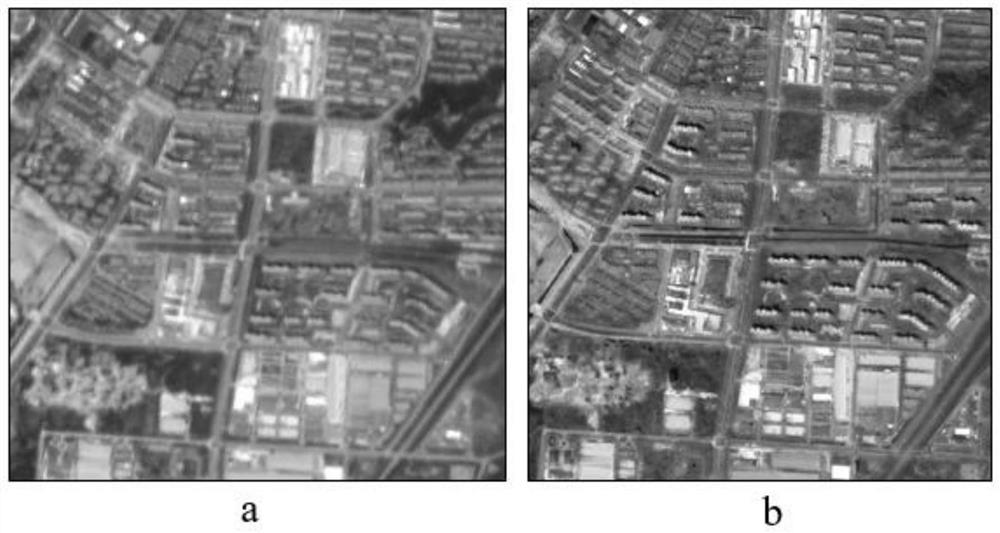
[0039] Step 1: Firstly, the Gaofen-1 image and urban 3D building data in the research area are acquired and preprocessed. The remote sensing image acquired in this example is the Gaofen-1 image on June 17, 2016. The image includes panchromatic images and multispectral images. The preprocessing used mainly includes radiation correction, geometric correction, image fusion and image cropping . In the ENVI software, the multispectral and panchromatic images of the Gaofen-1 image are respectively subjected to radiometric correction and geometric correction, and the two images are fused. The fused resolution is 2 meters, as shown in image 3 , and then crop the image to the size of the study area. In addition, the urban 3D building vector data used in this example in 2016 also needs to be cropped to the size of the research area, such as Figure 4 .

[0040...


PUM


Abstract

The invention discloses an urban local climate region classification method based on multi-source data, and the method comprises the following steps: 1, obtaining a Gaofen-1 image and urban 3D building data in a research region range, and carrying out preprocessing; 2, extracting parameters for local climate partitioning, including the building height, building surface score, normalized vegetationindex, vegetation coverage, permeable surface score, water surface score and impermeable surface score, establishing regular grids of different scales, and extracting LCZ partitioning parameters of corresponding spatial scales based on the regular grids of different scales; 3, establishing a random forest classification model; 4, based on the established random forest classification model, carrying out local climate region classification of different scales; and 5, selecting an optimal local climate partition scale through visual interpretation and quantitative precision evaluation. Accordingto the method, the advantages of two local climate partitioning methods are effectively combined, and the precision and high efficiency of local climate partitioning are improved.

Description

technical field [0001] The invention belongs to a climate zone classification method, in particular to a multi-source data-based urban local climate zone classification method. Background technique [0002] Rapid urbanization leads to changes in land cover, urban geometry and urban structure, thereby increasing urban heat absorption and changing local climate. Urban heat island is one of the consequences of urbanization, which refers to a phenomenon in which the temperature in the city is higher than that in the suburbs. Traditional research on urban heat island intensity mainly focuses on the calculation of the temperature difference between urban and rural areas, the calculation of the temperature difference between the permeable surface and the impermeable surface, or the calculation of the temperature difference between the vegetation area and the non-vegetation area, and there is a lack of unified standards for these. , The shortcoming of too strong subjectivity, becau...

Claims


Application Information

Patent Timeline
Patent Type & Authority Applications(China)
IPC IPC(8): G06K9/62
CPCG06F18/24323G06F18/25
Inventor 杨英宝胡佳潘鑫章勇
Owner HOHAI UNIV
Why Eureka
Try Eureka