
Imaging-mass-spectrometry-data processing device

A data processing device and mass spectrometry analysis technology, applied in the field of imaging mass spectrometry data processing devices, can solve problems such as user misjudgment

Pending Publication Date: 2020-12-18
SHIMADZU SEISAKUSHO CO LTD
View PDF7 Cites 0 Cited by
  • Summary
  • Abstract
  • Description
  • Claims
  • Application Information

AI Technical Summary

Problems solved by technology

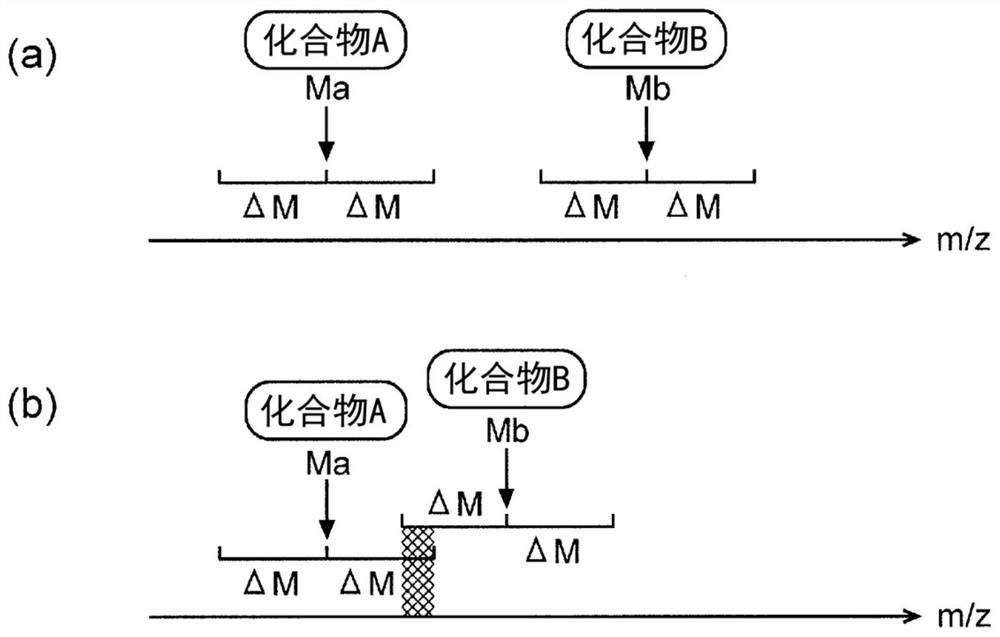
[0007] In this case, when the user does not accurately grasp the mass-to-charge ratio of the designated compound, there is a spatial distribution in which the user misjudges that one of the plurality of compounds does not substantially exist in the sample. very close concerns
On the other hand, there is also the possibility that the user may mistakenly judge that the spatial distribution of one compound does not exist in the other compound even though the specified multiple compounds are present in the sample with close spatial distributions.

Method used


Image

  • Imaging-mass-spectrometry-data processing device
  • Imaging-mass-spectrometry-data processing device
  • Imaging-mass-spectrometry-data processing device

Examples


Embodiment Construction

[0048] Next, an embodiment of an imaging mass spectrometry apparatus including an imaging mass spectrometry data processing apparatus according to the present invention will be described with reference to the drawings.

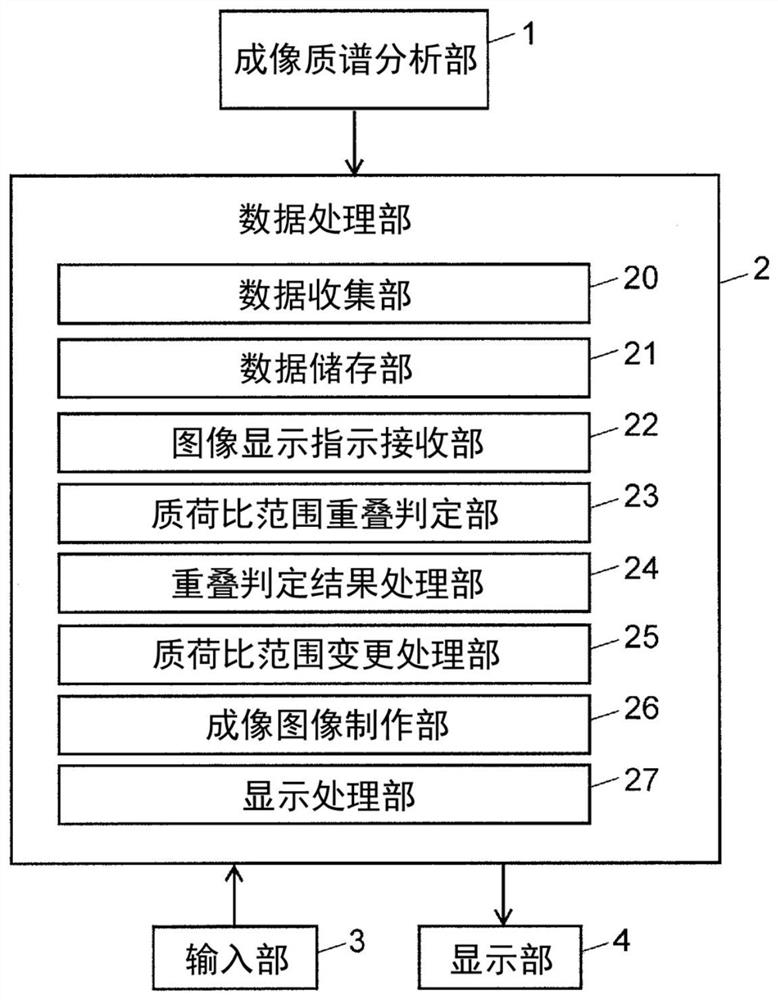
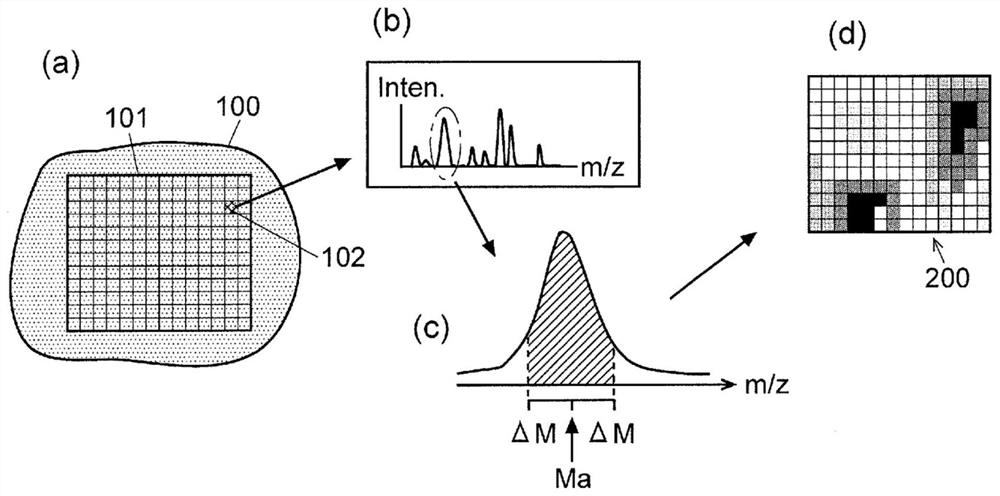
[0049] figure 1 is a schematic structural diagram of the imaging mass spectrometry device according to the present embodiment, figure 2 It is an explanatory diagram of the MS imaging image creation operation in the imaging mass spectrometer of this embodiment.

[0050] The imaging mass spectrometry apparatus of this embodiment includes an imaging mass spectrometry unit 1 for measuring a sample, a data processing unit 2 , and an input unit 3 and a display unit 4 as user interfaces. Note that description is omitted here, but the imaging mass spectrometer further includes an optical microscopic imaging unit that captures an optical microscopic image on a sample.

[0051] The imaging mass spectrometry section 1 includes, for example, a matrix-assisted laser de...


PUM


Abstract

In the present invention, after an imaging mass spectrometry unit (1) collects mass spectrometry data for multiple measurement points within a two-dimensional area on a sample, a user inputs, from aninput unit (3), compounds of interest that the user wants to view the two-dimensional distributions of. For each compound of interest, an image display instruction reception unit (22) determines an m / z range for data summing from a precise m / z value and an m / z tolerance. A mass-to-charge-ratio-range overlap determination unit (23) determines whether the m / z ranges of a plurality of compounds overlap. If there are overlapping ranges, an overlap-determination-result processing unit (24) will, for example, create a list of compounds having overlapping m / z ranges and display the list on the screenof a display unit (4). Thus, the user is prompted to reconsider the compounds and tolerance values. Further, in a state where there are overlapping m / z ranges, MS imaging images for each of the compounds may be created and displayed in a list, and MS imaging images for compounds having overlapping m / z ranges may be marked so as to be distinguishable from other images.

Description

technical field [0001] The present invention relates to a method for processing, producing and displaying, for example, a two-dimensional intensity distribution representing a specific substance, of mass spectrometry data of each of many microregions in a two-dimensional region on a sample collected by an imaging mass spectrometry device The imaging mass spectrometry data processing device of the image. Background technique [0002] An imaging mass spectrometer is capable of measuring the two-dimensional intensity distribution of ions with a specific mass-to-charge ratio m / z on the surface of the same sample while observing the surface morphology of a sample such as a biological tissue slice through an optical microscope device (see Patent Document 1, Non-Patent Document 1, etc.). By observing mass spectrometry imaging images related to compound-derived ions characteristically appearing in a specific disease such as cancer using an imaging mass spectrometer, the spread of t...

Claims


Application Information

Patent Timeline
Patent Type & Authority Applications(China)
IPC IPC(8): G01N27/62
CPCH01J49/0004
Inventor 押川伦宪
Owner SHIMADZU SEISAKUSHO CO LTD
Learn More