Transformer area user-transformer relation abnormity diagnosis method and device

A technology for abnormal diagnosis and station area, applied in the direction of measuring devices, measuring electrical variables, information technology support systems, etc., can solve problems such as difficulty in extracting abnormal user features, low similarity of voltage fluctuation curves, and limited information of representations, etc., to achieve high efficiency Realize the effect of feature information mining, improve detection efficiency and accuracy

Pending Publication Date: 2021-04-23
STATE GRID HUNAN ELECTRIC POWER +2
View PDF0 Cites 6 Cited by
  • Summary
  • Abstract
  • Description
  • Claims
  • Application Information

AI Technical Summary

Problems solved by technology

[0003] In the prior art, there are mainly two methods of on-site identification by manual special equipment and online automatic identification in the verification station area. The manual method needs to arrange staff to identify on-site, which has low identification efficiency and high cost. Online automatic identification can solve the problem of manual identification. The above-mentioned problems existing in the method, the current online automatic identification method is mainly based on data mining technology, by extracting the abnormal user characteristics of the station area to identify the station area with the same characteristics, such as by extracting the similarity characteristics of the user voltage curve to realize the abnormal diagnosis of the household change relationship in the station area , in the low-voltage distribution network, due to the uncertainty of the loads everywher

Method used


Image

  • Transformer area user-transformer relation abnormity diagnosis method and device
  • Transformer area user-transformer relation abnormity diagnosis method and device
  • Transformer area user-transformer relation abnormity diagnosis method and device

Examples


Example Embodiment

[0040] The present invention will be further described below in conjunction with the accompanying drawings and specific preferred embodiments, but the protection scope of the present invention is not limited thereby.

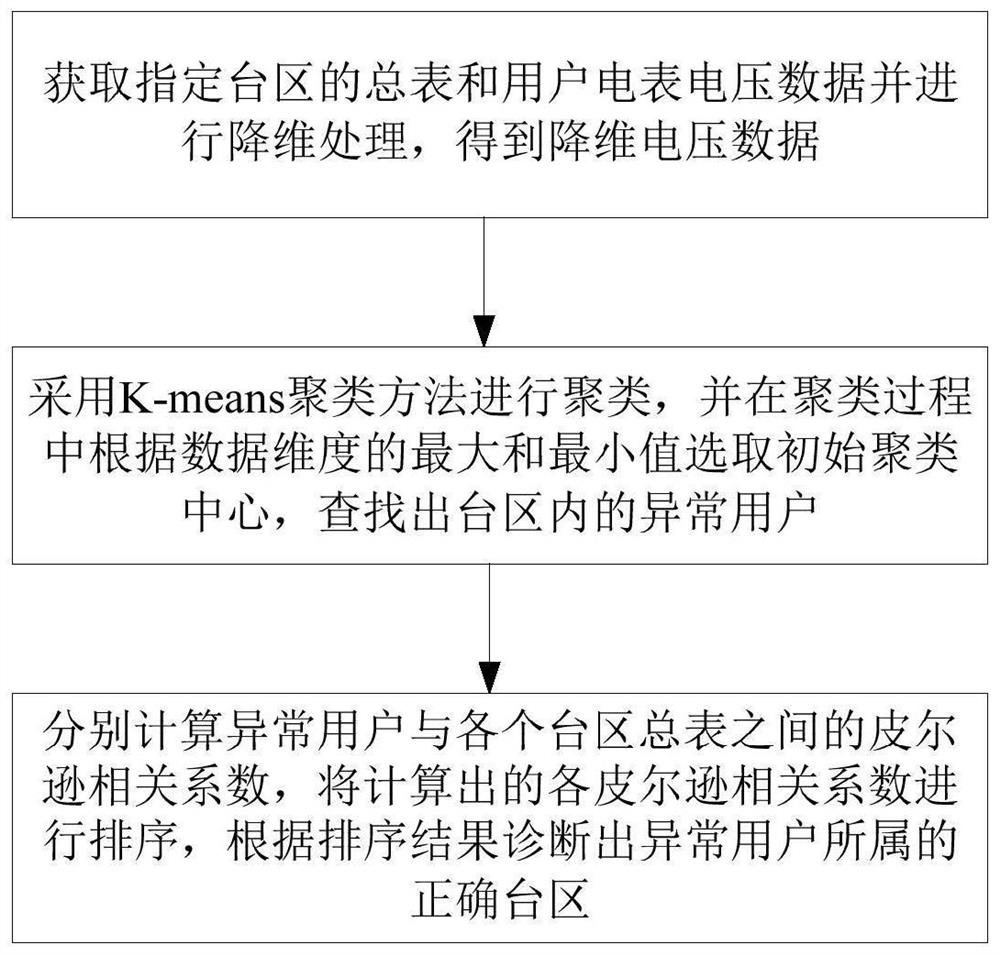
[0041] like figure 1 As shown, the steps of the method for diagnosing the abnormal relationship between households in the station area of ​​the present embodiment include:

[0042] S01. Dimension reduction processing: Obtain the voltage data of the general meter and the user's electric meter in the specified station area and perform dimension reduction processing to obtain the dimension reduction voltage data;

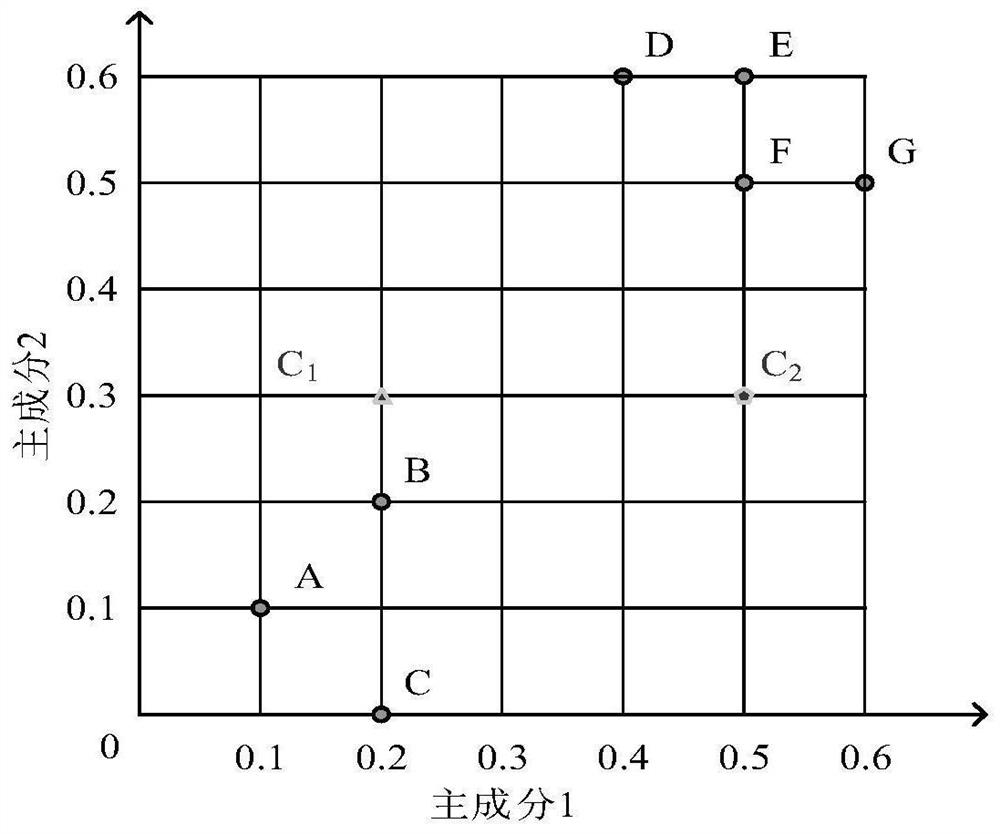
[0043] S02. Clustering processing: use the K-means clustering method to cluster the dimension-reduced voltage data, and select the initial clustering center according to the maximum and minimum values ​​of the data dimension during the clustering process, and find out the household substations in the specified station area Abnormal users with abnormal r...


PUM


Abstract

The invention discloses a transformer area user-transformer relation abnormity diagnosis method and device, and the method comprises the steps: S01, obtaining a total meter and user ammeter voltage data of a specified transformer area, and carrying out the dimension reduction processing, and obtaining dimension-reduced voltage data; S02, clustering the dimension-reduced voltage data by adopting a Kmeans clustering method, selecting an initial clustering center according to the maximum value and the minimum value of the data dimension in the clustering process, and finding out abnormal users with abnormal user-transformer relationships in a specified transformer area; S03, respectively calculating Pearson correlation coefficients between the abnormal user and each transformer area general table, sorting the calculated Pearson correlation coefficients, and diagnosing a correct transformer area to which the abnormal user belongs according to a sorting result. The method can realize diagnosis of one or more abnormal users in the same transformer area and multiple abnormal users in different transformer areas, and has the advantages of simple realization method, high diagnosis efficiency and precision and the like.

Description

technical field [0001] The invention relates to the technical field of electricity consumption information collection systems, and in particular to a method and device for diagnosing abnormalities in household-to-substation relations in a station area. Background technique [0002] With the rapid development of power grid construction, the power consumption information collection system containing massive data can not only directly reflect the operation status of the distribution network, but also indirectly reflect the topological relationship of the distribution network. The existing distribution network topology verification mainly includes: line-to-substation relationship verification, feeder topology verification, household-to-substation relationship and phase verification, and line-to-household relationship verification. The correct low-voltage distribution network topology, especially the correct relationship between households and transformers is the basis for the cu...

Claims


Application Information

Patent Timeline
IPC IPC(8): G06K9/62G06F30/27G01R35/04G06F111/08G06F113/04
CPCG06F30/27G01R35/04G06F2113/04G06F2111/08G06F18/2135G06F18/23213G06F18/24Y04S10/50
Inventor 黄瑞任浪罗旻昱卿曦周纲刘谋海杨茂涛余敏琪叶浏青肖湘奇曾文伟
Owner STATE GRID HUNAN ELECTRIC POWER
Why Eureka
Try Eureka