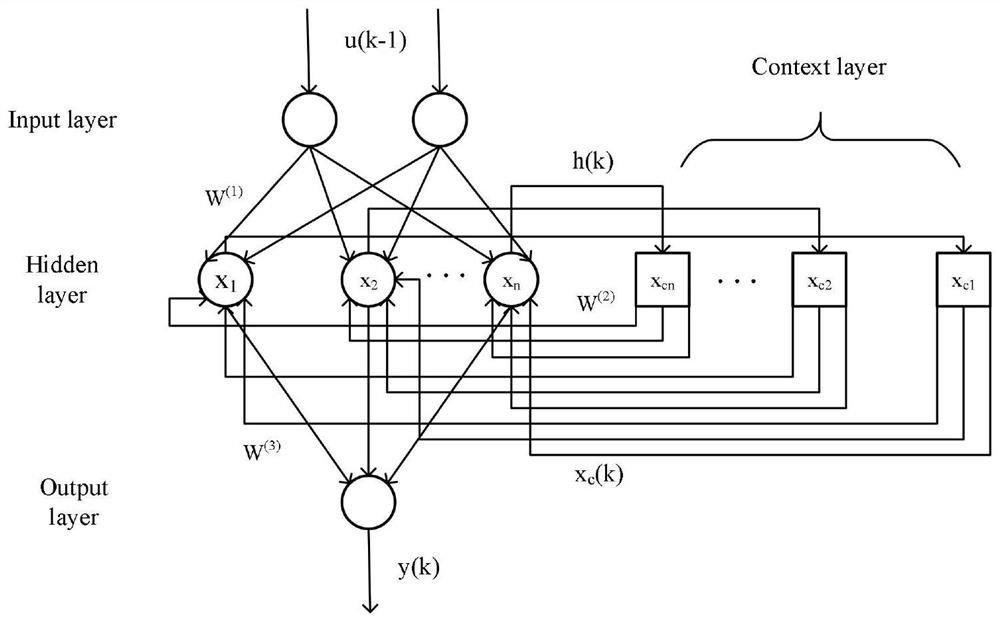
[0046]DETAILED DESCRIPTION OF THE PREFERRED EMBODIMENTS The following examples are intended to illustrate the invention, but are not intended to limit the scope of the invention.
[0047]Short-time traffic flow forecasting system based on Sarima-Ga-Elman combination model, including the following steps:
[0048]1) Modeling of SARIMA model;
[0049]The modeling of the SARIMA model in the step 1) includes the following steps:
[0050]1 Judging whether the time series is stable according to the mean, variance, and self-correlation coefficient diagram of time series data.
[0051]2 Differential differences on non-smooth time series;
[0052]3 By observation, draw a self-correlation coefficient diagram, partial relational coefficient diagram, heat diagram, etc. to determine P, D, Q, P, D, Q, S;
[0053]4 Determined SARIMA model determined in the previous step;
[0054]5 Test if the residual sequence of the SARIMA model is white noise;
[0055]6 Predict the traffic flow using the SARIMA model that is tested.
[0056]2) Use Elman-RNN to predict, measure the average absolute error and the root mean square error;
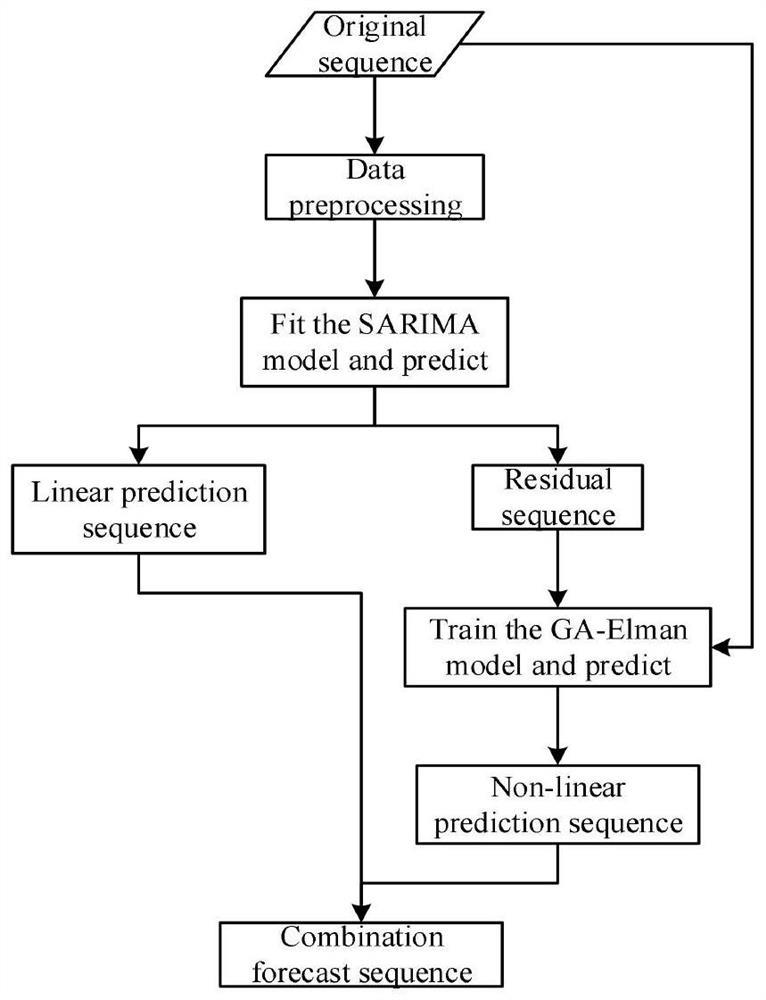
[0057]3) SARIMA-GA-Elman combination forecast:
[0058]1 Based on Sarima linear model to YtPrediction, predictive sequence The error in the original sequence and the predictive sequence is Et,which is:
[0059]
[0060]2 use error sequence {et} Fitting the GA-Elman model, that is, using the Ga-Elman model to approximate the nonlinear function f (t), and use the original time series YtBy predicting, set the forecast results for Where f (t) represents a function of nonlinear components of the original time series, εtRepresents a random error.
[0061]3 Prediction values of steps 1 and 2 will be weighted, and the expression is as follows:
[0062]
[0063]among them, Indicates the final predicted value of the combined model, α, and β indicate the weight coefficient.
[0064]4) Linear prediction;
[0065]1 rolling prediction
[0066]During the predicted period of time sequence, the SARIMA model does not only need to fit a large number of historical data, resulting in long modeling cycles, and predictive effects. Considering the state in which traffic data is real-time updated, the present invention is modeled using rolling predictions using rolling prediction. It not only solves the problem of poor forecasting effect, but also continuously fit the latest traffic data to achieve real-time prediction. The algorithm for scrolling prediction of Sarima model is as follows:
[0067]
[0068]
[0069]2 step judgment
[0070]During fitting the Sarima model, you need to pass a series of parameters. The selection of the parameters is related to whether the model can fit the traffic stream, by observing the historical time series of traffic flow, ACF (autocorrelation function), PACF (partial related function) diagram, can determine if the time series is smooth and determined the order of the model. ACF and PACF before and after traffic flowFigure 4 Indicated. underimage 3 It is a historical time series, a first-order difference sequence, ACF and PACF diagram. From the figure, it can be concluded that the historical time series is not smooth, and the differential is required to obtain a smooth sequence. After first-order differentiation, the ACF is in the first step, and the PACF is truncated after three-order, so the step P is set to 3, Q is set to 1. Considering that the optimal parameters are provided for the model, different parameter combinations are evaluated by AIC (Akaike Information criterion) or BIC (Bayesian Information criterion), and finally the optimal parameter combination is filtered. AIC evaluation parameter combinationFigure 5 Shown
[0071]5) Nonlinear prediction.
[0072]1 Error training matrix based on multi-step prediction
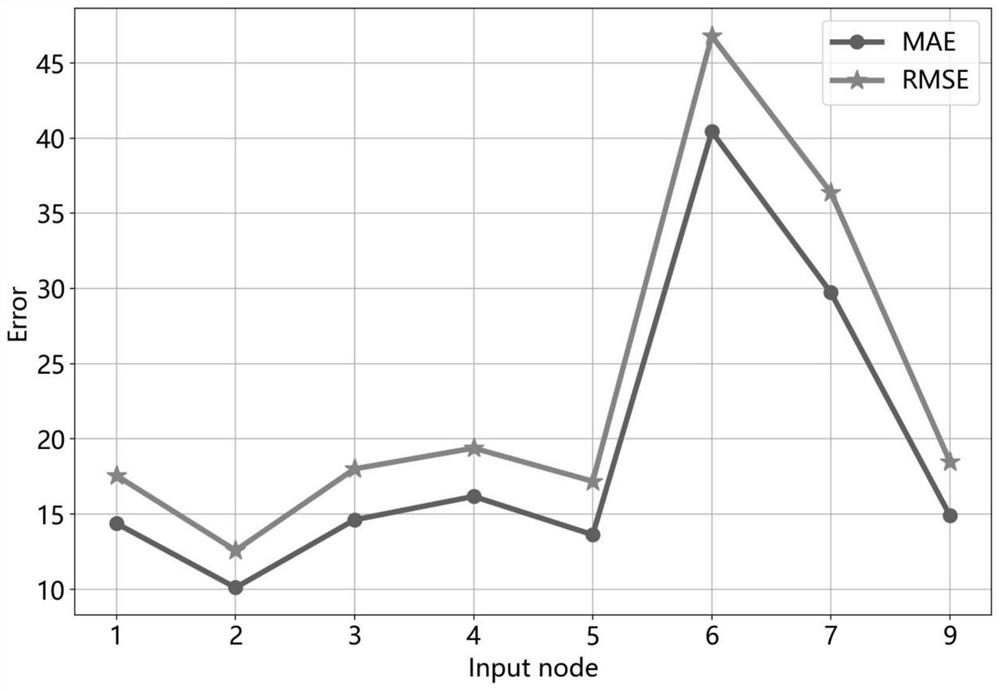
[0073]The predictive results of the Sariam model can eliminate the trend and periodicity of the traffic flow, so a large number of nonlinear features are hidden in the predictive error. Therefore, the GA-ELMAN model in the present invention uses the prediction error of the SARIMA model as the training set to construct traffic flow nonlinear characteristic model. The error matrix E of the training set is equal to the difference between the predictive matrix ω and the real value obtained by Section 4.1.1, as shown in Equation 8. In order to obtain a traffic flow in the future, the multi-step predicted method reconstruction error matrix is used, and the error matrix is divided into input matrices and target matrices, as shown in Equation 11. The test set is the same as the original time series, the division mode, and the training set, as shown in Equation 12.
[0074]
[0075]
[0076]
[0077]In Equation 11, ω represents the prediction matrix of the SARIMA model, and E is the error matrix, S, W, NUM already described in Section 4.1.1. In the formula 12, I, O represent the input matrix and target matrix of the error training set, i represents the length of a training sample,figure 2 The optimal solution has been obtained, T represents the number of training samples. In the formula 13, M, N represent the input matrix and target matrix of the test set, respectively, XtIndicates the traffic flow at T.
[0078]2 Constructing the GA-ELMAN model is to capture the nonlinear characteristics of traffic flow, and improve the training efficiency of the model. The model training set is based on the prediction error of the linear model, not the fitting error, which is because the prediction error contains more nonlinear features, which guarantees that the model we train has higher intensive ability. The algorithm process is as follows:
[0079]
[0080]
[0081]In Equation 6 of the above algorithm, n represents the amount of weight and thresholds to be optimized, i represents the number of input layer nodes, H represents the number of hidden layers nodes, o represents the number of output layer nodes. In the formula 7, P represents the number of population; YiRepresents the actual output value; PiIndicates the predicted output value. Equation 8, fjIs an adaptivity value, PiIt is the probability of individuals selected.
[0082]Modeling flow chart of GA-Elman modelFigure 6 Down:
[0083]FromFigure 6 It can be obtained, during the mode of modeling ELMAN-RNN, the present invention uses GA optimization ELMAN-RNN to replace the gradient drop method in the common use of optimization algorithms. However, in the initial phase, the weight and threshold value of Elman-RNN is optimized, and the range of weight and threshold is laminated in advance, and then the weight and threshold to call the gradient decrease in the final weight based on GA optimization. And thresholds. This optimization process greatly enhances the efficiency of training. The convergence curve of the loss function of the Elman-RNN model and the Elman-RNN model after the optimization of GA is contrast.Figure 7 Indicated;
[0084]FromFigure 7 It can be seen that the loss function of the GA-optimized ELMAN-RNN model can converge faster, meaning that the GA-Elman model has higher predictive efficiency. Under the same conditions, based on 5 minutes, 10 minutes, 15 minutes of data sets, the training time of the Elman-RNN model and the Elman-RNN model using GA-optimized ELMAN-RNN model, as shown in the table below:
[0085]Table 1 model run time comparison
[0086]
[0087]From Table 1, GA optimized ELMAN-RNN has greatly improved in training efficiency, suitable for real-time prediction of traffic flow. This optimization method is similar to the principle of migration learning, is based on secondary training on the model parameters that have been trained. This method can greatly improve the training efficiency of the model, which is more in the transportation field of high denier. Advantage.
[0088]The measured data used in the US Gemini City I-94 section was used as a data source that predicted the shortcoming traffic flow prediction of the present invention. The original data sampling time interval is 30 seconds, and we first re-sample the data, the sampling interval is set to 5 minutes, 10 minutes, 15 minutes. Since the data sets used in the present invention are relatively complete, only the data set is simple pre-preach, not described in detail. The present invention will use traffic data from June 1 to June 8 as a research sample, and the training set is June 1 to June 7 data, and the test set is June 8 data. The specific division of the data set is as follows:
[0089]The SARIMA model is carried out in the way of scrolling forecasting, and the training sets 80%. The test set is 20%. The training set is June 1 to June 4th, June 2nd to June 5th, June 3 ~ June 6th, June 4th to June 7; Test Sets are June 5th, June 6, June 7, June 8.
[0090]The training set of the GA-Elman model is 75%. The test group accounts for 25% of the test group, using the previous June 5th, June 6, June 6, June 6th, June 6, and the test group is 25%, using the data set on June 8.
[0091]The parameters involved in the present invention include three parts, respectively, SARIMA model parameters, GA parameters, and ELMAN-RNN model parameters. As shown in Table 2, Table 3 and Table 4:
[0092]Table 2 SARIMA model parameter selection
[0093]
[0094]Table 3 GA parameter selection
[0095]
[0096]Table 4 Elman Neural Network Parameter Selection
[0097]
[0098]The activation function of the Elman-RNN hidden layer uses a titanably S-type transfer function: Tansig, the output layer uses a linear transfer function: Purelin, using an adaptive LR momentum gradient decrease algorithm: TraingDX. When using GA to optimize the weight and threshold of the neural network, you need to quote the number of weights and thresholds, and then determine the number of binary bits of the chromosome. Table 2 141 = 2 * 10 + 10 * 10 + 10 + 10 * 1 + 1 is the number of weights and thresholds of the Elman neural network to be optimized. Because 27<141<28, so determine whether the number of binary positions of the chromosome is 8.
[0099]In order to evaluate and compare the experimental results, the present invention selects the following performance evaluation index:
[0100]Some root error:
[0101]Average absolute error:
[0102]Average absolute percentage
[0103]Comparison error:
[0104]decisive factor:
[0105]"In Yt(i), yp(i), The real value, predicted value, and real value of the time series are respectively indicated. Equal root error, the average absolute error, the smaller the average absolute percentage error indicates the higher the accuracy of the model, the higher the accuracy of the decision coefficient.
[0106]In order to verify the robustness and effectiveness of the combined model, the present invention is predicted for 5 minutes, 10 minutes, and 15 minutes, respectively, and the model SARIMA [41], Elman [42], Ga-Elman, Sarima -Elman compares, predicting indicators indicate that the combined model has a large accuracy. The Elman optimized by GA has more efficient operational efficiency.Figure 7 And Table 5 is comparison and model training time comparison between the loss function before and after GA optimization. To improveFigure 8 ,Figure 10 ,Figure 12 The visualization effect of the index R2 is evaluated, and each R2 is multiplied by 10 and then displayed in the figure.Figure 9 ,Figure 11 ,Figure 13The prediction results of the combined model of 5 minutes, 10 minutes, and 15 minutes, respectively.
[0107]Table 5 Model Accuracy Indicators (5 minutes)
[0108]
[0109]As in Table 5 above,Figure 8 Show, through the comparative model between Mae, we found that the Sarima-Ga-Elman model increased by 63.92% higher than the SARIMA model, which was 29.71% higher than the Elman model, 18.72% higher than the GA-Elman model, than Sarima-Elman. The model has increased by 11.12%. The combined model is much higher than the SARIMA model accuracy, because the cycle parameter of the SARIMA model selects half of the actual cycle, resulting in excessive error, but does not affect the prediction effect of the combination model, which can reflect the generalization of the combination model. ability.
[0110]Table 6 Model Accuracy Index (10 minutes)
[0111]
[0112]As mentioned above,Figure 10 The Sarima-Ga-Elman model has increased by 15.99% compared with the SARIMA model, which is 30.20% from the Elman model, which is 25.61% higher than the GA-Elman model, which is 1.7% higher than the Sarima-Elman model.
[0113]Table 7 Model Accuracy Index (15 minutes)
[0114]
[0115]
[0116]As mentioned above,Figure 12 As shown, the Sarima-Ga-Elman model has increased by 20.10% compared with the SARIMA model, which is 19.07% compared to the Elman model, which is 10.00% higher than the GA-Elman model, which is 4.8% higher than the Sarima-Elman model.
[0117]Comprehensive results are known that the SARIMA-GA-ELMAN model based on four evaluation indicators is in a single model, and the accuracy of the model has different degrees in different levels of data. The value of the MAE, RMSE, and R2 of the combination model remains a good trend even at different time intervals, and the value of MAPE has fluctuated, but also presents the advantage of a combined model as a whole.
[0118]In the description of the present invention, it is to be explained that the orientation or positional relationship between the term "upper", "lower", "left", "left", "inside", "outside", etc. is based on the drawing. The orientation or positional relationship is intended to facilitate the description of the present invention and simplified description, rather than indicating or implying that the referred to means must have a particular orientation, and therefore, it is not understood to be limited to the present invention. It will be noted in that it is intended to be the preferred embodiment of the present invention as described above, and is not intended to limit the invention, although the foregoing examples have been described in detail, and those skilled in the art will still The technical solution described in the foregoing embodiments may be modified, or some technical features are equivalent to the equivalent replacement, and any modification, equivalent replacement, improvement, etc. according to the spirit and principles of the present invention should be included. The invention is within the scope of the invention.