
Data table relation visualization method, system and equipment and readable storage medium

A data table and relational technology, applied in the field of data processing, can solve problems such as disordered, redundant and difficult to meet the needs of business scenarios, and achieve the effects of ensuring logical correctness, optimizing layout positions, and satisfying visualization effects

Pending Publication Date: 2021-06-04
SHANGHAI DATATOM INFORMATION TECH CO LTD
View PDF9 Cites 2 Cited by
  • Summary
  • Abstract
  • Description
  • Claims
  • Application Information

AI Technical Summary

Problems solved by technology

There are many existing methods for visual analysis of data relational graphs. The most commonly used one is the common relational graph based on third-party libraries. This relational graph layout algorithm calculates the location information of nodes and the edges connecting nodes based on the data passed by users. The layout diagram generated by it only solves the problem of data visualization, and does not visually show the logical order of dependencies between data tables
Moreover, when faced with the analysis of massive data, this kind of relationship diagram will appear disorderly and redundant, and it is difficult to meet the needs of relevant business scenarios

Method used


Image

  • Data table relation visualization method, system and equipment and readable storage medium
  • Data table relation visualization method, system and equipment and readable storage medium
  • Data table relation visualization method, system and equipment and readable storage medium

Examples


Embodiment 2

[0069] A data table relationship visualization system, which includes: a conversion module 1, a path module 2, a coordinate module 3 and a chart module 4; the conversion module 1 is used to convert metadata into original data with a standard paradigm;

[0070] The path module is used to calculate the longest path from each node to the central node in the original data;

[0071] The coordinate module is used to obtain the two-dimensional coordinates of each node according to the longest path from each node to the central node;

[0072] The chart module is used to form a data table relationship effect diagram according to the two-dimensional coordinates of each node.

Embodiment 3

[0074] An electronic device, which can be but not limited to personal computer, tablet computer and other devices.

[0075] The electronic device 100 includes: a processor 110 and a memory 120 .

[0076] It should be noted that the components and structure of the electronic device 100 shown in the figure are only exemplary rather than limiting, and the electronic device 100 may also have other components and structures as required. The processor 110, the memory 120 and other components that may appear in the electronic device 100 are electrically connected to each other directly or indirectly to realize data transmission or interaction. For example, the processor 110 and the memory 120 can be electrically connected through one or more communication buses or signal lines.

[0077] The memory 120 is used to store the program corresponding to the above-mentioned semantic analysis method or the above-mentioned semantic analysis system. Optionally, when the semantic parsing syste...


PUM


Abstract

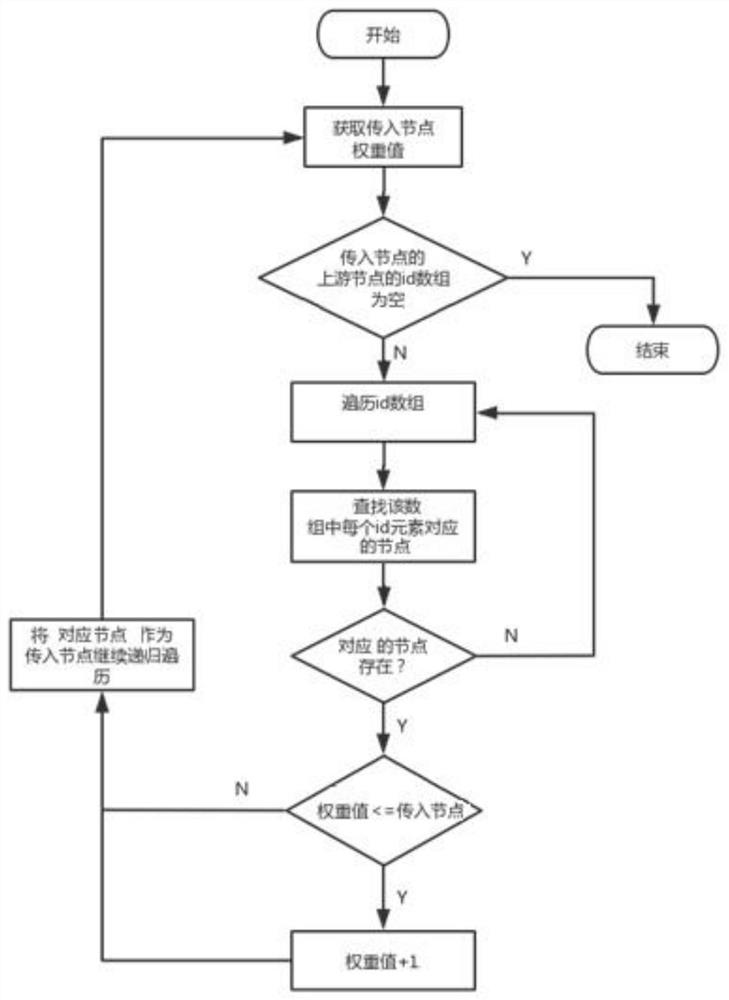
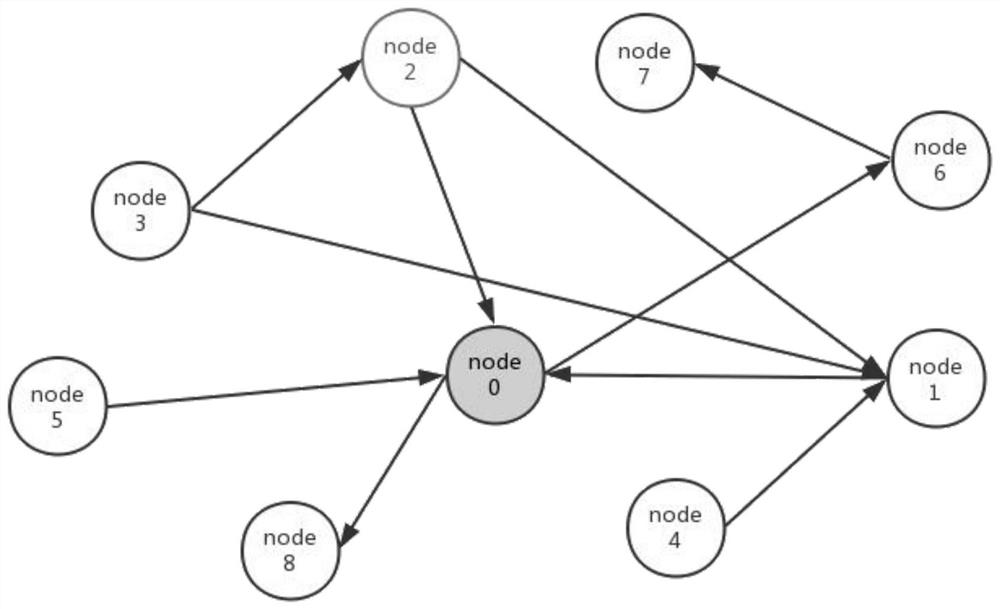
The invention discloses a data table relation visualization method, system and device and a readable storage medium. The method comprises the following steps that 1, metadata is converted into original data with a standard normal form; 2, the longest path from each node to the center node in the original data obtained in the step 1 is obtained; step 3, obtaining two-dimensional coordinates of each node according to the longest path obtained in the step 2; and 4, forming a data table relation effect graph according to the two-dimensional coordinates of each node obtained in the step 3. According to the method, the visualization effect of the deep blood relationship among the data nodes can be realized, so that the service requirements during processing of mass data are met.

Description

technical field [0001] The present application belongs to the technical field of data processing, and in particular relates to a data table relationship visualization method, system, device and readable storage medium. Background technique [0002] In the field of front-end visualization, it is often necessary to perform data processing on data tables with associated relationships, and finally obtain a visual relationship layout diagram. There are many existing methods for visual analysis of data relationship graphs. The most commonly used is the common relationship graph based on third-party libraries. This relationship graph layout algorithm calculates the position information of nodes and the edges connecting nodes based on the data passed by users. The generated layout diagram only solves the problem of data visualization, and does not visually show the logical sequence of dependencies between data tables. Moreover, when faced with the analysis of massive data, this kin...

Claims


Application Information

Patent Timeline
Patent Type & Authority Applications(China)
IPC IPC(8): G06F16/26G06F16/22
CPCG06F16/26G06F16/2282Y02D10/00
Inventor 魏范光谢赟吴新野陈大伟
Owner SHANGHAI DATATOM INFORMATION TECH CO LTD
Learn More