Configurable one-stop large screen visualization method and device

A one-stop, parameter configuration technology, applied in the directions of visual data mining, structured data retrieval, structured data browsing, etc. Issues such as less support for dynamic data

Pending Publication Date: 2021-09-07
武汉一格空间科技有限公司
View PDF4 Cites 0 Cited by
  • Summary
  • Abstract
  • Description
  • Claims
  • Application Information

AI Technical Summary

Problems solved by technology

After a certain period of time, the customization of the large-screen visualization solution is fixed. It is not friendly to users with zero foundation in programming, chart production, and data visualization design. These ordinary users cannot make diversified large-screen visualization solutions based on actual conditions.
[0007] (2) The style of the chart component is not rich enough
The mainstream large-screen visualization components include line charts, histograms, scatter charts, pie charts, radar charts, statistical thematic maps, etc., but lack new chart styles such as heat maps, relationship maps, and funnel maps. In addition, real-time dynamic data There is also less support, making it difficult to meet the growing needs for diverse and personalized chart visualization
[0008] (3) It is impossible to realize one-stop on-demand processing of data sources
Existing large-screen visualization systems are all direct visualization of the data they manage. For data that needs to be merged, extracted, converted, etc. to enhance the data display effect, the data can only be processed and prepared in advance and imported as needed. system, unable to realize one-stop online on-demand processing of data sources
[0009] (4) There is a general lack of geographic data visualization configuration functions
However, the current large-screen visualization systems are programmed by professionals or customized using commercial visualization software. They lack support for massive multi-source heterogeneous data, lack one-stop online processing of data sources to enhance data availability, and lack rich A single large-screen solution cannot achieve targeted display on the large screen

Method used


Image

  • Configurable one-stop large screen visualization method and device
  • Configurable one-stop large screen visualization method and device
  • Configurable one-stop large screen visualization method and device

Examples


Embodiment Construction

[0046] In order to make the technical means, creative features, goals and effects achieved by the present invention easy to understand, the present invention will be further described below in conjunction with specific embodiments.

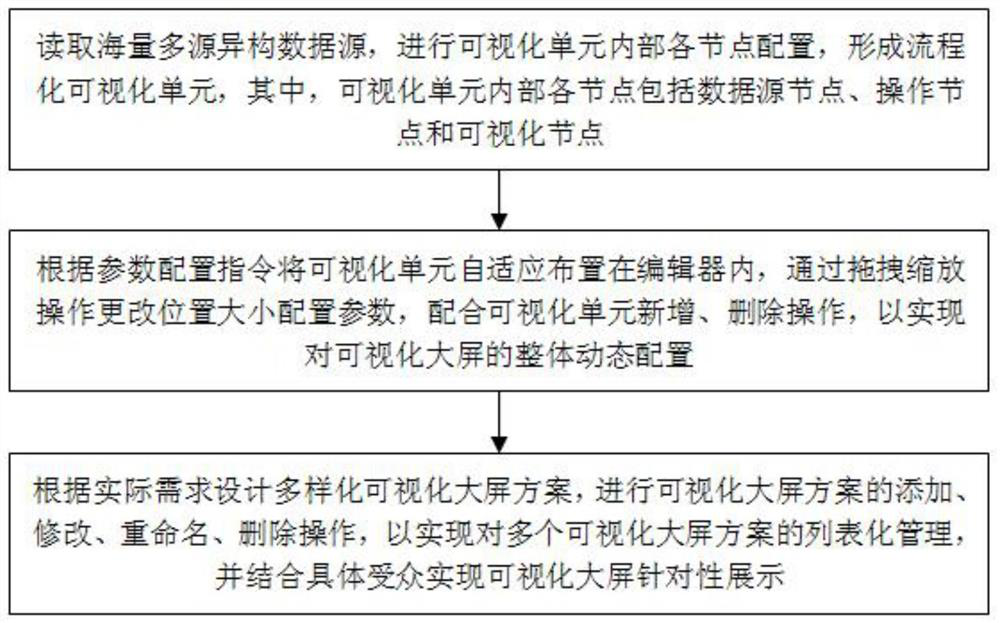
[0047] refer to Figure 1-5 , the specific implementation method adopts the following technical solutions: a configurable one-stop large-screen visualization method, the steps of which are:

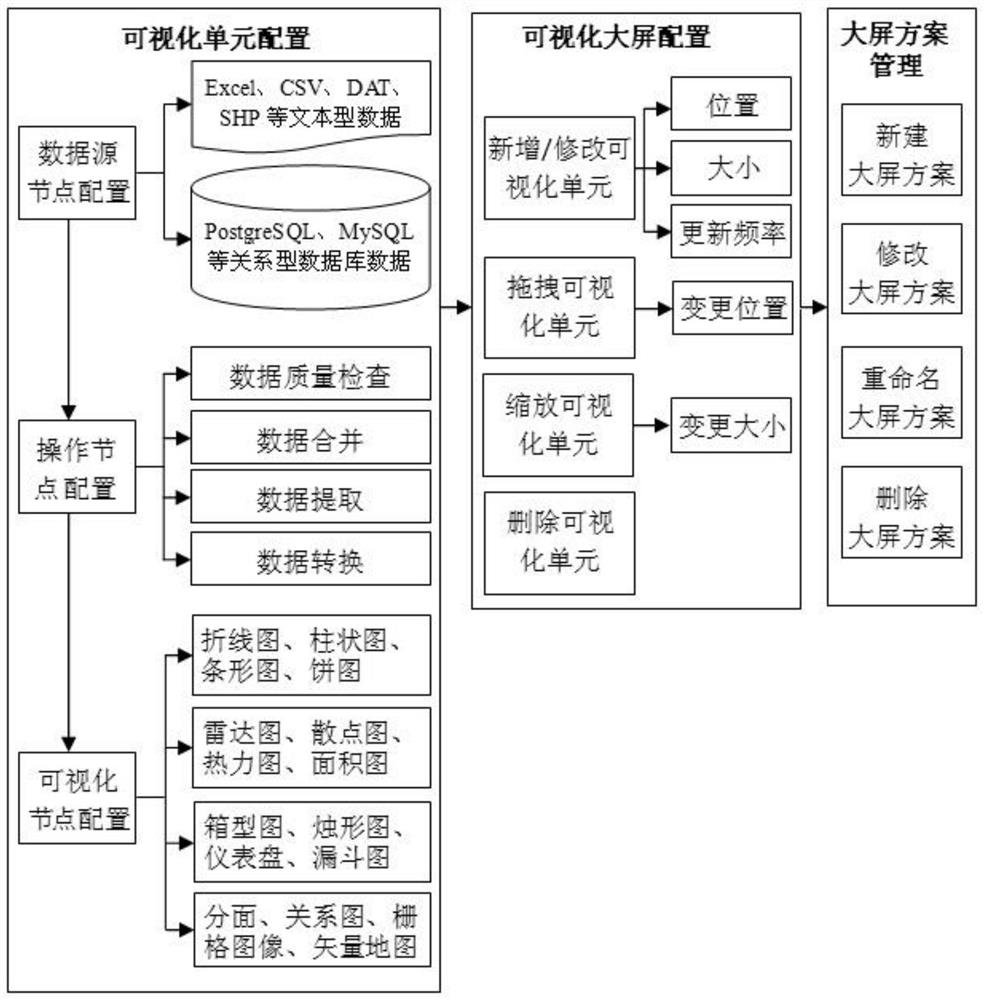
[0048] (1) Read massive multi-source heterogeneous data sources, configure each node inside the visualization unit, and form a process visualization unit, wherein each node inside the visualization unit includes a data source node, an operation node and a visualization node;

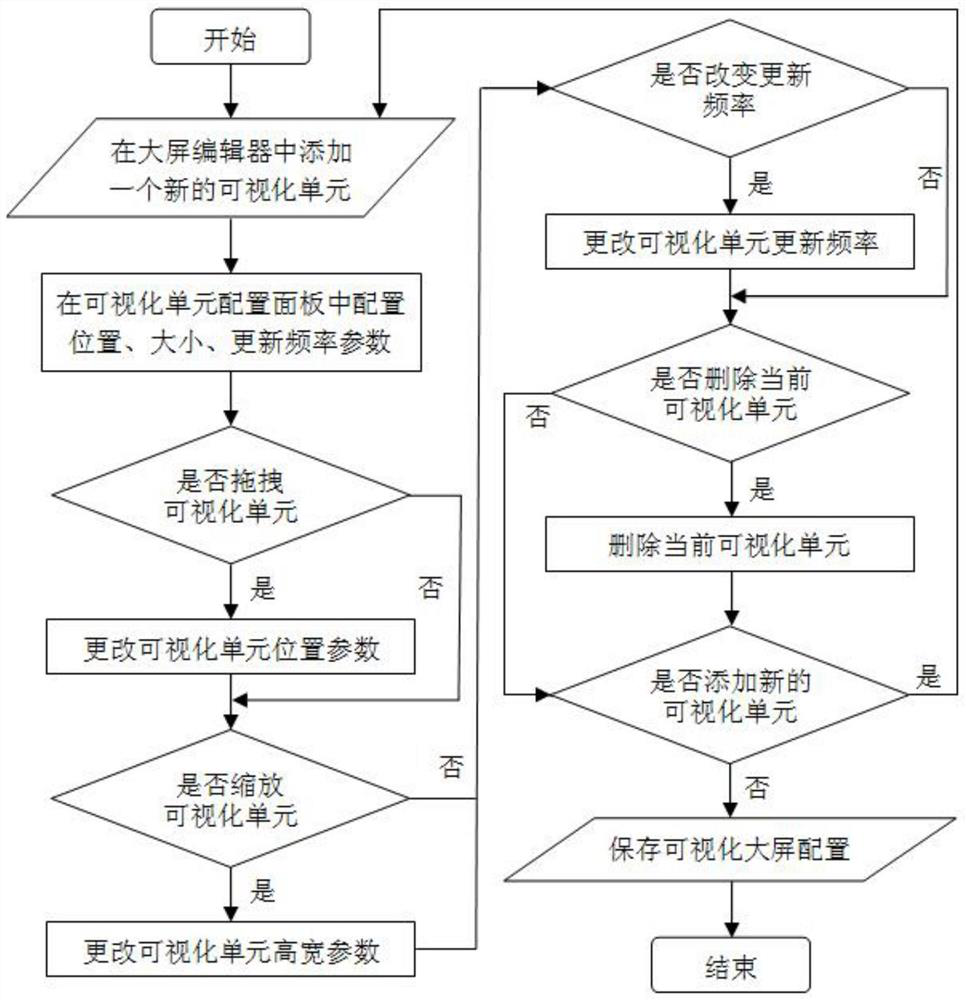
[0049] (2) Adaptively arrange the visualization unit in the editor according to the parameter configuration instruction, change the position and size configuration parameters by dragging and zooming operations, and cooperate with the addition and deletion operations of the visualization...


PUM


Abstract

The invention discloses a configurable one-stop large screen visualization method and device, and relates to the technical field of big data visualization. The method comprises the following steps of: reading massive multi-source heterogeneous data sources, and configuring each node in a visualization unit to form a process visualization unit; according to the parameter configuration instruction, the visualization unit is arranged in an editor in a self-adaptive mode, position size configuration parameters are changed through dragging and zooming operation, and dynamic configuration of a visualization large screen is achieved in cooperation with addition and deletion operation of the visualization unit. According to the method, diversified visual large-screen schemes are designed according to actual requirements, the visual large-screen schemes are added, modified, renamed and deleted, listing management of the multiple visual large-screen schemes is achieved, and visual large-screen targeted display is achieved in combination with specific audiences. According to the method, one-stop service of mass multi-source heterogeneous data from storage, processing and analysis to large-screen visualization is realized, the applicability is wide, the method has rich visual chart styles, and the application prospect is wide.

Description

technical field [0001] The present invention relates to the technical field of big data visualization, in particular to a configurable one-stop large-screen visualization method and device. Background technique [0002] With the development of information technology and data industry, data resources have increasingly become an important factor of production in human society and a basic national strategic resource. Data visualization is to use a series of display methods that are easier for people to understand relatively complex and abstract data to express the inherent information and laws of the data in a visual way, grasp the future development trend, and promote the dissemination and application of data information. Data visualization technology has played an indispensable role in the era of big data. The traditional carriers of data visualization include computers, mobile phones, and tablets. With the support of current software and hardware technical conditions, the ...

Claims


Application Information

Patent Timeline
Patent Type & Authority Applications(China)
IPC IPC(8): G06F16/25G06F16/26G06F3/0484
CPCG06F16/256G06F16/258G06F16/26G06F3/04845
Inventor 魏守峰包亮余慧明
Owner 武汉一格空间科技有限公司
Why Eureka
Try Eureka