Atmospheric pollution potential source region identification method based on pollution process typing

A classification method and source area technology, applied in resources, instruments, electrical digital data processing, etc., can solve problems such as data confusion, poor sensitivity, and inability to calculate trajectories, so as to improve accuracy, simplify data processing, and reduce interference. Effect

Pending Publication Date: 2021-11-23
WUHAN UNIV OF TECH
View PDF0 Cites 1 Cited by
  • Summary
  • Abstract
  • Description
  • Claims
  • Application Information

AI Technical Summary

Problems solved by technology

However, the above method does not carry out the classification of the pollution process on the original data, so it is easy to confuse the data of the pollution period and the non-pollution period, thus affecting the accuracy of the recognition results
At the same time, the trajectory statistics methods used also have their own advantages and disadvantages. For example, the PSCF (potential source contribution function) method can reflect the pollution contribution rate of different grids, but because it needs to preset the pollution threshold, it cannot calculate all trajectories; the CWT (concentration weighted field) method All trajectories can be quantitatively calculated, but the sensitivity is poor when identifying long-distance potential source areas; the RTWC (residence time weighted concentration) method improves the pertinence of identification through iterative calculations, but the error is slightly larger; the QTBA (quantitative transport bias analysis) method Trajectory uncertainty can be assessed, but often spurious sources
The above methods still lack an integration method, and often fail to meet the accuracy requirements for identifying potential source regions

Method used


Image

  • Atmospheric pollution potential source region identification method based on pollution process typing
  • Atmospheric pollution potential source region identification method based on pollution process typing
  • Atmospheric pollution potential source region identification method based on pollution process typing

Examples


Embodiment

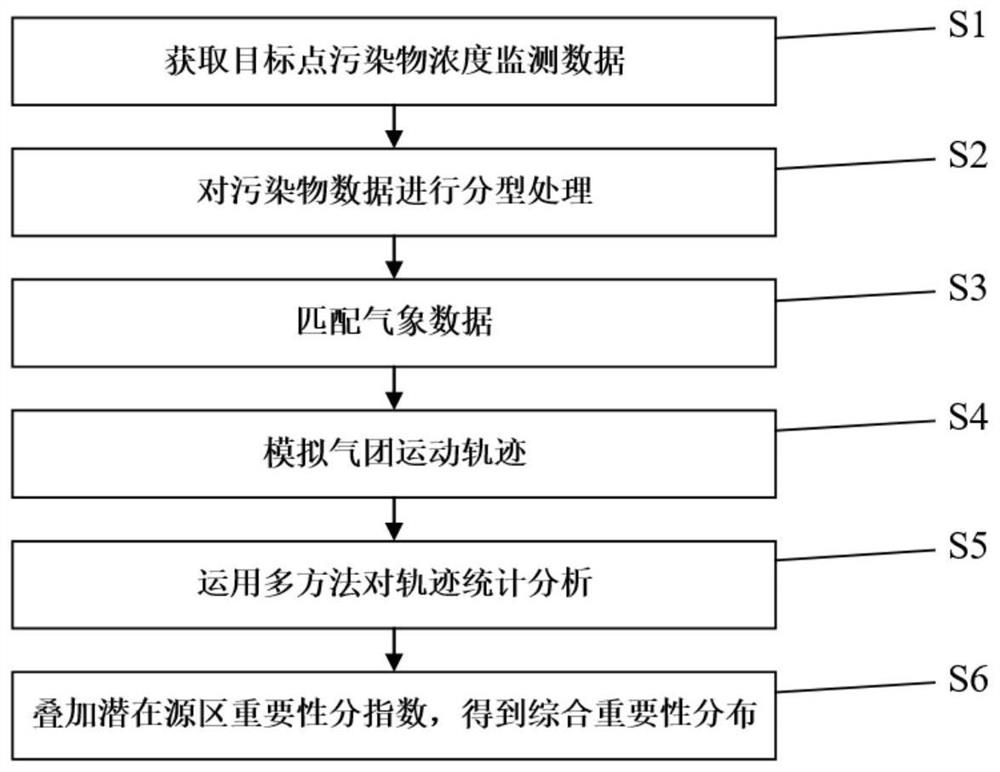
[0061] A method for identifying potential source areas of air pollution based on pollution process classification provided by the present invention, such as figure 1 Shown, the present invention comprises the following steps:

[0062] Step S1: Obtain the monitoring data of pollutant concentration at the target point.

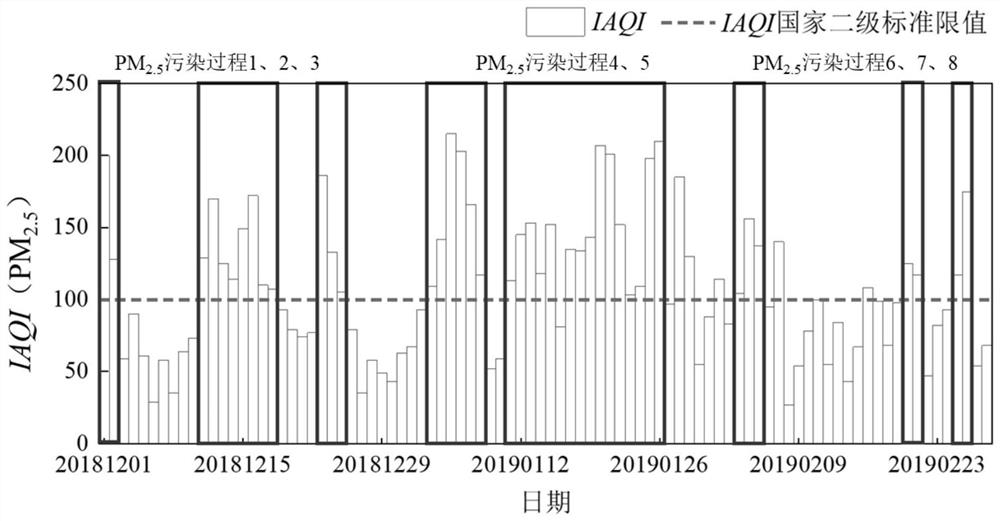
[0063] Specifically, taking Wuhan as an example, the pollutant concentration information in Wuhan from December 2018 to February 2019 was obtained through the ground ambient air quality monitoring station (30.56°N, 114.25°E), and arranged in chronological order.

[0064] The main monitoring indicators are: SO 2 , NO 2 , O 3 , CO, PM 10 and PM 2.5 There are 6 items in total.

[0065] The time accuracy of the concentration data is 1 hour, and the online monitoring system detects the average value hour by hour every day, and automatically generates the daily average value.

[0066] Step S2: Perform classification processing on the pollutant data.

[0067] S...


PUM


Abstract

The invention provides an atmospheric pollution potential source region identification method based on pollution process typing. The method comprises the following steps: (1) acquiring pollutant concentration historical monitoring data of a target point location; (2) performing typing processing on the data according to the pollution process; (3) acquiring meteorological data matched with the concentration data; (4) inputting the acquired meteorological data into an HYSPLIT model, and simulating through trajectory calculation to obtain a movement trajectory of an air mass passing through a target point location; (5) inputting pollutant concentration data into an HYSPLIT model, establishing a two-dimensional grid covering all trajectory simulation results, and respectively obtaining potential source region identification results by using various trajectory statistical methods; and (6) dividing various calculation results into N grades by using a statistical grading method, and assigning values to obtain the importance index Li, j, k and the comprehensive importance index Mi, j of the grid (i, j). The potential source region importance comprehensive evaluation method provided by the invention improves the accuracy of potential source region identification.

Description

technical field [0001] The invention relates to the technical field of environmental monitoring, in particular to a method for identifying potential source areas of air pollution based on pollution process classification. Background technique [0002] In recent years, the intensity of total air pollutant emissions in my country has increased, and the species are complex and changeable, manifested as PM 2.5 , O 3 and NO 2 The compound pollution problem represented by it is becoming more and more serious. Due to the spatial spillover effect of the pollutants themselves, atmospheric compound pollution is not only affected by the activity level of local emission sources, but also affected by the air mass transmission from the surrounding potential source areas. Therefore, accurate identification of potential source areas is of great significance for inter-regional joint prevention and control of atmospheric compound pollution. [0003] At present, the commonly used method to...

Claims


Application Information

Patent Timeline
Patent Type & Authority Applications(China)
IPC IPC(8): G06F30/20G06F16/2458G06Q10/06G06Q50/26G06F111/10G06F119/12
CPCG06F30/20G06F16/2474G06F16/2462G06Q10/06393G06Q50/26G06F2119/12G06F2111/10
Inventor 杨红刚曹阳王媛媛尹术文刘志翔
Owner WUHAN UNIV OF TECH
Why Eureka
Try Eureka