Method and system for adaptive interpretation of spectrometric data comobined with continual re-calibration

A recalibration and self-adaptive technology, applied in the field of spectral measurement, can solve problems such as taking a long time and achieve low-cost results

Inactive Publication Date: 2002-07-31
MEASUREMENT MICROSYST A Z
View PDF4 Cites 14 Cited by
  • Summary
  • Abstract
  • Description
  • Claims
  • Application Information

AI Technical Summary

Problems solved by technology

The main disadvantage of this setup is that it only measures the difference in one wavelength

Method used


Image

  • Method and system for adaptive interpretation of spectrometric data comobined with continual re-calibration
  • Method and system for adaptive interpretation of spectrometric data comobined with continual re-calibration
  • Method and system for adaptive interpretation of spectrometric data comobined with continual re-calibration

Examples


example 1

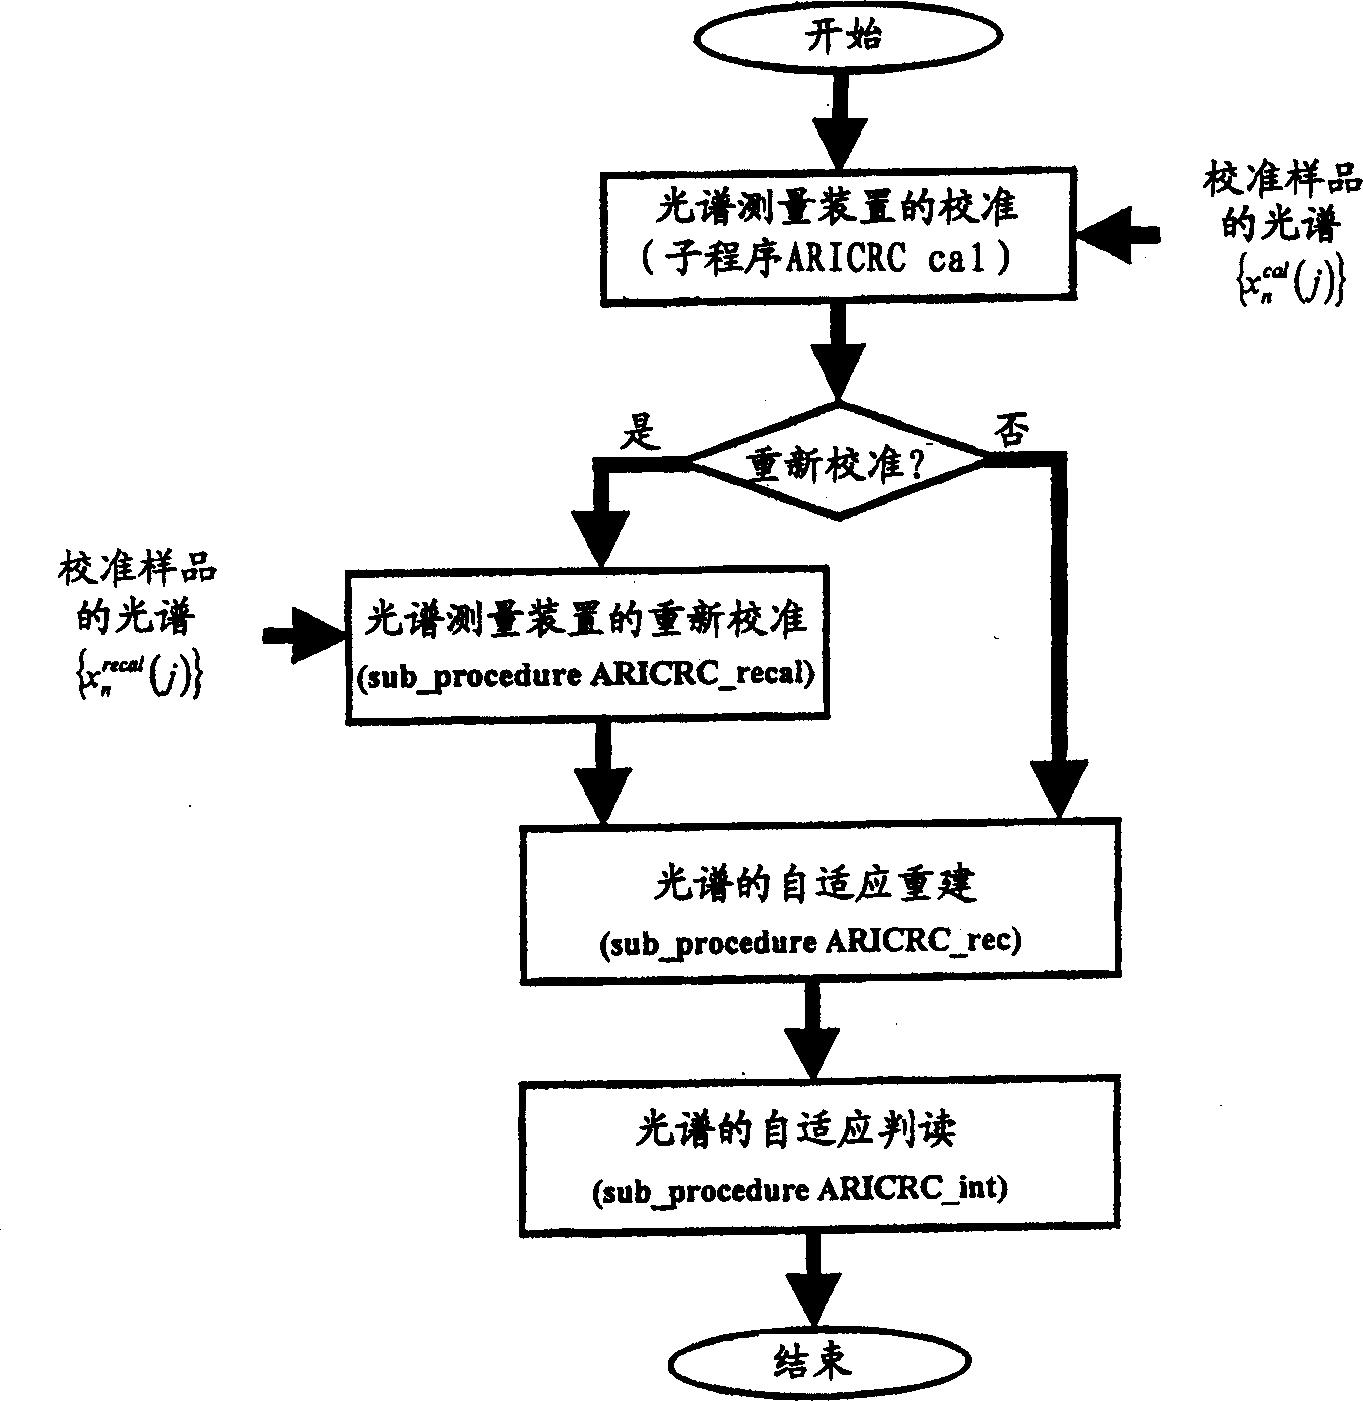
[0125] has been image 3 A specific version of the AI-RC program is designed for the measurement system shown, which includes: Model S1000 produced by Ocean Optics - an absorption micro-spectrophotometer; and a personal computer PC.

[0126] The following measurement parameters were chosen for calibration and for obtaining test data:

[0127] ●Wavelength range: λ min = 450nm, λ max =675nm,

[0128] ●The number of data obtained by the spectrophotometer: N=1024;

[0129] ●Wavelength discrete interval: Δλ=(λ min -λ max) / (N-1)=0.22nm.

[0130] The test data was obtained for a solution sample of holmium perchlorate; its actual spectrum x(λ) is shown in Figure 4a middle. The parameters of this spectrum are as follows:

[0131] The position vector of the spectral peak: I=[452.2 468.2 473.1 485 537.3 541.3 543.7 639.8644.2 652.2 656.4] T

[0132] The size vector of the spectrum peak: a=[1.17 0.19 0.2 0.461 0.988 0.41 0.297 0.8210.406 0.246 0.263] T It has been assumed tha...

example 2

[0155] An embodiment of an AI-RC program has been designed for a measurement system represented by an integrated MM microOSA (Optical Spectrum Analyzer-Spectrum Analyzer), such as Figure 8 shown. The analyzer shown is used to monitor Figure 9 The optical channel in the DWDM network is shown.

[0156] The following DWDM system parameters were selected to calibrate and obtain test data:

[0157] ●Number of optical channels: 81;

[0158] ●Wavelength range: λ min =1530.77nm, λ max =1562.68nm;

[0159] ●Channel spacing: Δλ=0.4nm (50GHz);

[0160] • A laser source with a known FWHM = 0.2nm, where FWHM denotes the full width at half maximum.

[0161] Some test data was obtained for a telecommunications bandwidth; its actual spectrum x(λ) is shown in Figure 10a middle. The parameters of this spectrum are as follows:

[0162] ●Peak position (carrier frequency) vector:

[0163] l k =1530.28+(k-1)Δλ+dl k (k=1,...,81),

[0164] where dl k It is the embodiment of some ide...


PUM


Abstract

A method for adaptive reconstruction and interpretation of spectra combined with re-calibration of a device providing spectrometric data, consist in carrying out an automatic calibration using the external reference light spectrum and its corresponding digital reference data stored in the internal memory of the device. The continual re-calibration procedure allows for automatic adaptation of the values of the coefficients in a reconstruction sub-procedure as well as the estimation of the values of the coefficients in an interpretation sub-procedure on the bases of a current shape of spectrometric data.

Description

field of invention [0001] The present invention generally relates to spectral measurement, and more particularly, to portable and field-applicable small spectral measurement systems. Background of the invention [0002] Spectroscopy is an analytical technique that involves the measurement and identification of the interaction of radiant energy with matter, and includes instruments designed for this purpose, so-called spectrometers, and the interpretation of the interaction both at a basic level and in practical analytical situations (interpretation) the corresponding device. The distribution of radiant energy absorbed or emitted by a sample of the substance under study is called the spectrum of that substance. The interpretation of the spectrum can provide basic information on the energy levels of atoms and molecules, that is, the distribution of various atoms and molecules within these energy levels, the nature of the related processes of changing one energy level to anoth...

Claims


Application Information

Patent Timeline
IPC IPC(8): G01J3/02G01J3/28G01N21/27
CPCG01J3/28G01N21/274G01J2003/2866
Inventor A·巴维茨M·P·维斯尼夫斯基R·Z·莫劳斯基M·本斯利马
Owner MEASUREMENT MICROSYST A Z
Why Eureka
Try Eureka