
Eureka
For R&D, Eureka makes reading and utilizing patents & technical documents easy.
Eureka AIR
Designed for self-driven R&D workflows. Generate viable solutions, solve complex R&D challenges, empower your innovation with AI.

Eureka Materials
Designed for material experts only. Revolutionize your material R&D, from search, analyze, to developing new materials.

TechResearch
Generate reliable direction feasibility study reports for your R&D in just a few steps.

TechSeek
Discover and master advanced knowledge NOW. Basics, ideas, possibilities, all at once.

TechMind
As an expert in R&D Theories, TechMind can generates customized viable solutions instantly.

TechRisk
Analyze your overall solution with one click, know your potential R&D risks in advance.

TechMonitor
Get weekly tech updates, stay abreast of the latest tech innovations and key insights.
Nucleic acid fragment detection system and its application in nucleic acid analysis and related enzyme study
A nucleic acid fragment and detection system technology, applied in the field of gene analysis and related enzyme analysis technology
- Summary
- Abstract
- Description
- Claims
- Application Information
AI Technical Summary
Problems solved by technology
Method used
Image

Examples
Embodiment 1
[0025] Embodiment one (nucleic acid analysis)
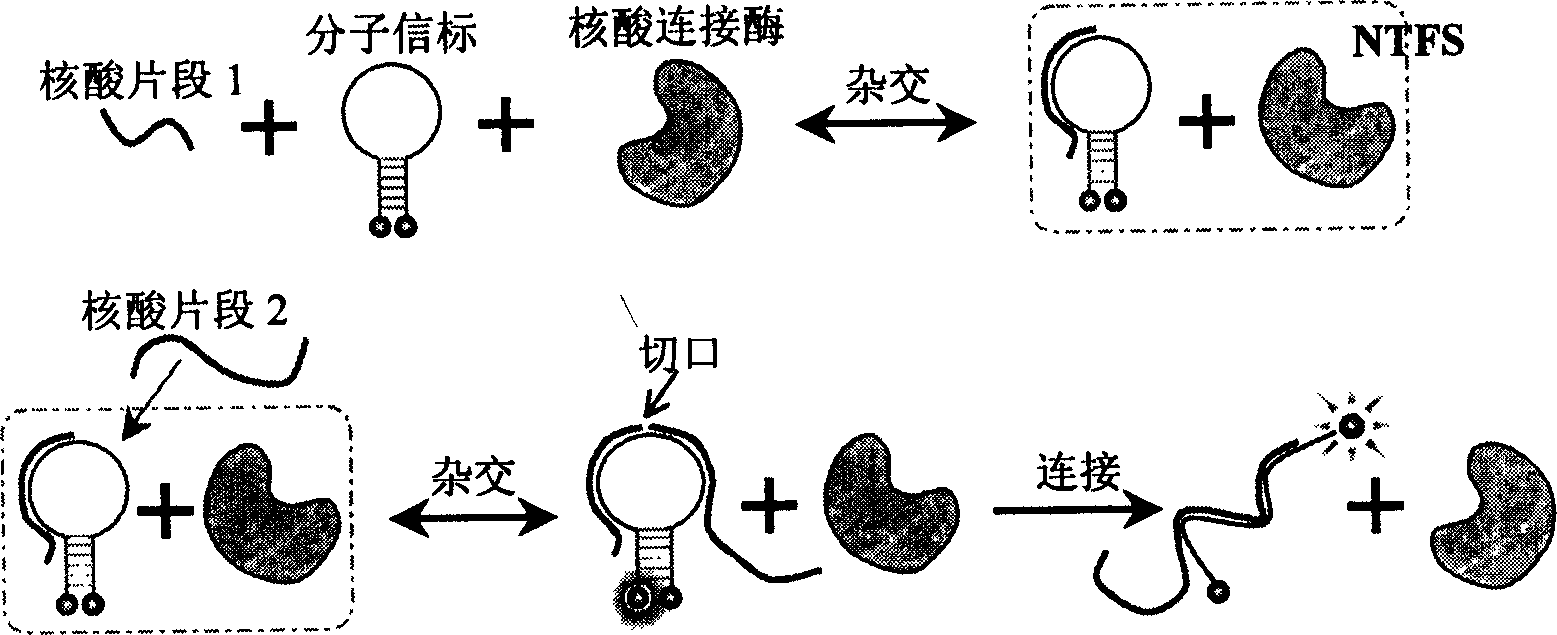
[0026] In 120uL ligation system buffer (30mM Tris-HCl (pH8.0), 2.5mM MnCl 2 , 10mM (NH 4 ) 2 SO 4 , 40mM LiCl, 1.2mM EDTA, 0.1mM NAD+, 0.05%BSA), add 400nM molecular beacon 5'-(TAMRA)-CGTTGA TGG TTC CAC TTC TCG TGC GT TCAACG-(DABCYL)-3', 1.0 Unit E. coli DNA ligase, and 300nM a nucleic acid fragment 5'-AGT GGA ACC-3' half-paired with the molecular beacon, incubated at 37°C, while monitoring the fluorescence intensity with a Fluorolog Tau-3 (Jobin Yvon) fluorometer, The excitation wavelength is 555nm and the emission wavelength is 580nm. After the fluorescence is stabilized, add 300nM of another nucleic acid fragment 5'-CGC ACG AGA-3'. At this time, the fluorescence intensity will increase significantly, as shown in Figure 5 (1) shown. Or use three nucleic acid strands instead of two nucleic acid strands: 5'-CG CACG-3', 5'-AG AAG T-3', 5'-GG AAC C-3', as described above, only in the ligation system buffer First add one or t...
Embodiment 2
[0052] Embodiment 2 (real-time monitoring of nucleic acid ligation process)
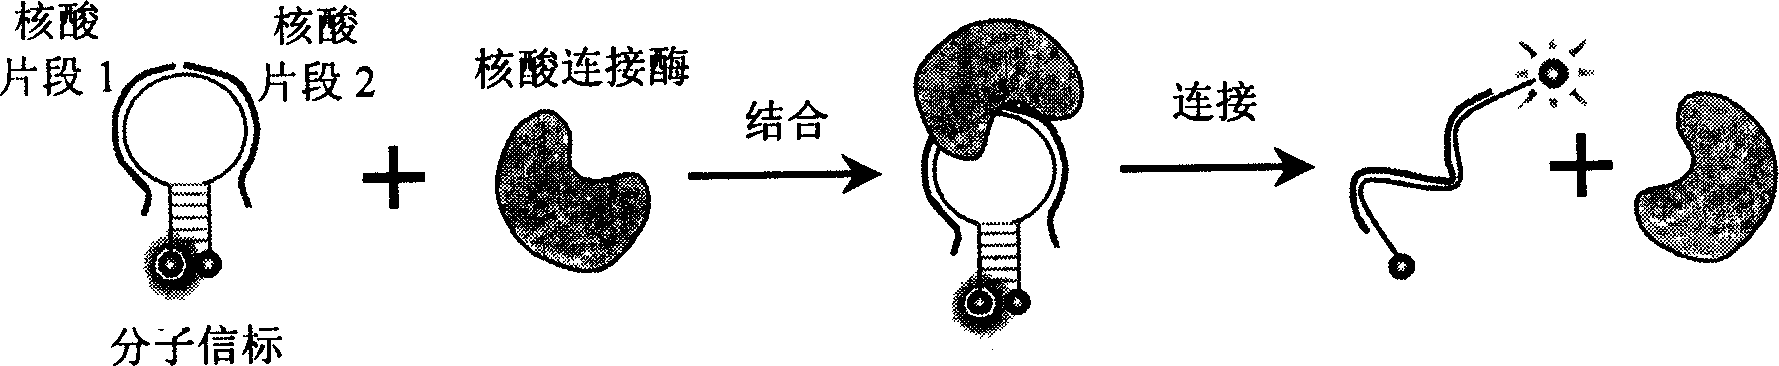
[0053] Add 400nM molecular beacon 5'-(TAMRA)-CGTTGA TGG TTC CAC TTC TCG TGC GTTCAACG- (DABCYL)-3', 300nM nucleic acid fragment 5'-AGT GGA ACC-3' and 300nM another nucleic acid fragment 5'-CGCACG AGA-3', incubated at 37°C while monitoring the fluorescence intensity (fluorescence detection conditions are the same as the implementation Example 1). After the fluorescence is stable, add a certain amount of T4 DNA ligase, and record the change of fluorescence intensity at the same time, such as Image 6 shown.
[0054] Image 6 (Left) is the real-time monitoring curve of nucleic acid ligation catalyzed by different concentrations of ligase. It can be seen that as the concentration of ligase increases, the initial speed of ligation increases. The initial speed of ligation is plotted against the concentration of ligase. Image 6 (Right), as can be seen from the figure, there is a direct proportional rela...
Embodiment 3
[0055] Embodiment three (real-time monitoring of nucleic acid phosphorylation process)
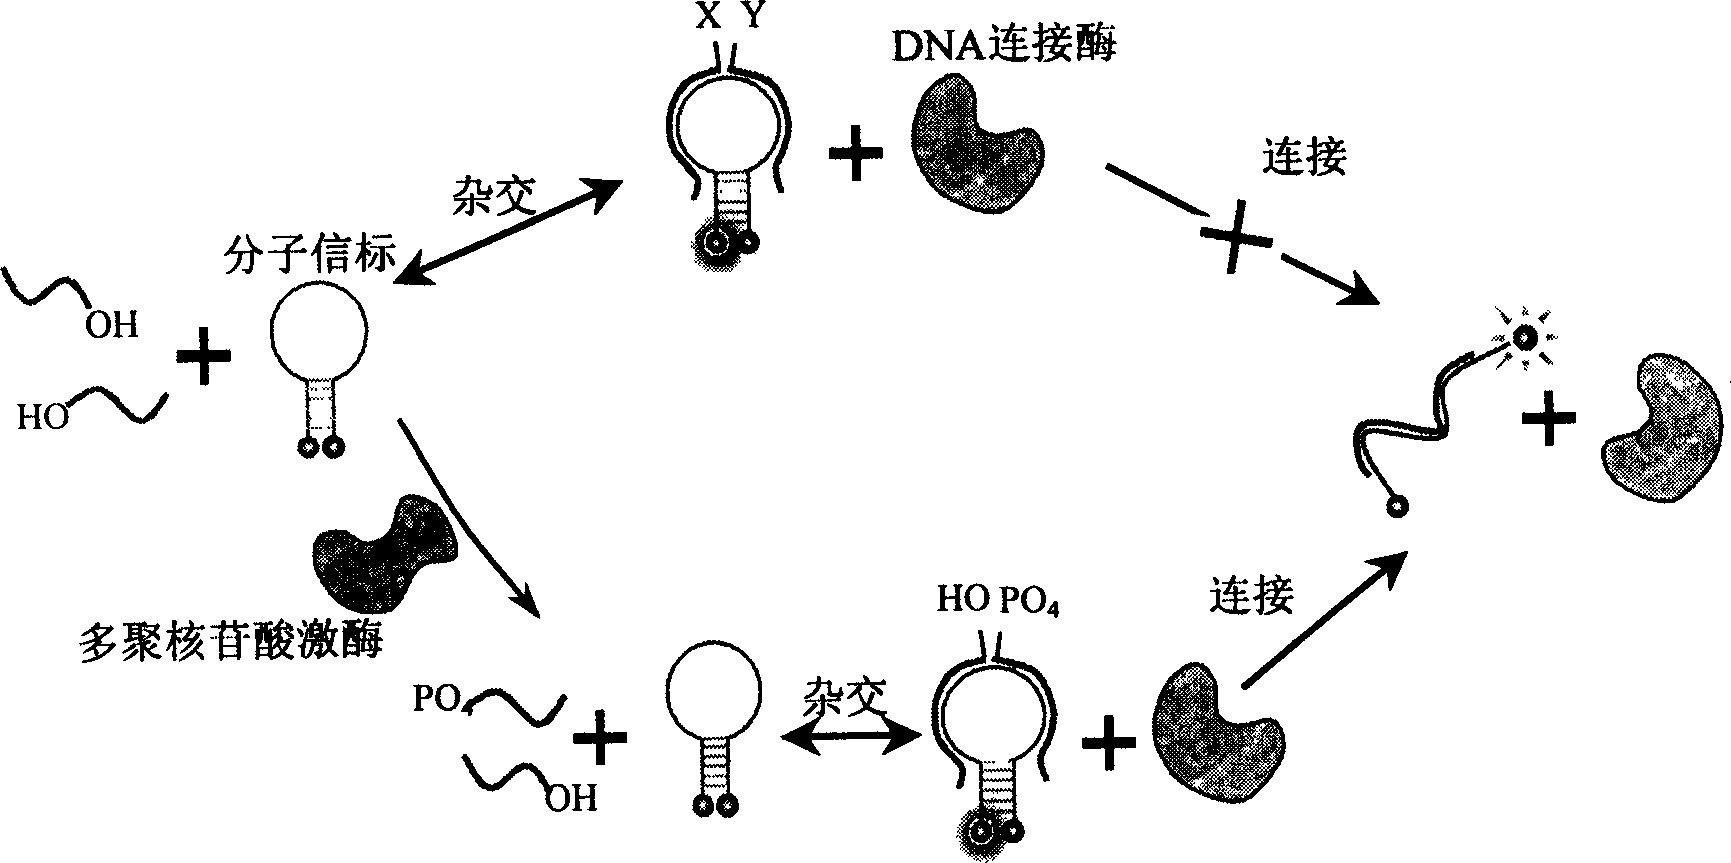
[0056] Add 400nM molecular beacon 5'-(TAMRA)-CGTTGA TGG TTC CAC TTC TCG TGC GTTCAACG to 120uL phosphorylation system buffer (66mM Tris-HCl (pH8.0), 6.6mM MgCl2, 0.1mM ATP, 10mM DTT) -(DABCYL)-3', 300 nM nucleic acid fragment 5'-AGT GGA ACC-3' and 300 nM another nucleic acid fragment 5'-CGCACG AGA-3' (wherein 5'-AGT GGA ACC-3' has no 5' terminal phosphate group), 1.4 Units of T4 DNA ligase were incubated at 37°C, and the fluorescence intensity was monitored with the same parameters as in Example 1. After the fluorescence was stabilized, different concentrations of T4 polynucleotide kinase were added to obtain the real-time scanning curve of the fluorescence intensity as shown in Figure 7 (left) shown.
[0057] Figure 7 (Left) is the real-time monitoring curve of nucleic acid phosphorylation catalyzed by different concentrations of polynucleotide kinase. It can be seen that with the inc...
PUM
 Abstract
Description
Claims
Application Information
 - R&D Engineer
- R&D Manager
- IP Professional
- Industry Leading Data Capabilities
- Powerful AI technology
- Patent DNA Extraction
Browse by: Latest US Patents, China's latest patents, Technical Efficacy Thesaurus, Application Domain, Technology Topic, Popular Technical Reports.
© 2024 PatSnap. All rights reserved.Legal|Privacy policy|Modern Slavery Act Transparency Statement|Sitemap|About US| Contact US: help@patsnap.com