System for separating periodic amplitude peaks from non-periodic amplitude peaks in machine vibration data
a technology of machine vibration and periodic amplitude, applied in the analysis of signals, vibration testing, structural/machine measurement, etc., can solve the problems of suspected lubrication problems, often excessive noise in the pipe, etc., and achieve the effect of easy visualization of the condition
- Summary
- Abstract
- Description
- Claims
- Application Information
AI Technical Summary
Benefits of technology
Problems solved by technology
Method used
Image
Examples
first embodiment
PIP Generation—First Embodiment
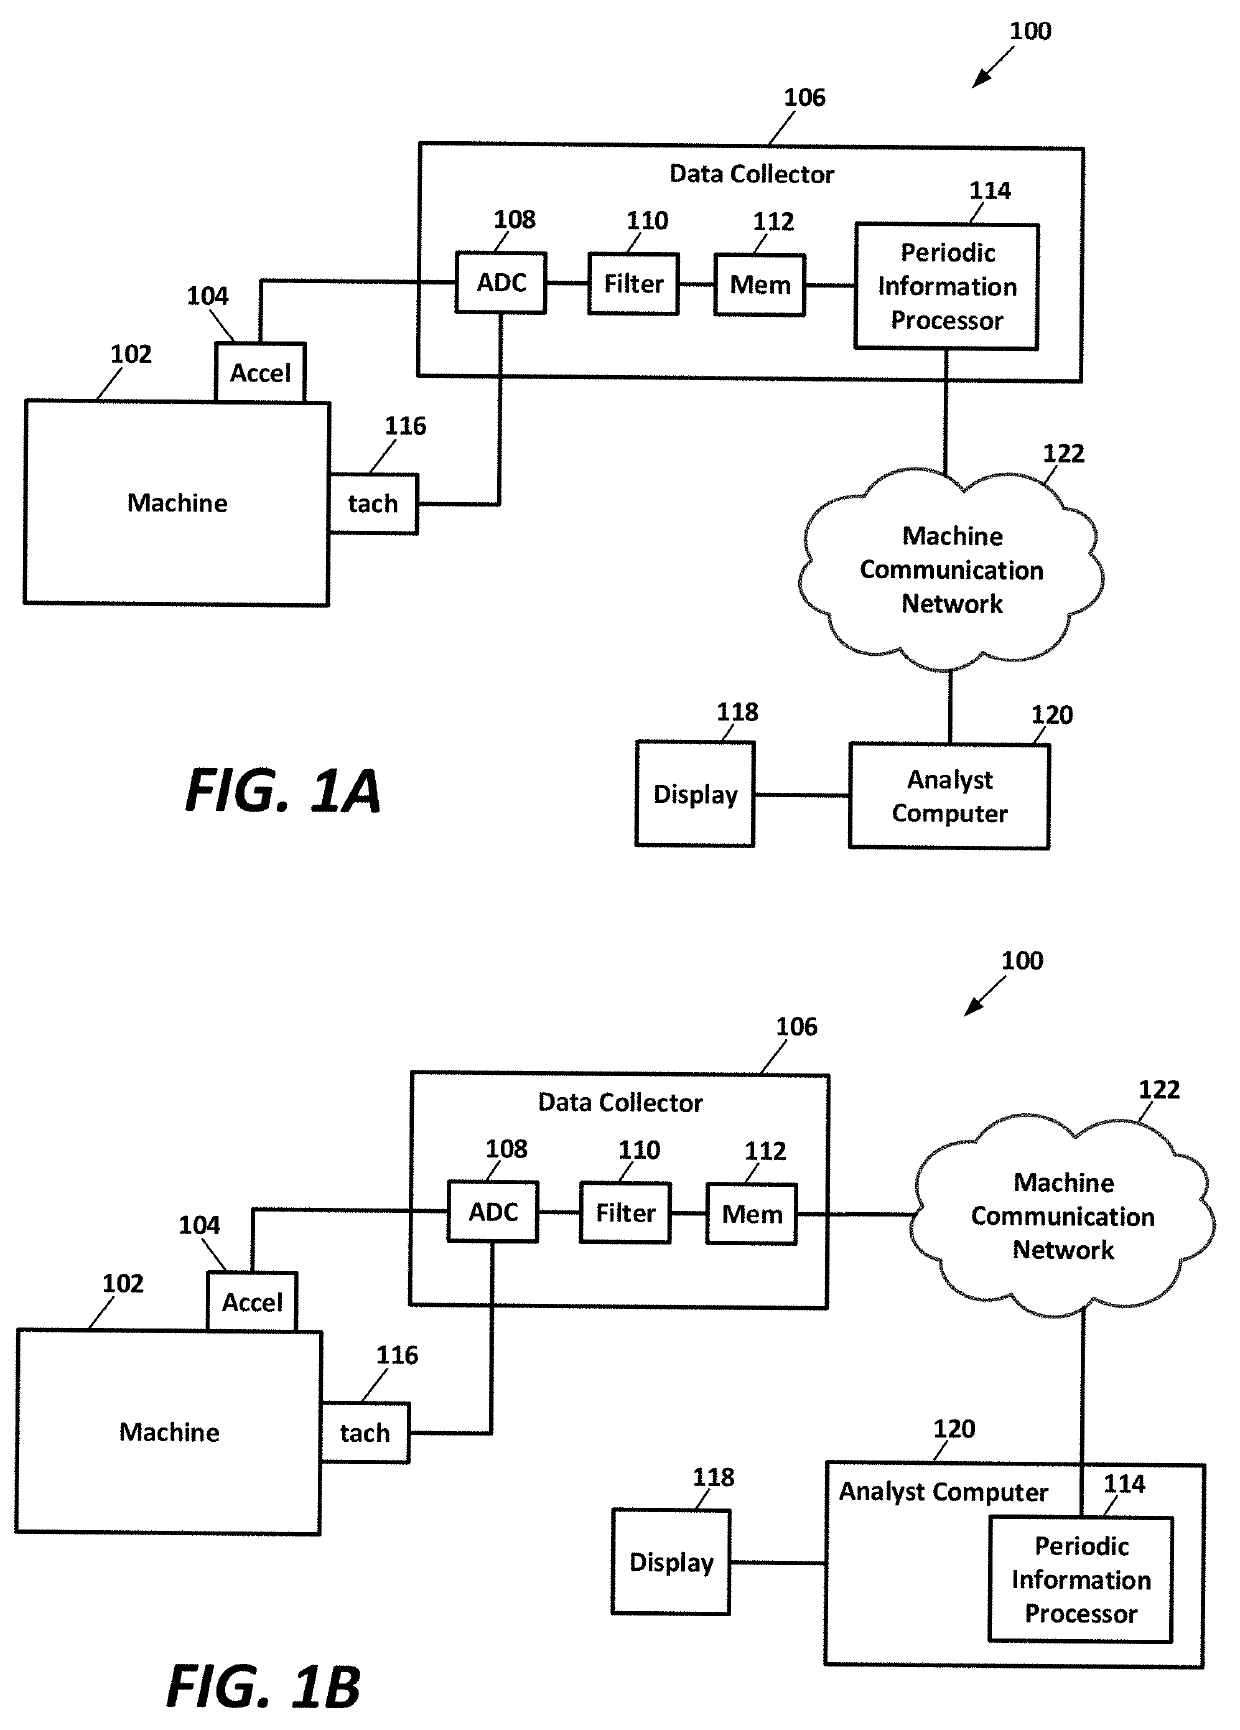
[0110]In a first embodiment, a signal is collected from plant equipment (e.g. rotating or reciprocating equipment) and is processed using two different sets of analysis techniques as depicted in FIG. 8.
[0111]First, a waveform is acquired (step 60 of FIG. 8), such as a vibration waveform acquired using the system depicted in FIG. 1A. If employing a high-pass filter and peak-hold decimation to an oversampled waveform to capture impacting information (such as using the PeakVue™ process), this may be a calculated waveform. An FFT of the waveform is taken (step 62), resulting in a vibration spectrum (VS) 64 with frequency on the X-axis and amplitude on the Y-axis, an example of which is shown in FIG. 9.
[0112]The waveform from step 60 is also autocorrelated (step 66) to generate a waveform referred to herein as the autocorrelation waveform 68, having time on the X-axis and the correlation factor on the Y-axis. The autocorrelation process accentuates periodic...
second embodiment
PIP Generation—Second Embodiment
[0125]In a second embodiment, a signal is collected from plant equipment (i.e. rotating or reciprocating equipment) and is processed using the method 300 depicted in FIG. 20.
[0126]First, a waveform is generated (step 302 of FIG. 20), such as a vibration waveform acquired using the system depicted in FIG. 1A. If employing a high-pass filter and peak-hold decimation to an oversampled waveform to capture impacting information (such as using the PeakVue™ process), this may be a calculated waveform. An FFT of the vibration waveform is taken (step 304), resulting in a vibration spectrum 306 with frequency on the X-axis and amplitude on the Y-axis, an example of which is shown in FIG. 9. The vibration spectrum 306 is also referred to herein as the vibration spectrum to differentiate from the autocorrelation spectrum discussed hereinafter.
[0127]The waveform from step 302 is autocorrelated (step 314) to generate an autocorrelation waveform 316, having time on ...
third embodiment
PIP Generation—Third Embodiment
[0209]In a third embodiment, a signal is collected from plant equipment (i.e. rotating or reciprocating equipment) and is processed using the method 500 depicted in FIGS. 29A and 29B.
[0210]First, a waveform is generated (step 502 of FIG. 29A), such as a vibration waveform acquired using the system depicted in FIG. 1A. If employing a high-pass filter and peak-hold decimation to an oversampled waveform to capture impacting information (such as using the PeakVue™ process), this may be a calculated waveform. An FFT of the vibration waveform is taken (step 504), resulting in a vibration spectrum 506 with frequency on the X-axis and amplitude on the Y-axis, an example of which is shown in FIG. 9. The vibration spectrum 506 may also be referred to herein as the original spectrum to differentiate from the autocorrelation spectrum discussed hereinafter.
[0211]The waveform from step 502 is autocorrelated (step 514) to generate an autocorrelation waveform 516, hav...
PUM
 Abstract
Description
Claims
Application Information
 - R&D
- Intellectual Property
- Life Sciences
- Materials
- Tech Scout
- Unparalleled Data Quality
- Higher Quality Content
- 60% Fewer Hallucinations
Browse by: Latest US Patents, China's latest patents, Technical Efficacy Thesaurus, Application Domain, Technology Topic, Popular Technical Reports.
© 2025 PatSnap. All rights reserved.Legal|Privacy policy|Modern Slavery Act Transparency Statement|Sitemap|About US| Contact US: help@patsnap.com


