System for separating periodic frequency of interest peaks from non-periodic peaks in machine vibration data

a technology of machine vibration and periodic frequency of interest, applied in the analysis of signals, machine parts testing, structural/machine measurement, etc., can solve the problems of suspected lubrication problems, excessive noise in the pipe, etc., and achieve the effect of easy visualization of the condition

Active Publication Date: 2021-07-29
COMPUTATIONAL SYST
View PDF3 Cites 4 Cited by
  • Summary
  • Abstract
  • Description
  • Claims
  • Application Information

AI Technical Summary

Benefits of technology

[0012]By determining the periodicity of a waveform, the PIP can be produced to allow an analyst to easily visualize the condition of the machinery being monitored. From this si

Problems solved by technology

However, since the Percent Periodic Energy value is an estimate, the resulting “basic” PIP often contains excessive noise.
When large peak ampli

Method used


Image

  • System for separating periodic frequency of interest peaks from non-periodic peaks in machine vibration data
  • System for separating periodic frequency of interest peaks from non-periodic peaks in machine vibration data
  • System for separating periodic frequency of interest peaks from non-periodic peaks in machine vibration data

Examples


first embodiment

PIP Generation—First Embodiment

[0080]In a first embodiment, a signal is collected from plant equipment (e.g. rotating or reciprocating equipment) and is processed using two different sets of analysis techniques as depicted in FIG. 8.

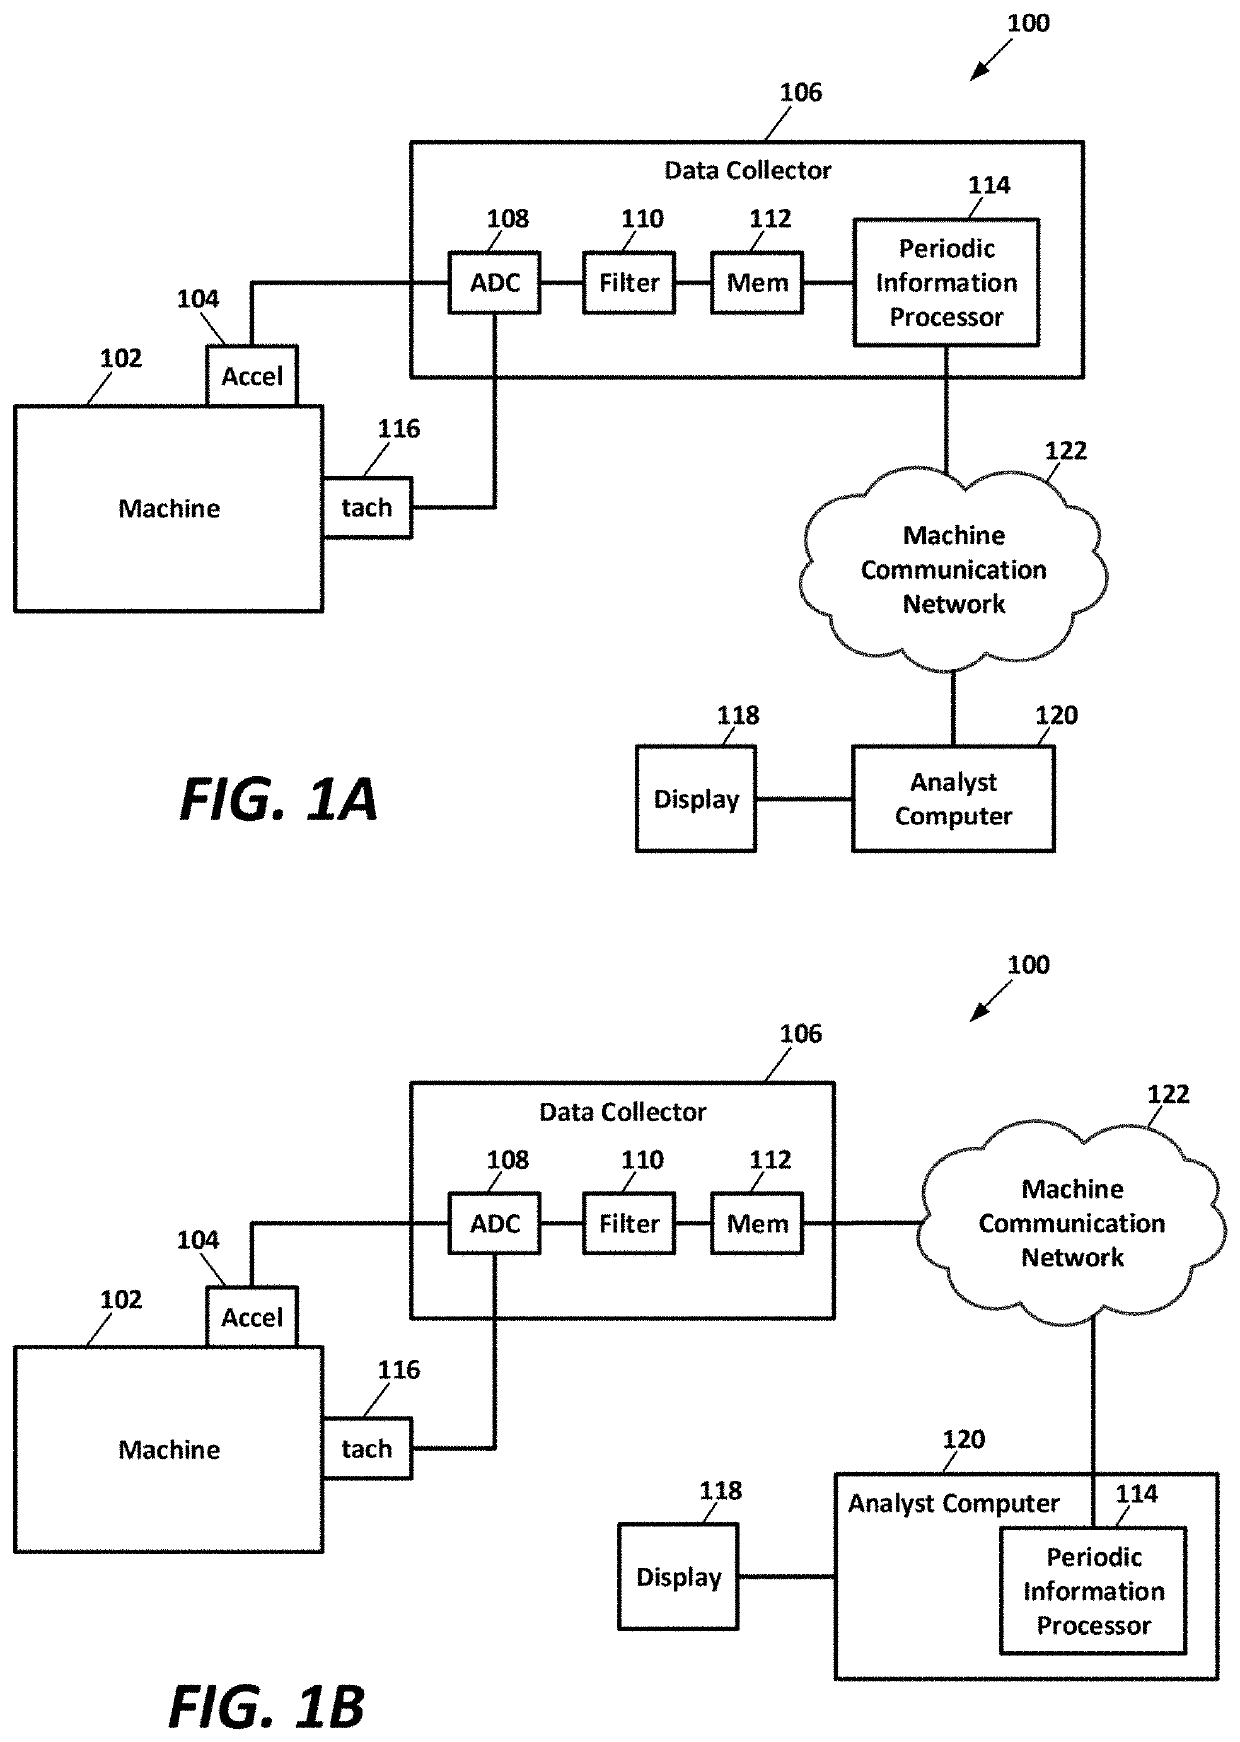
[0081]First, a waveform is acquired (step 60 of FIG. 8), such as a vibration waveform acquired using the system depicted in FIG. 1A. If employing a high-pass filter and peak-hold decimation to an oversampled waveform to capture impacting information (such as using the PeakVue™ process), this may be a calculated waveform. An FFT of the waveform is taken (step 62), resulting in a vibration spectrum (VS) 64 with frequency on the X-axis and amplitude on the Y-axis, an example of which is shown in FIG. 9.

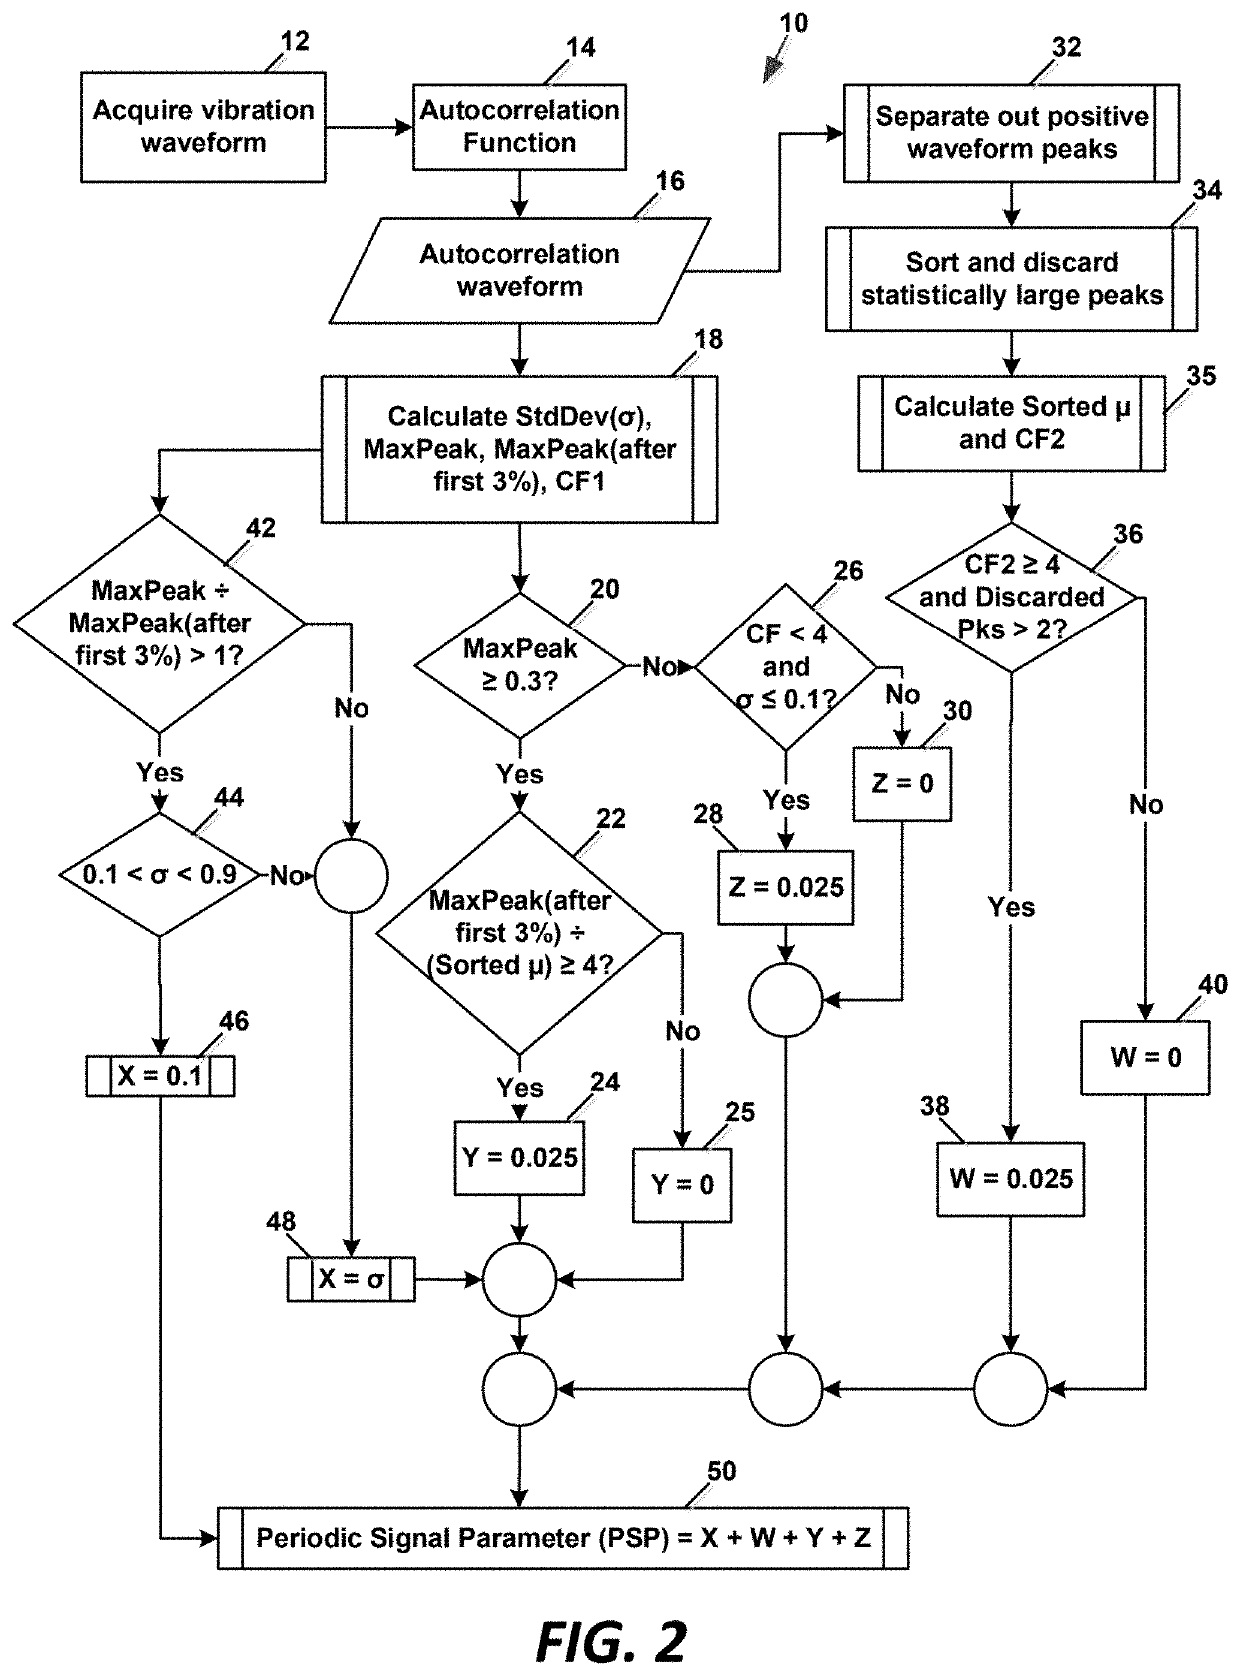
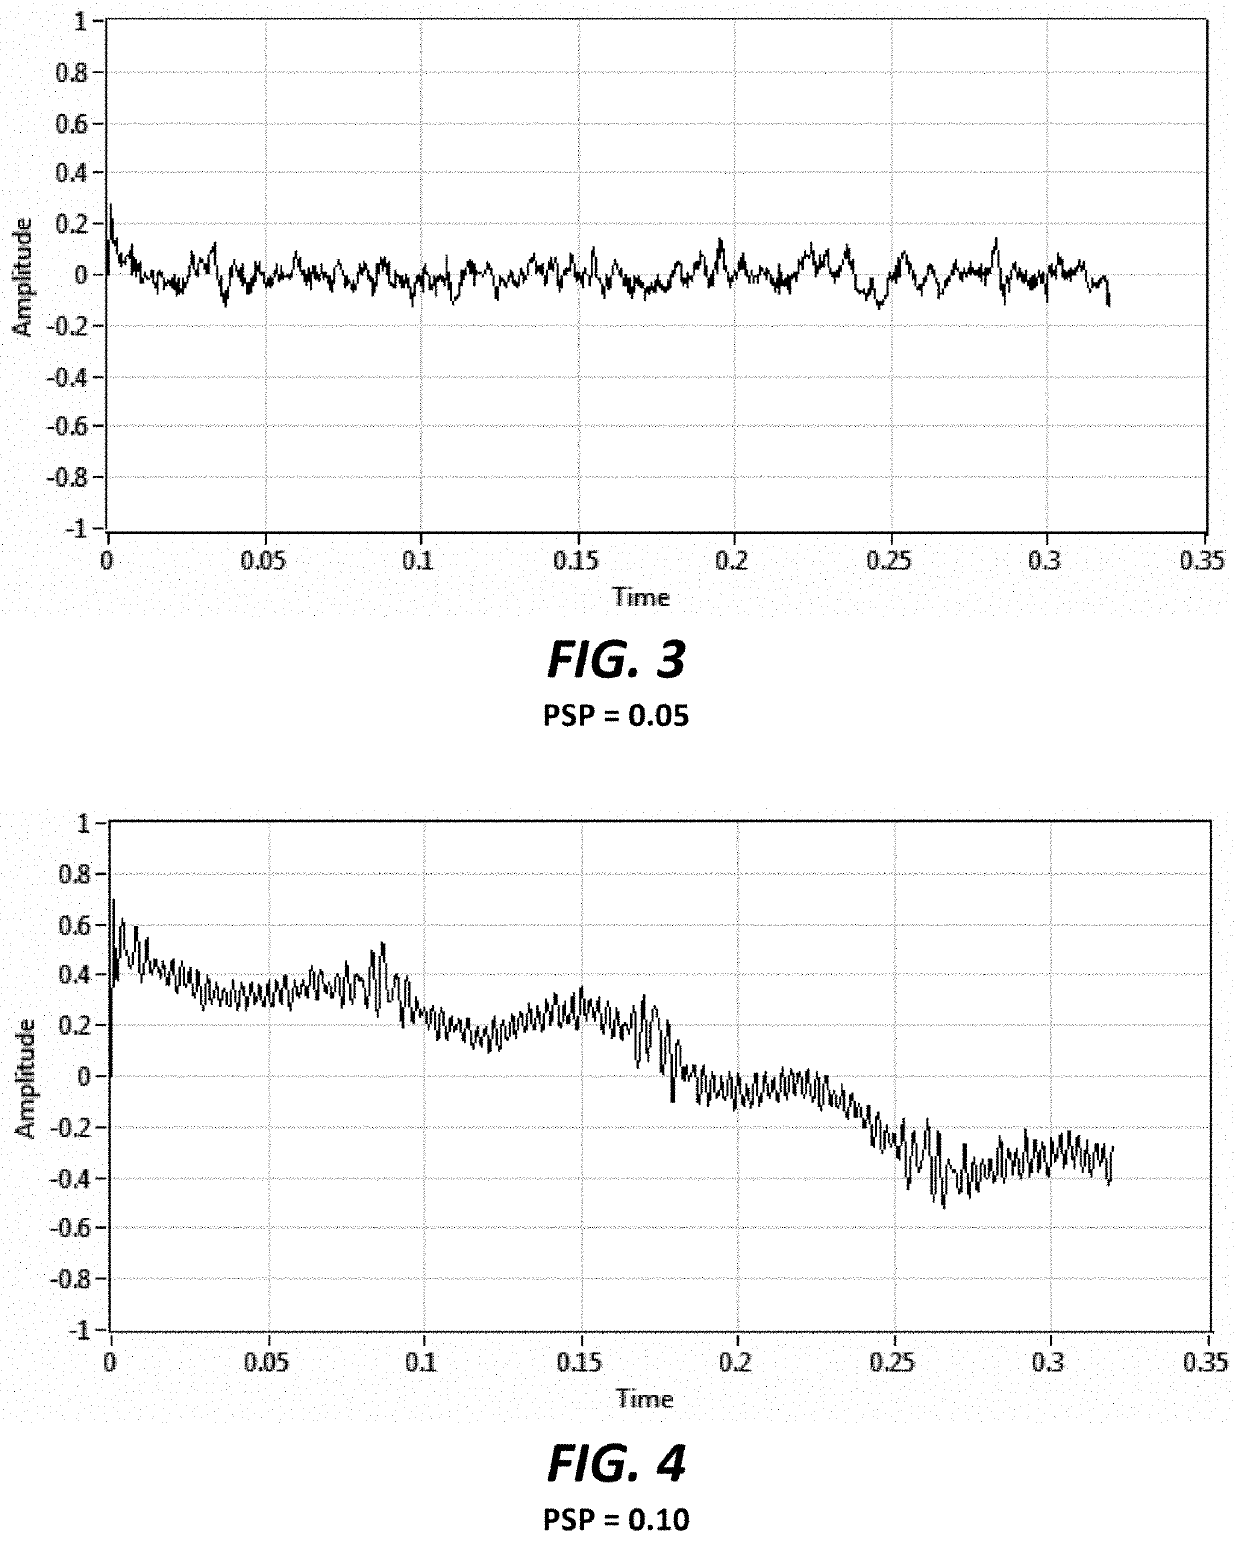
[0082]The waveform from step 60 is also autocorrelated (step 66) to generate a waveform referred to herein as the autocorrelation waveform 68, having time on the X-axis and the correlation factor on the Y-axis. The autocorrelation process accentuates periodic...

second embodiment

PIP Generation—Second Embodiment

[0095]In a second embodiment, a signal is collected from plant equipment (i.e. rotating or reciprocating equipment) and is processed using the method 300 depicted in FIG. 20.

[0096]First, a waveform is generated (step 302 of FIG. 20), such as a vibration waveform acquired using the system depicted in FIG. 1A. If employing a high-pass filter and peak-hold decimation to an oversampled waveform to capture impacting information (such as using the PeakVue™ process), this may be a calculated waveform. An FFT of the vibration waveform is taken (step 304), resulting in a vibration spectrum 306 with frequency on the X-axis and amplitude on the Y-axis, an example of which is shown in FIG. 9. The vibration spectrum 306 is also referred to herein as the vibration spectrum to differentiate from the autocorrelation spectrum discussed hereinafter.

[0097]The waveform from step 302 is autocorrelated (step 314) to generate an autocorrelation waveform 316, having time on ...

third embodiment

PIP Generation—Third Embodiment

[0164]In a third embodiment, a signal is collected from plant equipment (i.e. rotating or reciprocating equipment) and is processed using the method 500 depicted in FIGS. 29A and 29B.

[0165]First, a waveform is generated (step 502 of FIG. 29A), such as a vibration waveform acquired using the system depicted in FIG. 1A. If employing a high-pass filter and peak-hold decimation to an oversampled waveform to capture impacting information (such as using the PeakVue™ process), this may be a calculated waveform. An FFT of the vibration waveform is taken (step 504), resulting in a vibration spectrum 506 with frequency on the X-axis and amplitude on the Y-axis, an example of which is shown in FIG. 9. The vibration spectrum 506 may also be referred to herein as the original spectrum to differentiate from the autocorrelation spectrum discussed hereinafter.

[0166]The waveform from step 502 is autocorrelated (step 514) to generate an autocorrelation waveform 516, hav...


PUM


Abstract

A statistical method is used to separate periodic from non-periodic vibration peaks in machine vibration spectra. Generally, a machine vibration spectrum is not normally distributed because the amplitudes of periodic peaks are significantly large and random relative to the generally Gaussian noise. In a normally distributed signal, the statistical parameter Kurtosis has a value of 3. The method sequentially removes each largest amplitude peak from the peaks in a frequency region of interest in the spectrum until the Kurtosis has a value of three or less. The removed peaks, which are all considered to be periodic, are placed into a candidate peak list. As the process of building the candidate peak list proceeds, if the kurtosis of the remaining peaks in the frequency region of interest falls to three or less, the process stops and the candidate peak list is defined.

Description

RELATED APPLICATIONS[0001]This application claims priority as a continuation-in-part of U.S. non-provisional patent application Ser. No. 16 / 515,793 filed Jul. 18, 2019, titled “System for Separating Periodic Amplitude Peaks from Non-periodic Amplitude Peaks in Machine Vibration Data,” which claims priority as a continuation-in-part of U.S. non-provisional patent application Ser. No. 15 / 697,911 filed Sep. 7, 2017, titled “Machine Fault Prediction Based on Analysis of Periodic Information in a Signal,” which claims priority as a continuation-in-part of U.S. non-provisional patent application Ser. No. 14 / 316,883 filed Jun. 27, 2014, titled “Analysis of Periodic Information in a Signal,” which claims priority to U.S. provisional patent application No. 61 / 842,035 filed Jul. 2, 2013, titled “Periodic Signal Parameter.” All of the subject matter described in the above referenced applications is incorporated herein by reference.FIELD[0002]This invention relates to analysis of signals. More ...

Claims


Application Information

Patent Timeline
IPC IPC(8): G01M13/028G01M13/021
CPCG01M13/028G01M13/021G01M13/045G01M7/00G01H1/00G01H3/06
Inventor BOWERS, III, STEWART V.
Owner COMPUTATIONAL SYST
Why Eureka
Try Eureka