
Method and system for the dynamic analysis of data

a dynamic analysis and data technology, applied in relational databases, instruments, marketing, etc., can solve the problems of analyzing the accumulated data, the value of the accumulated data is minimal, and the analysis of the accumulated data is often faced with new problems and challenges

Inactive Publication Date: 2002-08-08
CAMO
View PDF0 Cites 127 Cited by
  • Summary
  • Abstract
  • Description
  • Claims
  • Application Information

AI Technical Summary

Benefits of technology

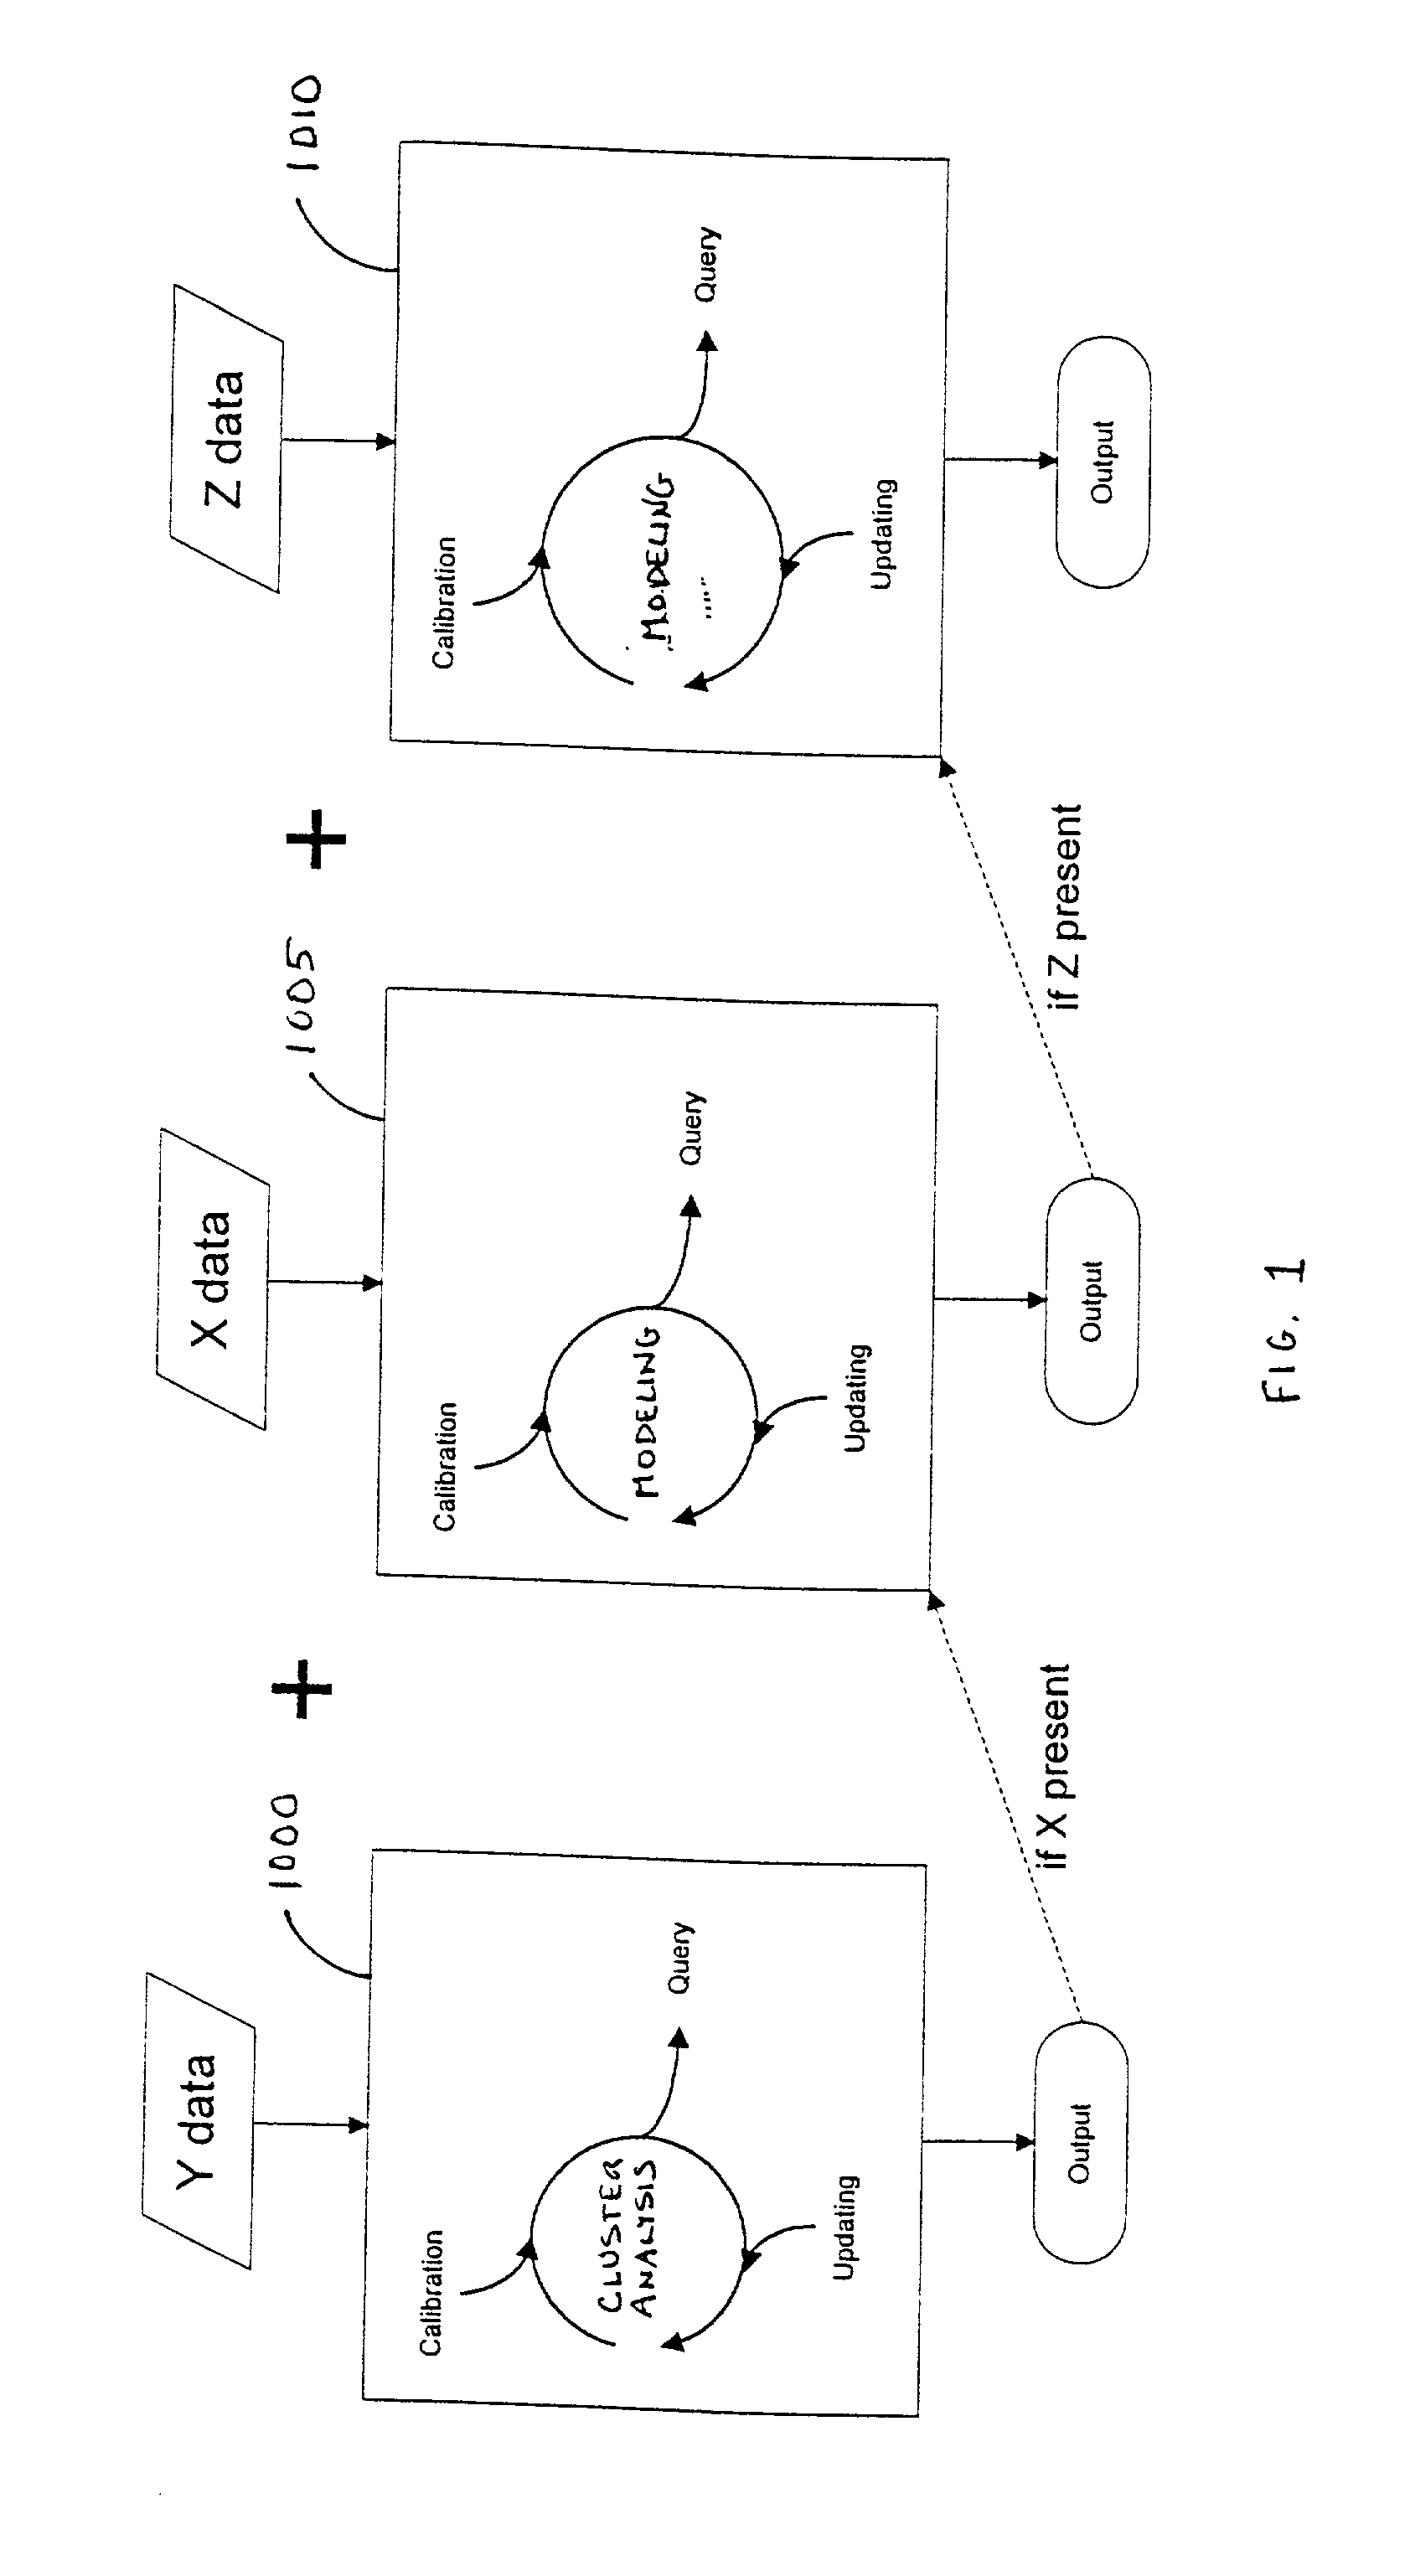
[0010] The present invention is a method and system for the dynamic analysis of data that is comprised of a series of computational steps achieved through the use of a digital computer program. Specifically, there are three phases of the preferred dynamic data analysis. In the first phase, a cluster analysis or clustering sequence is performed on a data matrix Y in order to segment the data into appropriate clusters for subsequent computational analysis. The second phase is a modeling phase. If a second data matrix X is present such that corresponding rows of X and Y each refer to the same underlying object, in the second phase, a relationship can developed between the X and Y data matrices, which allows the method and system of the present invention to predict responses in Y on the basis of inputted X-data. The third phase is also a modeling phase. If a third data matrix Z is present in which corresponding columns of Y and row of Z each refer to the same underlying object, a relationship can developed between the X Y and Z data matrices, which allows the method and system of the present invention to link X with Z through Y.

Problems solved by technology

However, once data has been collected, entities are often faced with new problems and challenges related to the analysis and use of the accumulated data.
If there is not an effective method and system for storing, updating, and analyzing the accumulated data, its value is minimal.
Such problems and challenges are compounded by the desire of entities to gain a better understanding of the complex relationships inherent in the data, and the further desire of entities to access and analyze such relationships, particularly in the real-time world of global computing and the Internet.
In so identifying these preferences and attitudes, manufacturers of consumer products often accumulate vast amounts of raw data.
Current data mining and knowledge extraction techniques, however, are not always effective.
One of the primary problems is the pace at which consumer preferences and attitudes shift and change.
Many of the prior art analysis tools can not rapidly adapt to changing market conditions.
However, since the manufacturer did not account for the dynamics of the marketplace, the shifting and changing of consumer preferences, its model may prove ultimately ineffective.
While such approaches assist in developing an understanding of data relationships or associations, they do not allow for the incorporation of the respective independent qualities of objects into models, qualities that that define predictive (e.g., cause and effect) relationships between independent objects.
Similarly, prior art approaches do not allow for the grouping of segments of objects of one type with respect to some measure on another set of objects of another type, nor do they allow for the use of the qualities of the respective objects to build predictive models relating the qualities of the two respective types of objects.

Method used


Image

  • Method and system for the dynamic analysis of data
  • Method and system for the dynamic analysis of data
  • Method and system for the dynamic analysis of data

Examples


Embodiment Construction

[0090] Before proceeding with a detailed review of the mathematical computation underlying the method and system of the present invention, perhaps the present invention is best explained by an example.

[0091] First, suppose that ten different carbonated beverages were each tasted by one hundred consumers of carbonated beverages. Each consumer rated each beverage on a nine-point hedonic scale, thus generating a 100.times.10 data array, Y.

[0092] Secondly, each consumer answered twenty demographic and lifestyle questions, thus generating a 100.times.20 data array, X.

[0093] Thirdly, a panel of beverage experts rated each of the ten carbonated beverages based on fifteen different categories or criteria (e.g., as sweetness, degree of carbonation, smell, and color) using a seven-point scale, thus generating a 10.times.15 data array, Z.

[0094] Each of the data matrices (X, Y and Z) is preferably contained in an ASCII or similar computer-readable file which can then be input or entered into a ...


PUM


Abstract

In a method and system for the dynamic analysis of data represented in distinct matrices, if two data matrices X and Y are present in which corresponding rows of X and Y each refer to the same underlying object, a relationship can developed between the X and Y data matrices, which allows for a prediction of responses in Y on the basis of inputted X-data. And, if a third data matrix Z is present in which corresponding columns of Y and row of Z each refer to the same underlying object, a relationship can developed between the X Y and Z data matrices, which allows for link between X and Z through Y.

Description

[0001] The present application claims priority from U.S. provisional application No. 60 / 216,231 filed Jul. 5, 2000. This application relates to a method and system for the dynamic analysis of data, especially data represented in distinct matrices, for example, X, Y and Z data matrices. If two data matrices X and Y are present in which corresponding rows of X and Y each refer to the same underlying object, a relationship can developed between the X and Y data matrices, which allows the method and system of the present invention to predict responses in Y on the basis of inputted X-data. And, if a third data matrix Z is present in which corresponding columns of Y and rows of Z each refer to the same underlying object, a relationship can developed between the X, Y and Z data matrices, which allows the method and system of the present invention to link X with Z through Y.BACKGROUND OF THE INVENTION[0002] Again, this application relates to a method and system for the dynamic analysis of d...

Claims


Application Information

Patent Timeline
IPC IPC(8): G06F7/00G06F17/30G06K9/62G06Q30/00
CPCG06F17/30598G06F17/30705G06K9/6218G06K9/6247G06K9/6284G06Q30/02Y10S707/99942G06F16/285G06F16/35G06F18/23G06F18/2135G06F18/2433
Inventor LUNDAHL, DAVID S.PLAEHN, DAVID C.
Owner CAMO
Learn More