
Method for estimating the number of nuclei of a preselected isotope in a molecular species from and NMR spectrum

a technology of molecular species and nuclei, applied in the field of methods for estimating the number of nuclei of preselected isotopes in molecular species from and nmr spectrum, can solve the problems of overlapping nmr signal peaks, inaccuracy in the determination of integrals, and deviation of theoretical expectations of the nmr spectrum obtained in practi

Active Publication Date: 2005-05-26
F HOFFMANN LA ROCHE & CO AG
View PDF3 Cites 0 Cited by
  • Summary
  • Abstract
  • Description
  • Claims
  • Application Information

AI Technical Summary

Benefits of technology

The present invention provides a method for estimating the number of nuclei of a preselected isotope in a molecular species from an NMR spectrum of a sample containing the molecular species. This method can be applied to a broad range of molecular species and samples, and it does not require a known solvent or impurity signal. The method involves selecting a set of signal peaks, ordering them according to a criterion, and integrating them to obtain a set of ordered integrals. These integrals are then used to calculate a scaling factor, which is used to rescale all integrals and obtain a set of integerized scaled integrals. The method can be carried out in an inner and outer iteration cycle until all integrals have been processed. The invention provides a computer program product and a computer storage media for retrieving and storing the result set of the method. The technical effect of this invention is to overcome the difficulties and limitations of NMR spectroscopy for qualitative and quantitative analysis of molecules.

Problems solved by technology

A fundamental problem in both qualitative and quantitative applications of NMR spectroscopy is caused by the fact that any NMR spectrum obtained in practice will deviate to some degree from the theoretical expectation.
This discrepancy is mainly due to inevitable noise contributions, but also to other experimental influences such as field inhomogeneities, drifts and further effects.
Moreover, solvent effects and exchange reactions, e.g. exchange of hydrogen ions when carrying out 1H-NMR spectroscopy may lead to inaccuracies in the determination of integrals.
A further problem is caused by the so-called chemical shift degeneracy, which refers to a situation where nuclei at different locations within a molecular species have essentially identical chemical shifts and thus give rise to overlapping NMR signal peaks.
These facts give rise to the following difficulties in qualitative and quantitative analysis by NMR-spectroscopy.
Under less favorable conditions, however, calculating a set of integer rescaled intensities can result in a solution with unrealistic numbers of nuclei.
For example, two signal peaks each resulting from one specific nucleus in a molecule should have the same signal integral, but finding an experimental integral ratio of 0.97 / 1.03 would suggest that the molecular species has 97 nuclei of the first sort and 103 nuclei of the second sort and thus would lead to an unacceptable interpretation of the NMR spectrum.
As in the case of qualitative analysis, any experimentally caused deviation from ideal signal integral would result in a corresponding error of the quantitative estimate.
In summary, the usefulness of NMR spectroscopy in qualitative and in quantitative analysis is limited by the fact that due to inevitable experimental inaccuracies and due to chemical shift degeneracy the number of nuclei of a preselected isotope in a molecular species is generally not directly available from an NMR spectrum of a sample containing said molecular species.
Application of NMR spectroscopy in the fields mentioned above is also hampered by the fact that an automated determination of concentration and purity of samples is not known in the art.

Method used


Image

  • Method for estimating the number of nuclei of a preselected isotope in a molecular species from and NMR spectrum
  • Method for estimating the number of nuclei of a preselected isotope in a molecular species from and NMR spectrum
  • Method for estimating the number of nuclei of a preselected isotope in a molecular species from and NMR spectrum

Examples


example 1

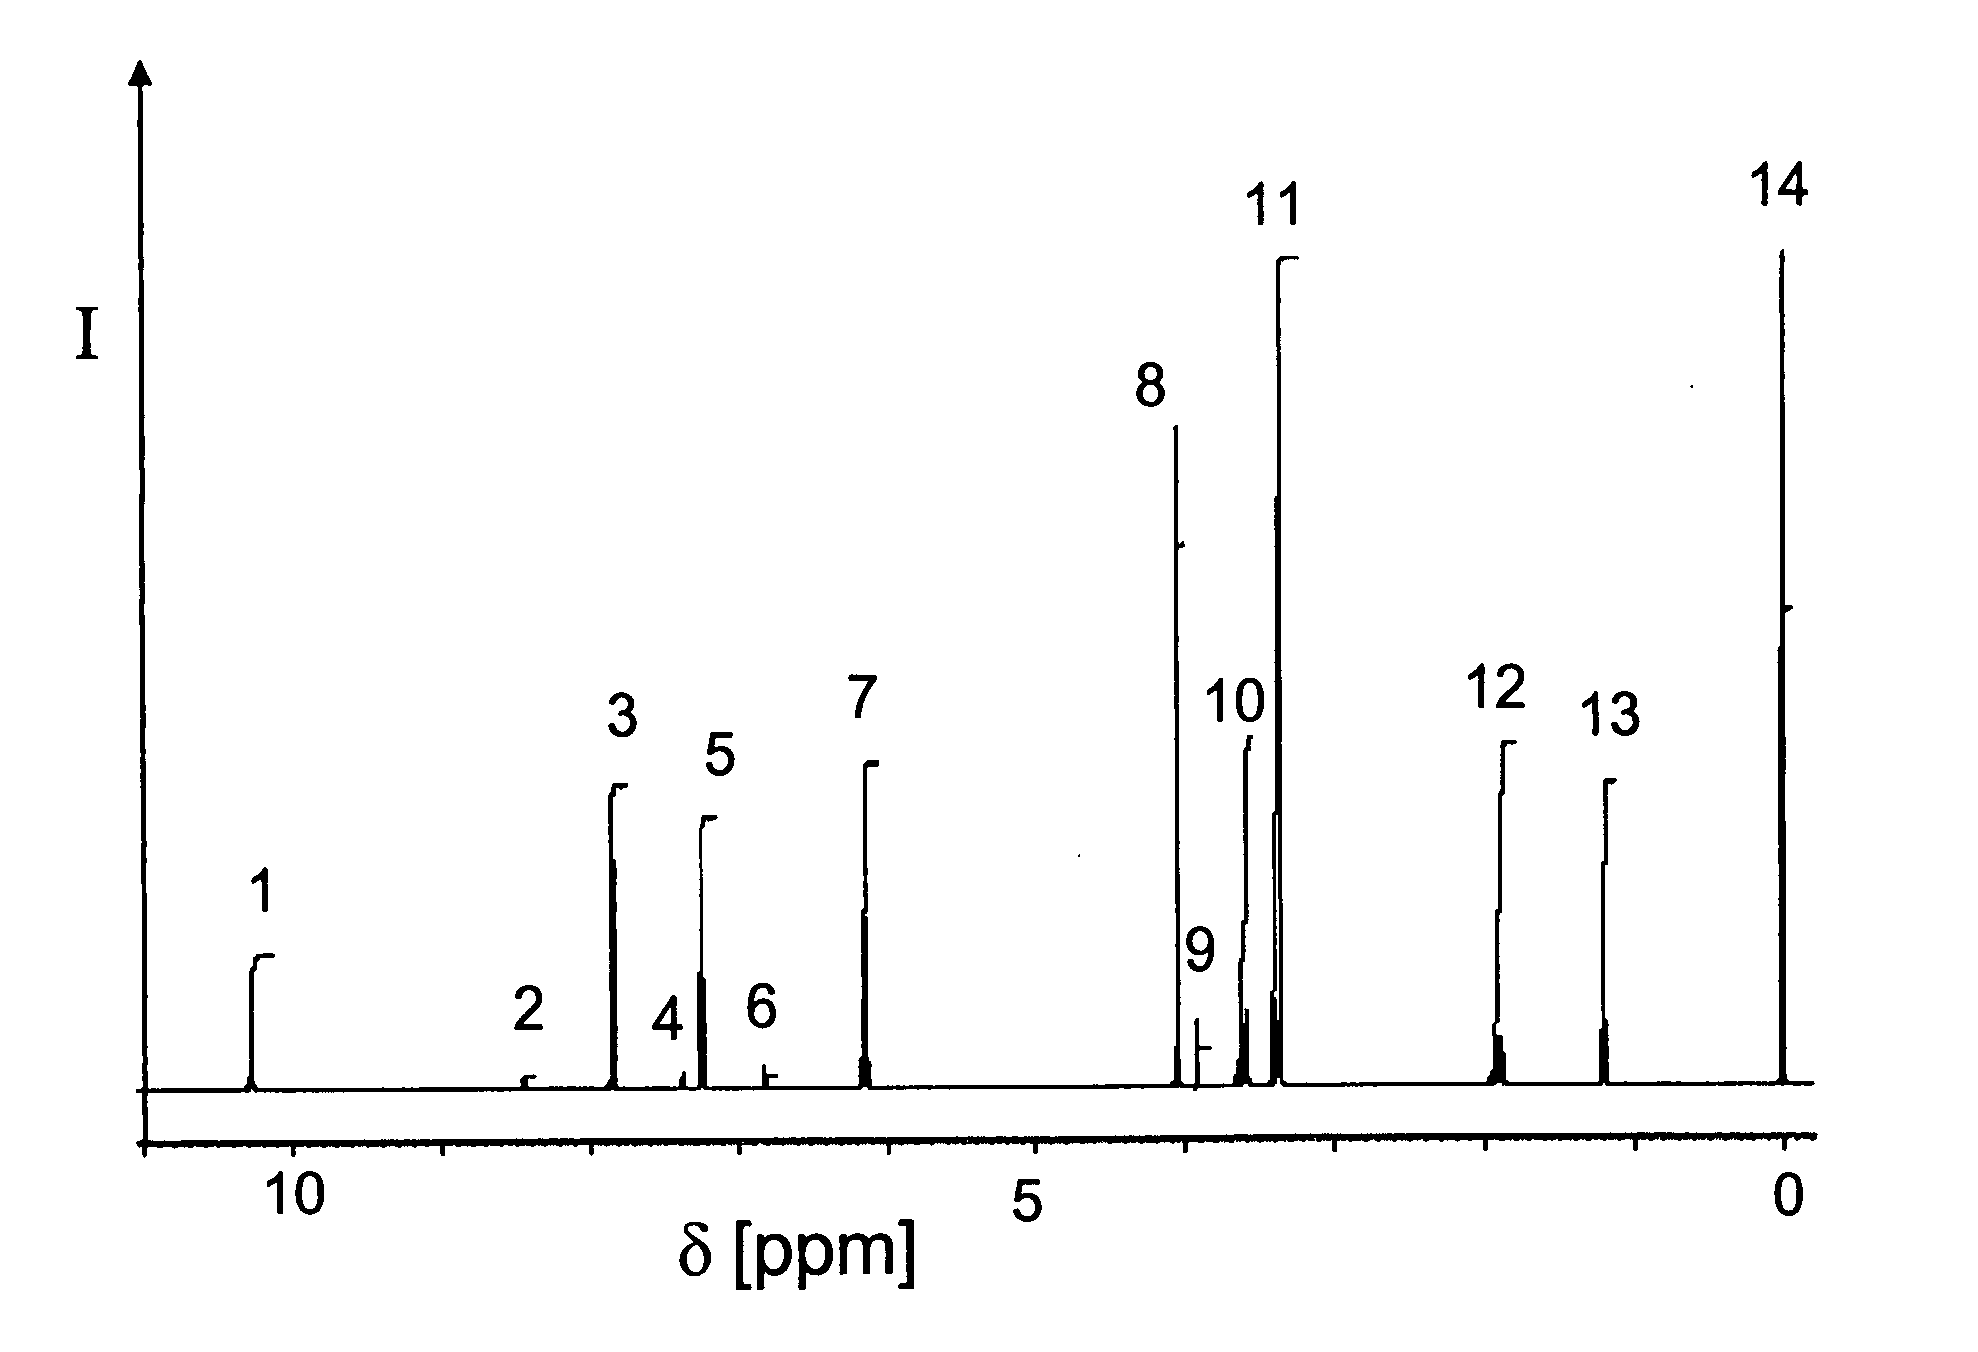
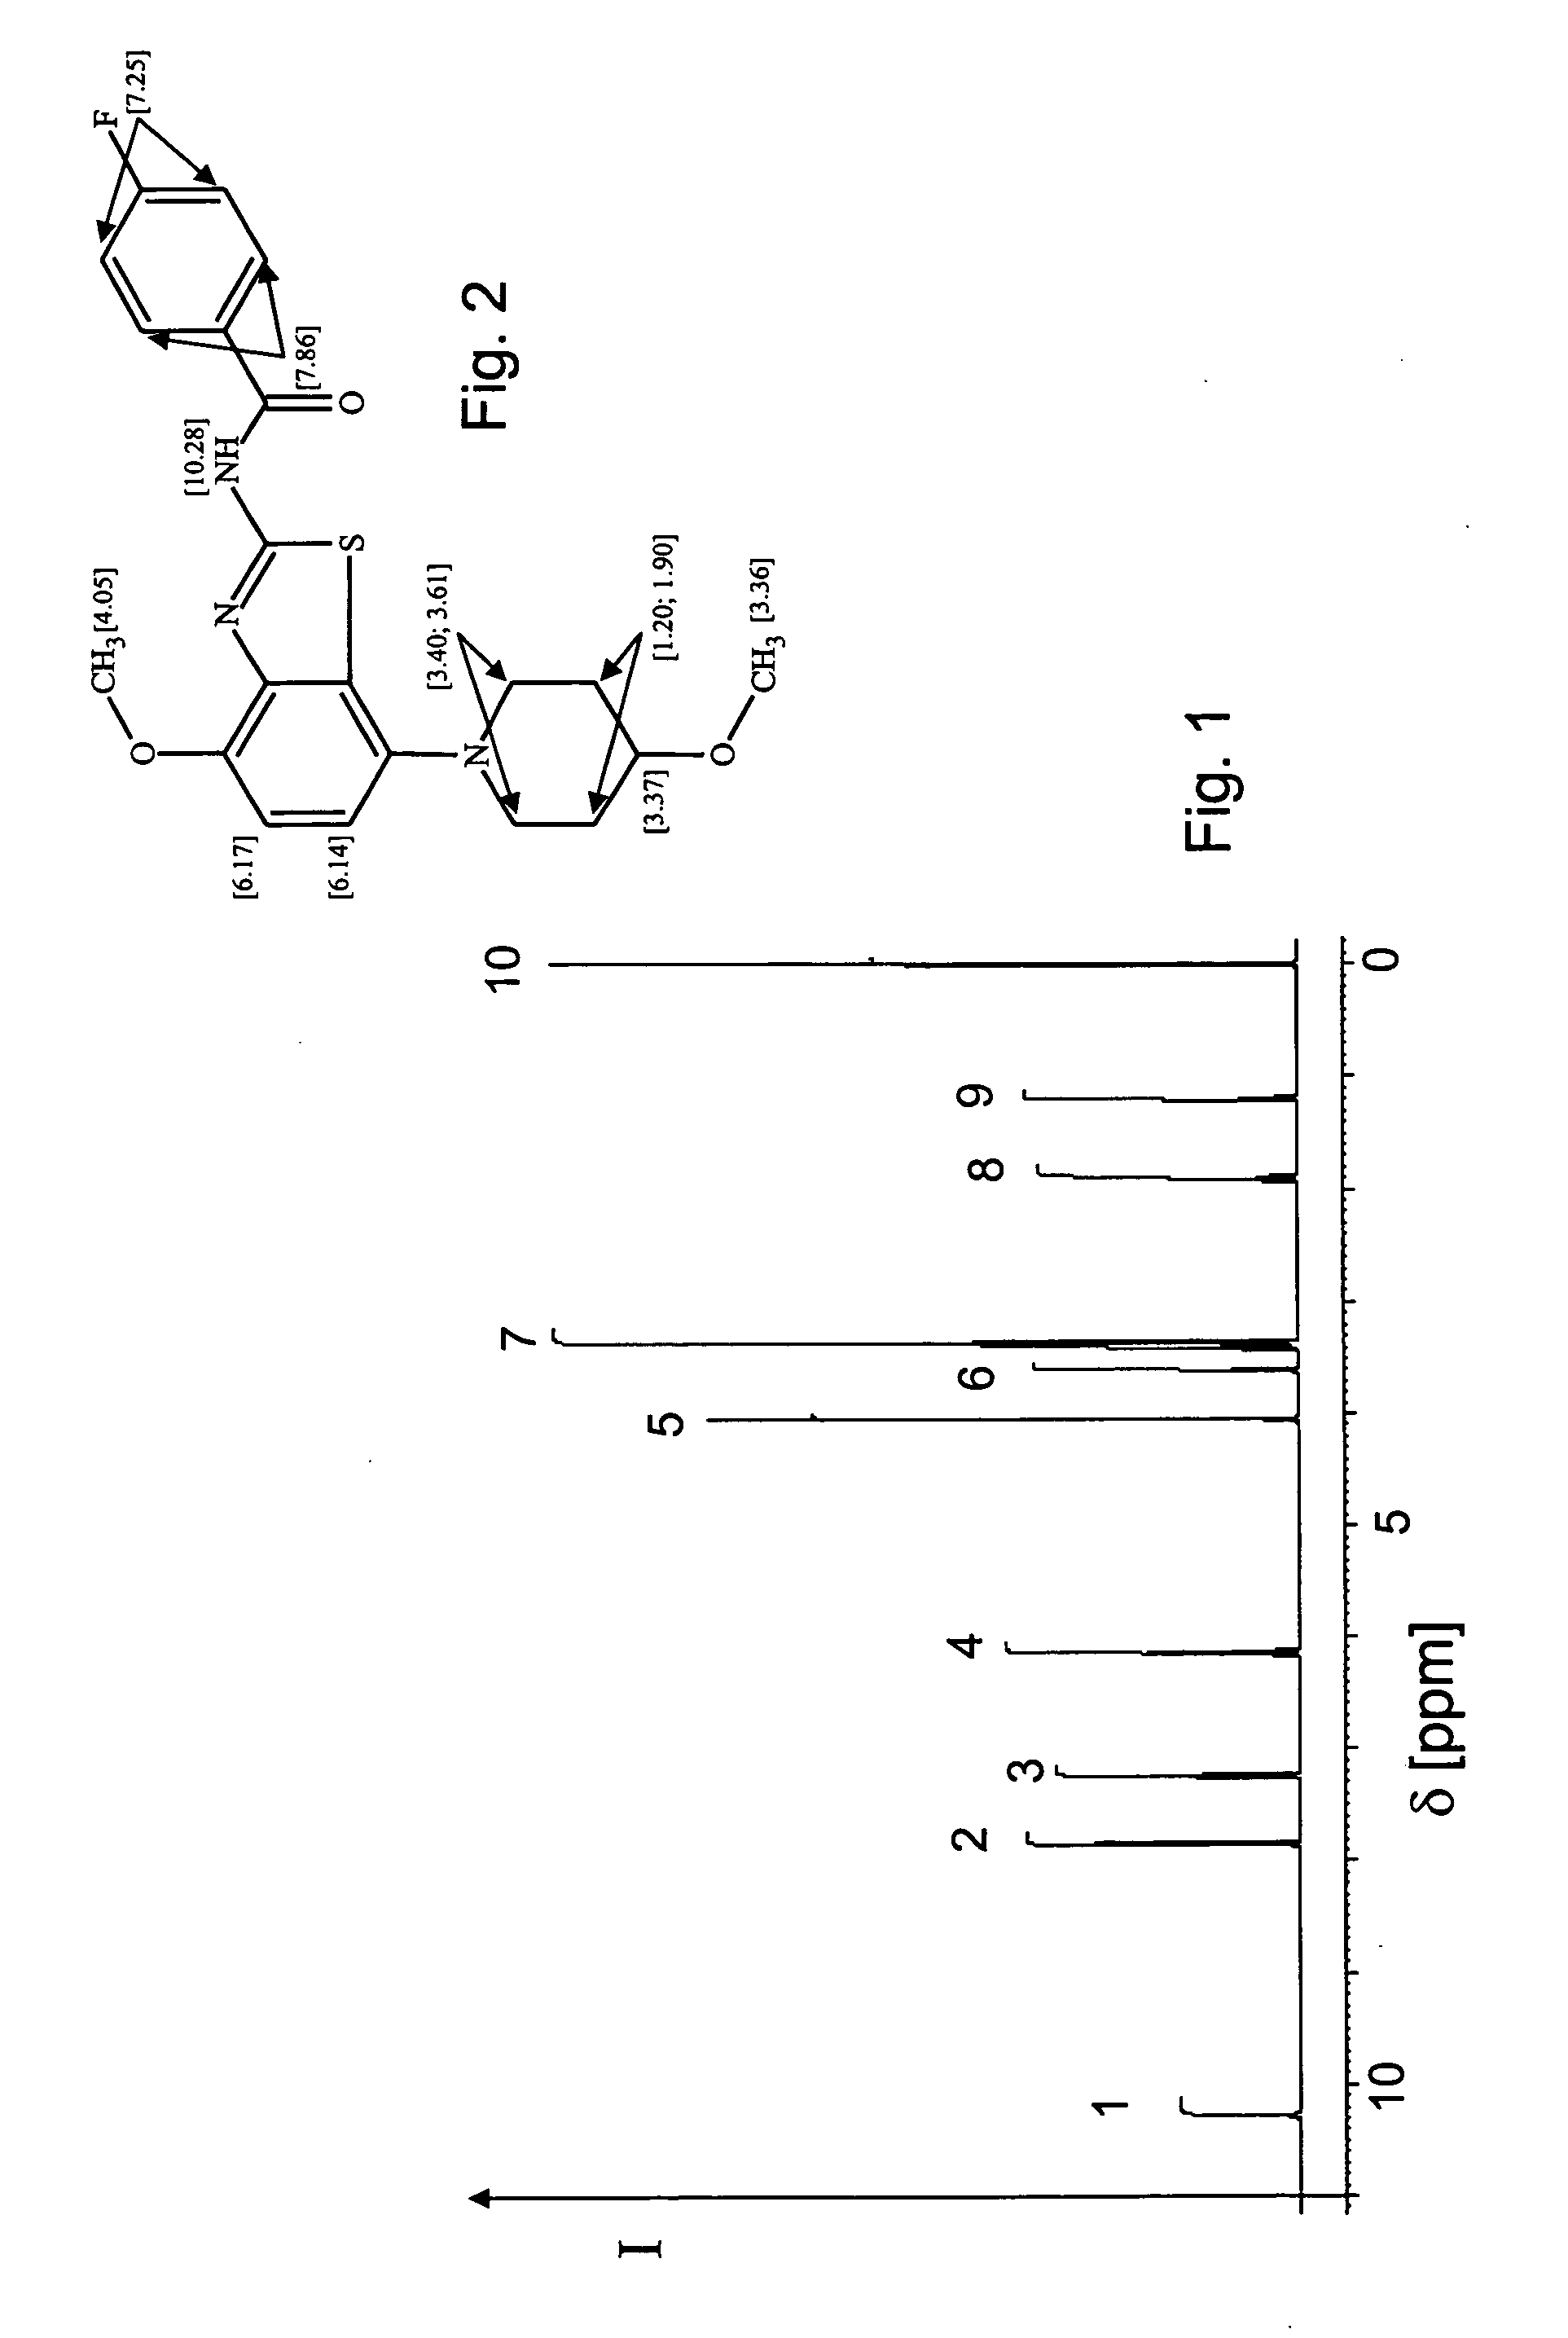
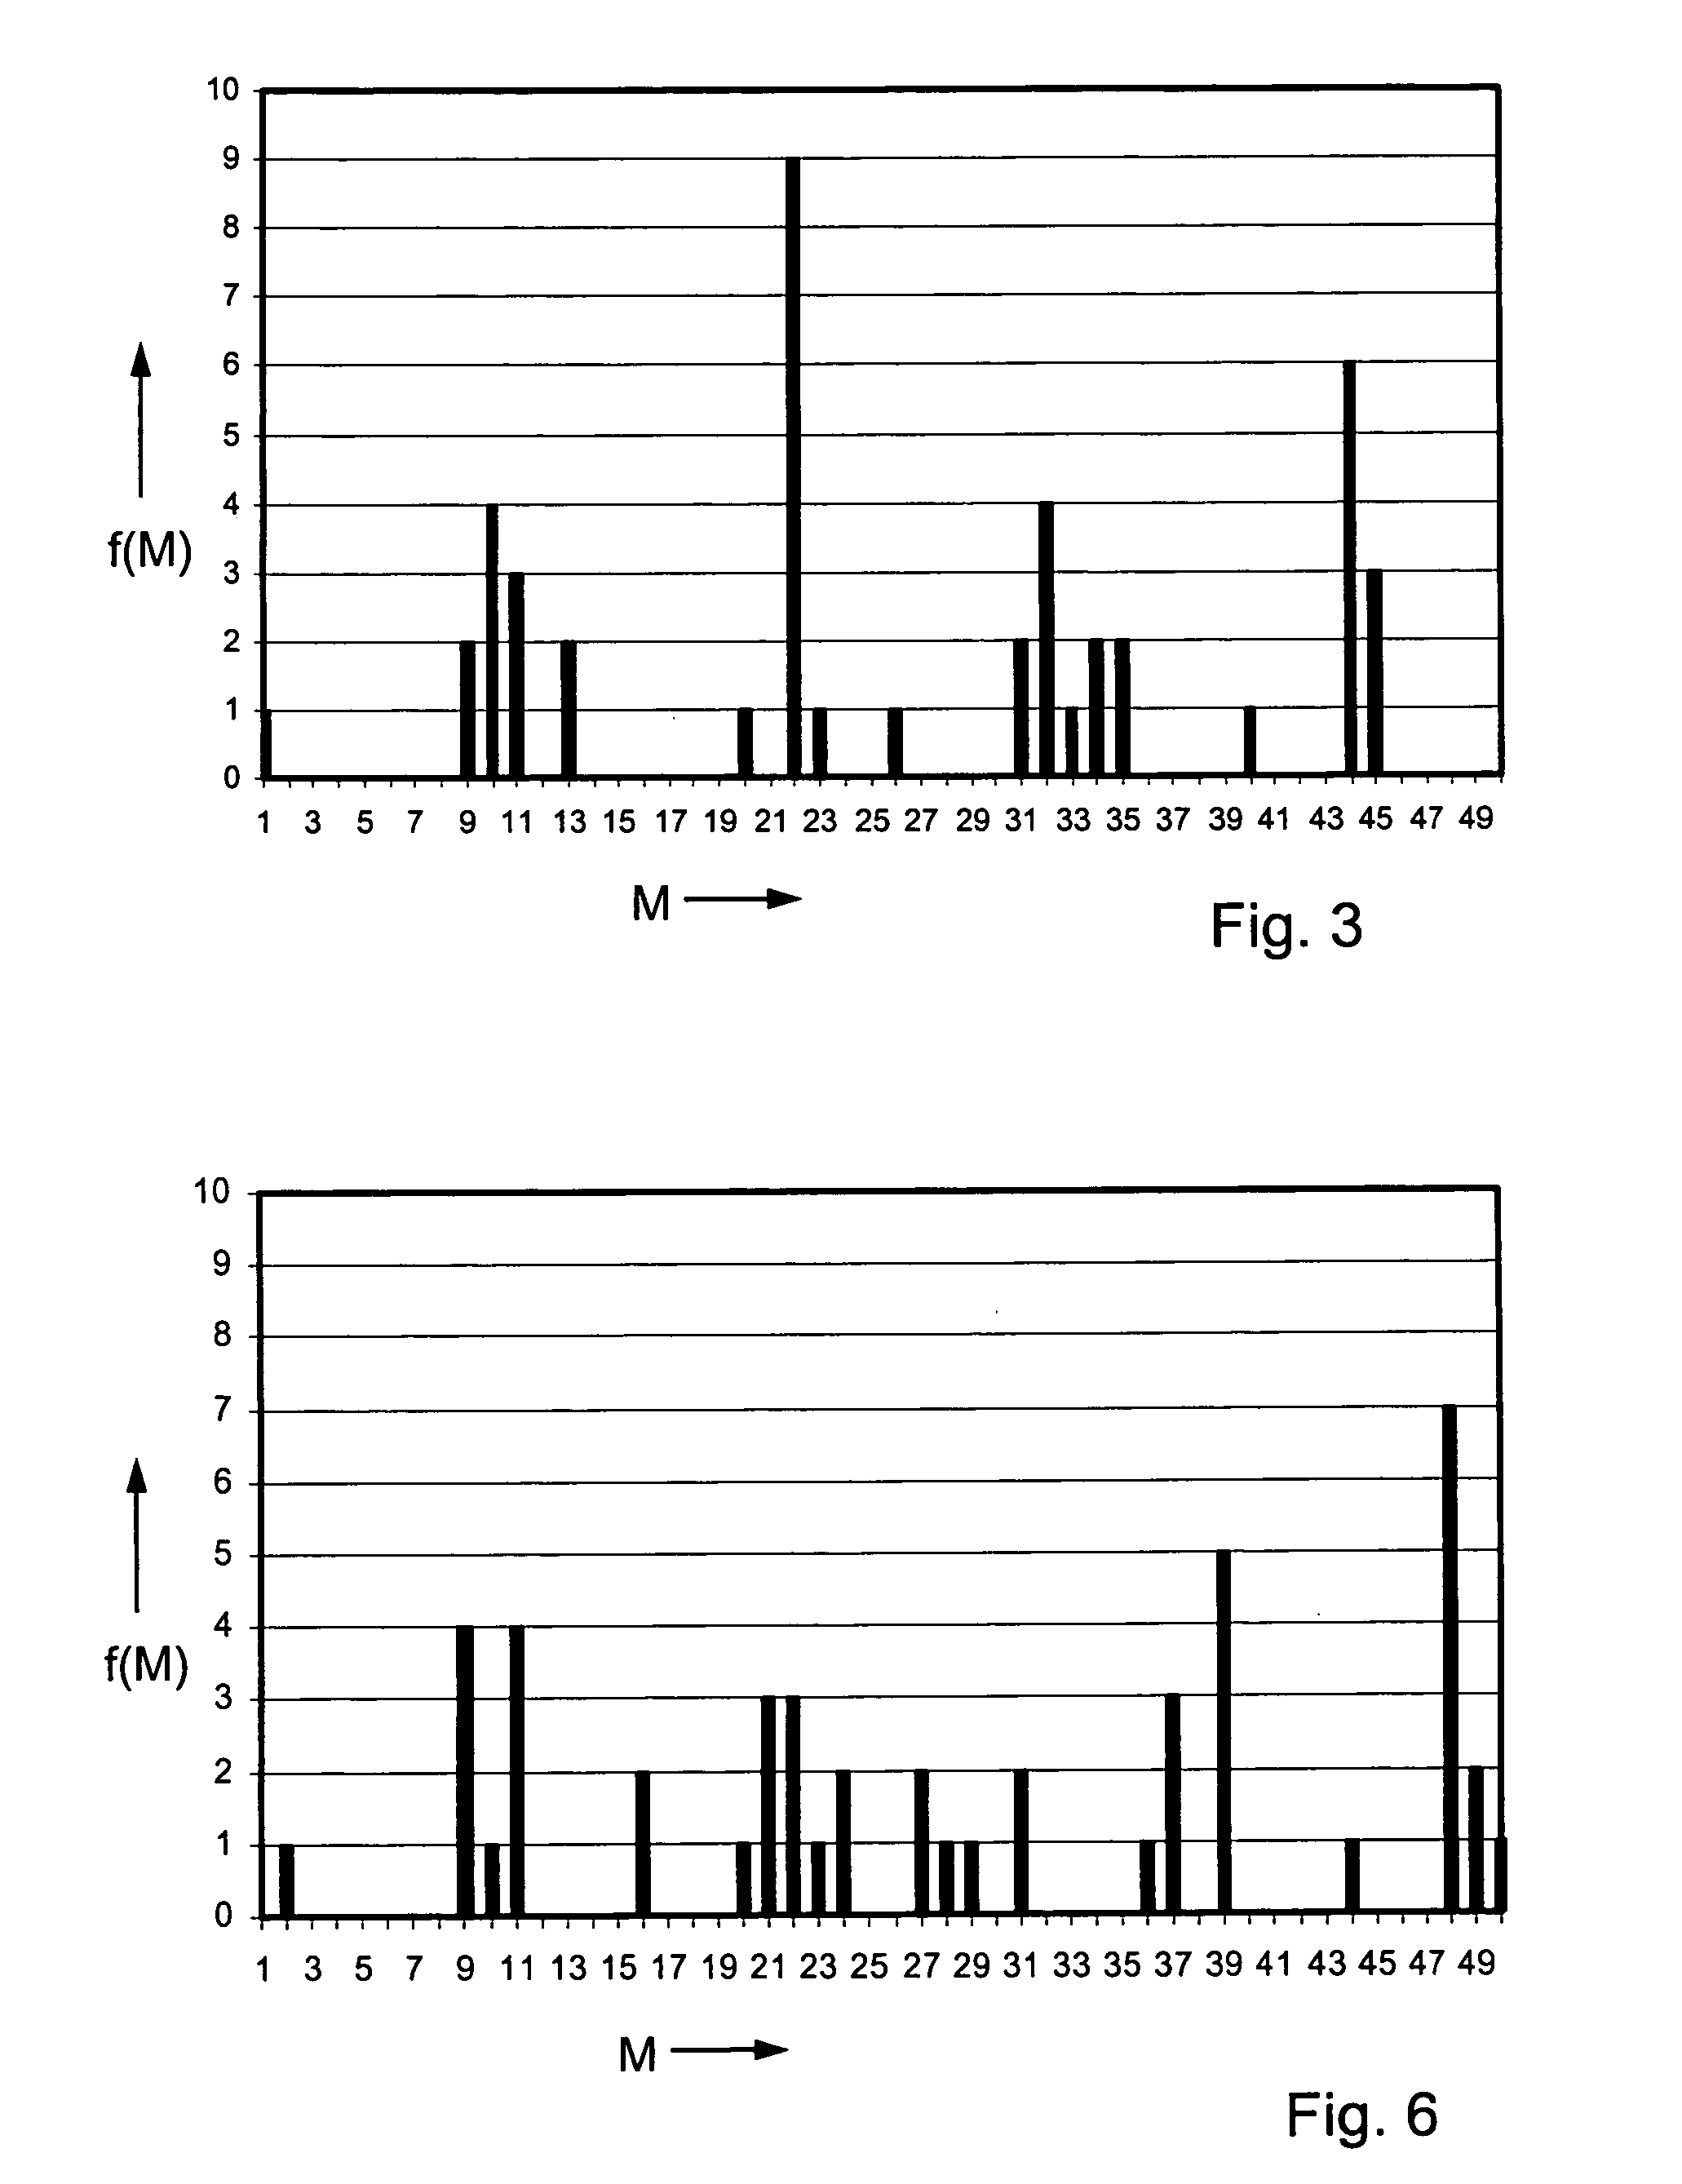
[0076] This example illustrates the application to an essentially pure sample of a species with unknown number of nuclei. FIG. 1 shows a 1H-NMR spectrum of a sample containing C21H22FN3O3S (see FIG. 2), henceforth denoted as “molecular species A”, and an admixture of tetramethyl silane (TMS), a well-known calibration substance for NMR spectroscopy. While it is known that molecular species A contains 22 protons, this information will not be used in the forthcoming procedure. The spectrum contains a plurality of signal peaks having chemical shifts δ in the range from about 0 to 11 ppm. While all these peaks have some multiplet structure, it is readily seen that the overall spectrum is made up of ten distinct signal peaks. In the present case, only signal peaks between 1 and 11 ppm are included for further analysis and define the set of included signal peaks P with members {P1, P2, . . . , P9}. The signal at 0 ppm is known to originate from TMS and will be used in Example 3 for calibra...

example 2

[0087] This example illustrates the application to a contaminated sample containing a predominant molecular species A but also a substantial contribution of an impurity. FIG. 4 shows the 1H-NMR spectrum of a second sample, containing molecular species A, the calibration compound TMS and an admixture of 10% of C13H14CIN3O3, henceforth denoted as “molecular species B”. For the purpose of this example, molecular species B is considered to be an unknown impurity in the sample.

[0088] Again, only signal peaks in the range of chemical shifts from 1 to 11 ppm are taken to build the set of included signal peaks, which is ordered according to peak position, thus forming the set Π of ordered signal peaks. After integration of each ordered signal peak the set of ordered integrals S={S1, S2, . . . , S13}, listed in Table 5 is obtained. In contrast to the Example 1, there are now 13 ordered integrals instead of 9; peak no. 14 originates from TMS and does not belong to the set of included signal ...

example 3

[0091] In this example, reference is made to the results of Example 1, which are used to carry out a quantitative determination of molecular species A in the sample at issue. Such determination relies on the fact that the calibration compound TMS contains 12 protons per molecule. Moreover, the method exploits the total or partial numbers of nuclei determined for species A and the relative magnitudes of NMR signal integrals found for A and TMS. The integrals mentioned below are all expressed in arbitrary units which, however, are the same arbitrary units for all the integrals from a given NMR spectrum.

[0092] A calibration integral YTMS is obtained by integrating peak no. 14, which originates from TMS, and dividing by the number of protons, which is known to be 12. In the present case, this leads to a calibration integral YTMS=15.23 / 12=1.27.

[0093] Moreover, a quantitation set is defined which consists of at least one of the ordered signal peaks of species A. A normalized sample inte...


PUM

PropertyMeasurementUnit
chemical shiftaaaaaaaaaa
chemical shifts δaaaaaaaaaa
chemical shiftsaaaaaaaaaa

Abstract

A method for estimating the number of nuclei of a preselected isotope in a molecular species starts with an NMR spectrum of a sample containing said molecular species as a predominant substance, said NMR spectrum comprising a plurality of signal peaks corresponding to said nuclei. By applying inclusion and ordering criteria one obtains a set of ordered signal peaks, the integration of which leads to a set of ordered integrals. Nested outer and inner iteration cycles are carried out, wherein for each cycle a trial number of nuclei is assigned to one of said ordered integrals whilst the other ordered integrals are rescaled accordingly and rounded to the next integer value, so as to yield a candidate total number of nuclei. An estimated total number of nuclei is obtained by taking the lowest one from the plurality of candidate total numbers of nuclei that have the highest number of occurrences.

Description

BACKGROUND OF THE INVENTION [0001] 1. Field of the Invention [0002] The present invention relates to a method for estimating the number of nuclei of a preselected isotope in a molecular species from an NMR spectrum, to a use of said method and to a computer program product for performing said method. [0003] 2. Description of the Related Art [0004] Nuclear magnetic resonance spectroscopy is a well-known technique that is extensively applied for qualitative and quantitative analysis of a large variety of samples. The technique generally involves recording a nuclear magnetic resonance spectrum, henceforth called NMR spectrum, under conditions that are selective for a preselected nuclear isotope with non-zero spin angular momentum, such as 1H, 13C or many others. In general, an NMR spectrum obtained from a sample containing a molecular species comprises a plurality of signal peaks resulting from the nuclei of the preselected isotope. Each signal peak corresponds to a particular resonanc...

Claims


Application Information

Patent Timeline
Patent Type & Authority Applications(United States)
IPC IPC(8): G01R33/32G01N24/08G01R33/46
CPCG01R33/4625G01N24/08
Inventor ROSS, ALFRED
Owner F HOFFMANN LA ROCHE & CO AG
Learn More