Method for virtual endoscopic visualization of the colon by shape-scale signatures, centerlining, and computerized detection of masses

a technology of shape-scale signatures and colon, applied in the field of system and method for computer-aided detection of three-dimensionally extended organ lesions, can solve the problems of long interpretation time, difficult to perceive the relevant lesions, and often affected accuracy of polyp detection, so as to enhance the endoscopic visualization of the colonic lumen, easy to perceive the relevant lesions, and additional time-consuming steps

Inactive Publication Date: 2005-07-14
UNIVERSITY OF CHICAGO
View PDF15 Cites 169 Cited by
  • Summary
  • Abstract
  • Description
  • Claims
  • Application Information

AI Technical Summary

Benefits of technology

[0103] The present invention provides a new method for enhancing the endoscopic visualization of the colonic lumen. Each unique structure of importance in the colon can be highlighted automatically by a unique color, which makes it easy to perceive the relevant lesions at one glance. The present invention provides a method for coloring of the colon, which is based on a detailed theoretical framework of shape-scale analysis and can be adjusted systematically to delineate specific types of lesions. After the shape-scale specification, the different colonic structures are marked automatically with a unique color to provide an immediate visual differentiation of the lesions. In particular, polyps and diverticula, the visual differentiation of which may require additional time-consuming steps in monochromatically volume-rendered images (FIG. 1), can be differentiated with little effort by use of our method because they are assigned different colors. Moreover, the input CTC data can be acquired in a conventional manner: there is no need for special protocols such as the use of a contrast agent or fecal-tagging agents. The computations required by the method can also be implemented efficiently. Furthermore, the method can be used in applications of virtual endoscopy other than mere visualization, such as computer-aided detection (CAD), in which the detection of lesions of interest is based upon their shape or scale characteristics. Such an application of our coloring scheme based on shape-scale signatures is described below.

Problems solved by technology

However, at present, the interpretation of CTC is a potentially slow process.
Despite recent advances in the development of 3-D imaging software and hardware, the current interpretation time of CTC is at least 5-20 minutes per case even for expert abdominal radiologists, and human factors such as fatigue may lengthen the interpretation time, particularly when a primary 2-D interpretation technique based on multiplanar reformatting is used [2].
The accuracy of the detection of polyps is often affected by image display methods because they change the visibility and conspicuity of the polyps.
Therefore, a suboptimal implementation of the display methods may increase the perceptual error even among experienced readers [10].
A careful, and therefore time-consuming, interpretation of the CTC data is required, because the visual color cues that normally exist in colonoscopy, such as mucosal color changes, are absent.
This may lengthen the interpretation time of CTC, because a radiologist may need to study the locations of diverticula to differentiate them from polyps, either by use of 3-D navigation or by adjustment of the shading and lighting effects.
Moreover, although recent advances in virtual endoscopy allow physicians to examine the colon in CTC interactively with endoluminal perspective views [66], complete navigation through the entire colon with virtual endoscopy can be tedious and time consuming because an inexperienced physician may lose track of the position and orientation of the colon.
Manual extraction of the seed points can be a tedious and inaccurate process when the location of the colon is obscured by a large amount of small bowel adhering to the colon, or when the colon is fragmented into multiple disconnected segments due to collapsed regions.
This makes methods that rely on a complete colonic pathway and complete colon segments identification work poorly unless some additional seed selection procedure is applied for finding the different parts of the colon.
The existing algorithms for the computation of a colon centerline are also time-consuming.
Because the Euclidean DT calculation itself is a time-consuming process, the actual centerline computation time is considerably longer.
Therefore, little effort has been made to develop CAD schemes for mass detection.
If masses are not detected by CAD, the radiologist needs to perform a careful and complete review of all CTC cases for the presence of masses, which may increase the reading time.
In addition, not all masses are easy to detect, depending on the readers' experience and on how rapidly the readers are reading the cases [55].
Because of the large size of masses as compared with polyps, the mass surface could be detected as several such FP polyp detections, thereby potentially confusing the radiologist when the case is reviewed with CAD.
Furthermore, the method added considerable computational overhead to the CAD scheme because it was implemented separately from the polyp detection scheme.

Method used


Image

  • Method for virtual endoscopic visualization of the colon by shape-scale signatures, centerlining, and computerized detection of masses
  • Method for virtual endoscopic visualization of the colon by shape-scale signatures, centerlining, and computerized detection of masses
  • Method for virtual endoscopic visualization of the colon by shape-scale signatures, centerlining, and computerized detection of masses

Examples


Embodiment Construction

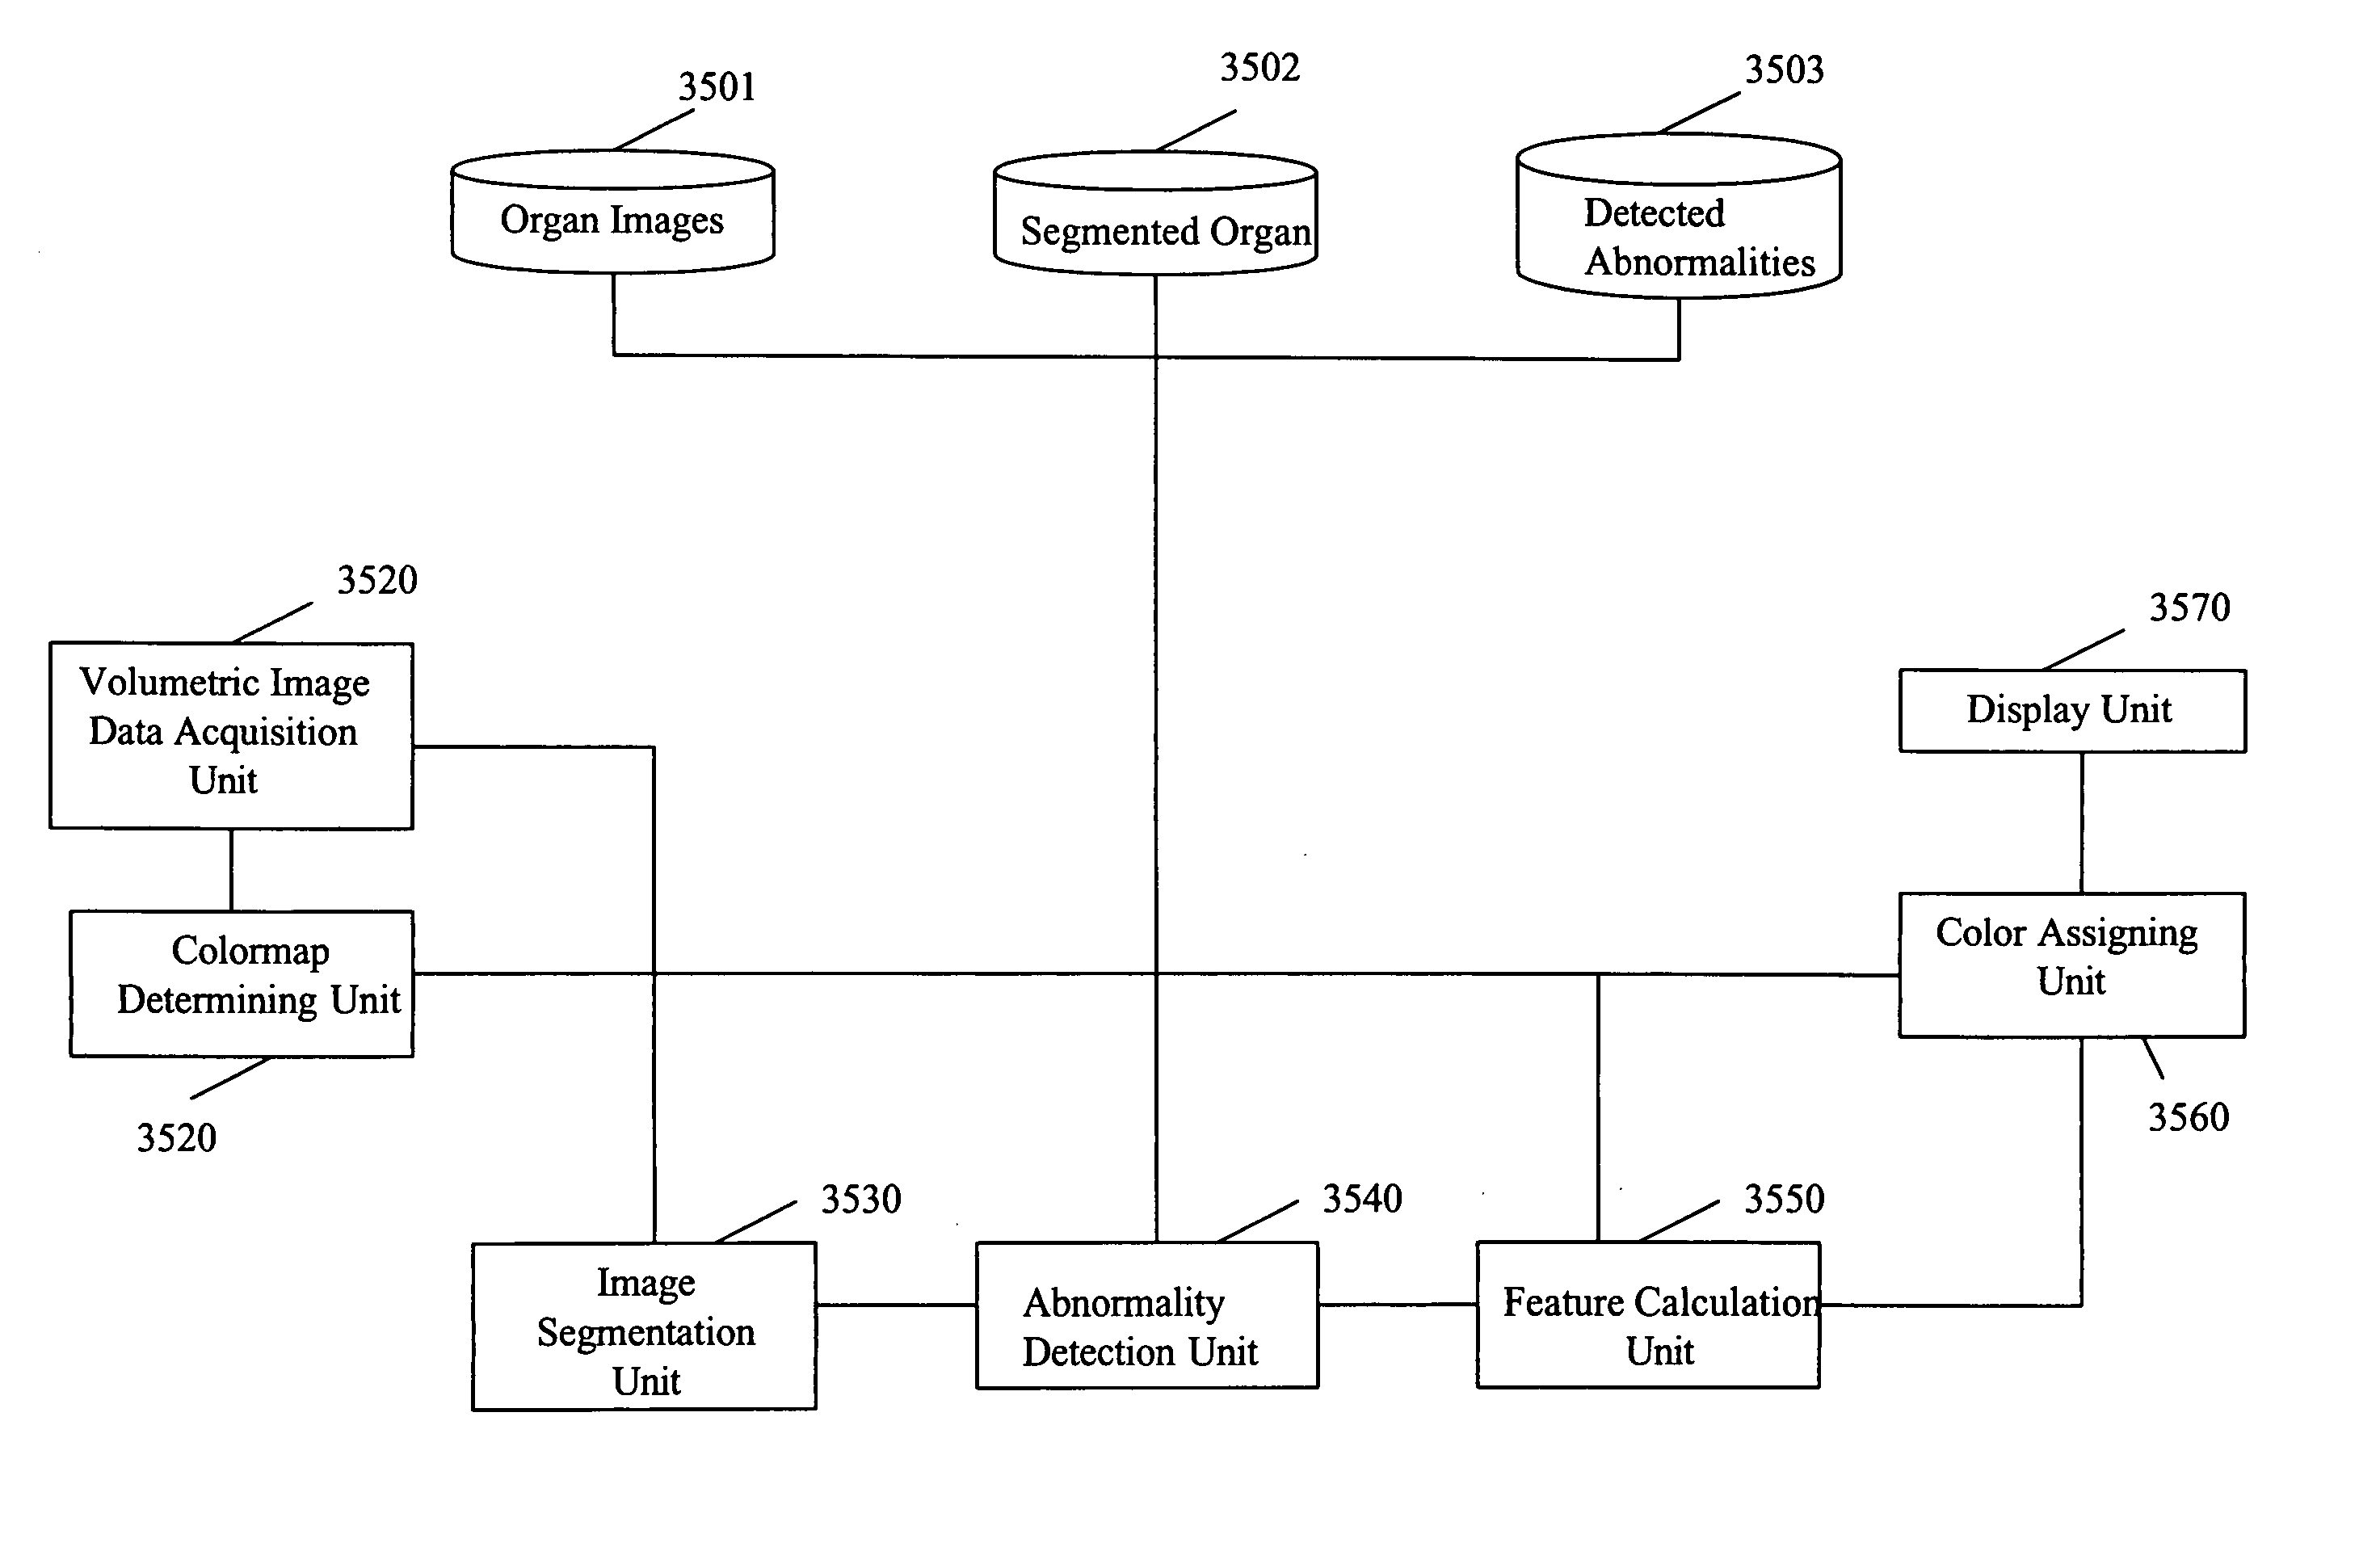
[0159] The description of the present invention includes a written description of: (1) visualization of the colon by shape-scale signatures; (2) computation of the colon centerline in CT colonography; and (3) detection of colorectal masses in CT colonography based on fuzzy merging and wall-thickening analysis.

I. Visualization of the Colon by Shape-Scale Signatures

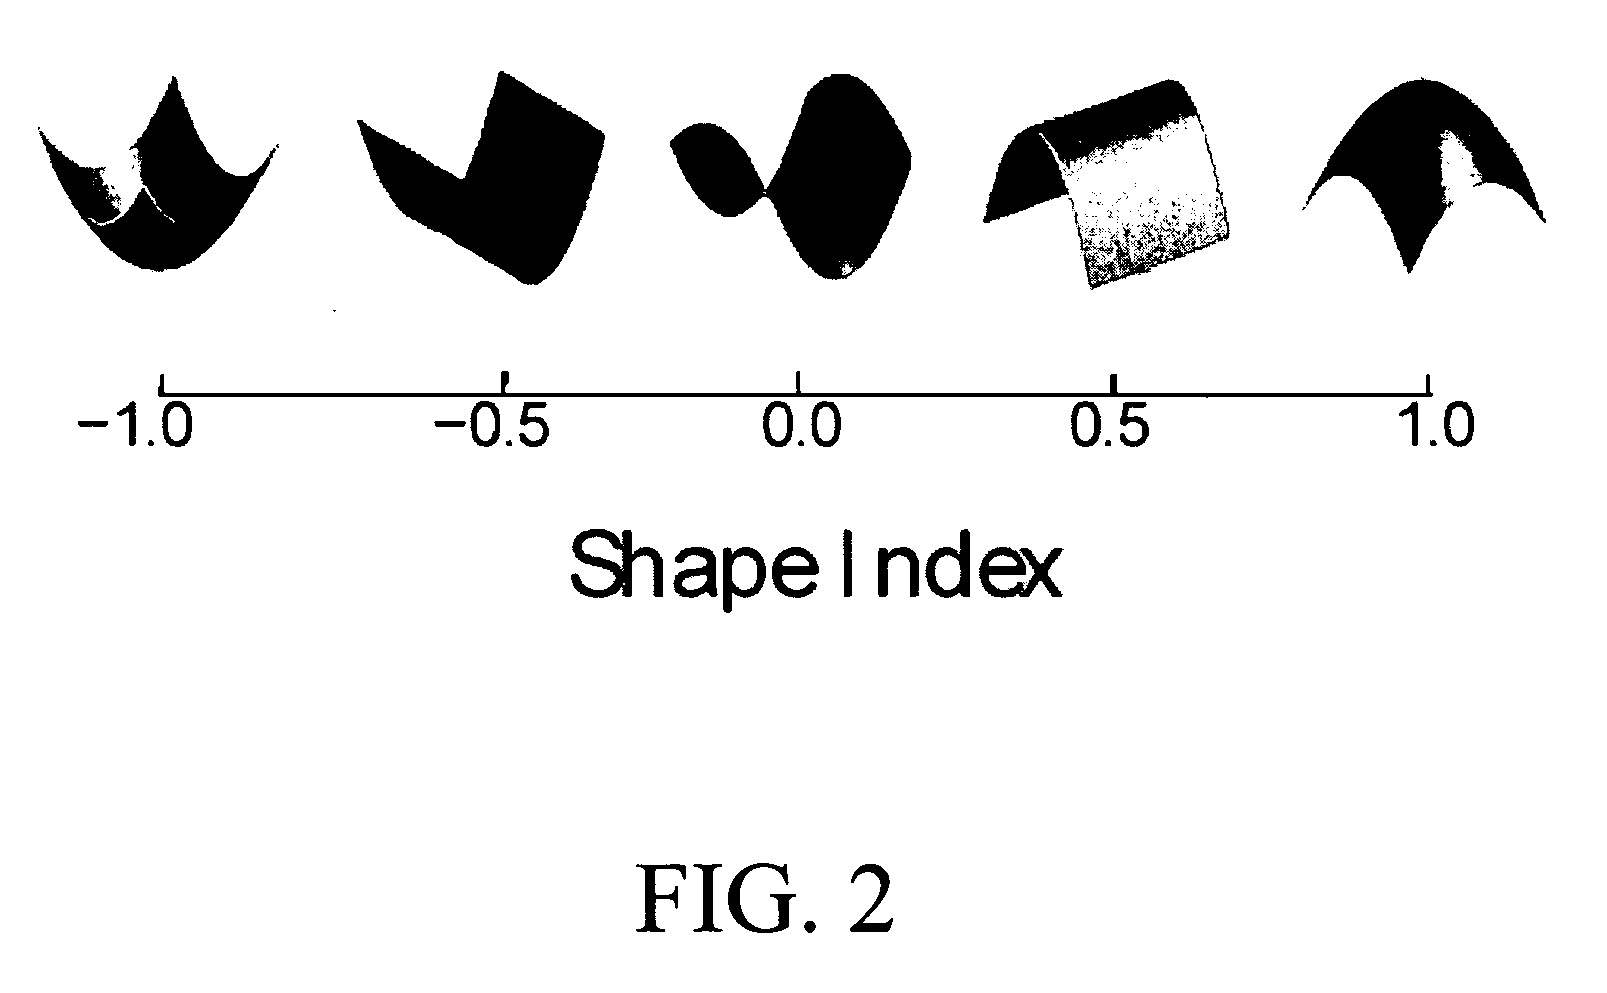
Local Shape Index and Curvedness

[0160] The local shape index and curvedness measure the shape characteristics of a local surface patch at a point, and they form the basis for defining the shape-scale spectrum which is described in the next section. Both quantities are defined based on the notion of the principal curvature. A traditional approach for computing the principal curvatures of 3-D data is to fit a parametric surface to the data and compute its differential characteristics in a local coordinate system [24]. However, parameterization of surfaces with a complex topology is complicated, and curvature information ...


PUM


Abstract

A visualization method and system for virtual endoscopic examination of CT colonographic data by use of shape-scale analysis. The method provides each colonic structure of interest with a unique color, thereby facilitating rapid diagnosis of the colon. Two shape features, called the local shape index and curvedness, are used for defining the shape-scale spectrum. The shape index and curvedness values within CT colonographic data are mapped to the shape-scale spectrum in which specific types of colonic structures are represented by unique characteristic signatures in the spectrum. The characteristic signatures of specific types of lesions can be determined by use of computer-simulated lesions or by use of clinical data sets subjected to a computerized detection scheme. The signatures are used for defining a 2-D color map by assignment of a unique color to each signature region.

Description

CROSS-REFERENCE TO RELATED APPLICATIONS [0001] The present application is related to U.S. Patent Application Ser. No. 60 / 514,599, filed Oct. 28, 2003, and U.S. patent application Ser. No. 10 / 270,674, filed Oct. 16, 2002, the contents of which are incorporated herein by reference.STATEMENT REGARDING FEDERALLY SPONSORED RESEARCH [0002] The present invention was made in part with U.S. Government support under USPHS Grant No. CA095279. The U.S. Government may have certain rights to this invention.BACKGROUND OF THE INVENTION [0003] Field of the Invention [0004] The present invention relates generally to systems and methods for the computer-aided detection of three-dimensionally extended organ lesions. The present invention also generally relates to automated techniques for the detection of abnormal anatomic regions, for example, as disclosed, in particular, in one or more of U.S. Pat. Nos. 4,907,156; 5,133,020; 5,832,103; and 6,138,045; all of which are incorporated herein by reference. ...

Claims


Application Information

Patent Timeline
Patent Type & Authority Applications(United States)
IPC IPC(8): A61B5/05G06K9/00G06K9/46G06K9/66G06T7/00G06T11/00
CPCG06T7/0012G06T15/08G06T2207/10081G06T2219/2012G06T2207/30068G06T19/20G06T2207/30028
Inventor YOSHIDA, HIROYUKINAPPI, JANNE J.FRIMMEL, HANSDACHMAN, ABRAHAM H.
Owner UNIVERSITY OF CHICAGO
Why Eureka
Try Eureka