
Optimized wavelength gap for improved StO2 measurement

a technology of sto2 measurement and optimized wavelength gap, which is applied in the field of optimized wavelength gap for improved sto2 measurement, can solve the problems of affecting the measurement affecting the accuracy of the desired analyte, and relatively few attempts to compare and/or cross-validate. to achieve the effect of degree of robustness

Inactive Publication Date: 2005-12-15
HUTCHINSON TECH
View PDF6 Cites 91 Cited by
  • Summary
  • Abstract
  • Description
  • Claims
  • Application Information

AI Technical Summary

Benefits of technology

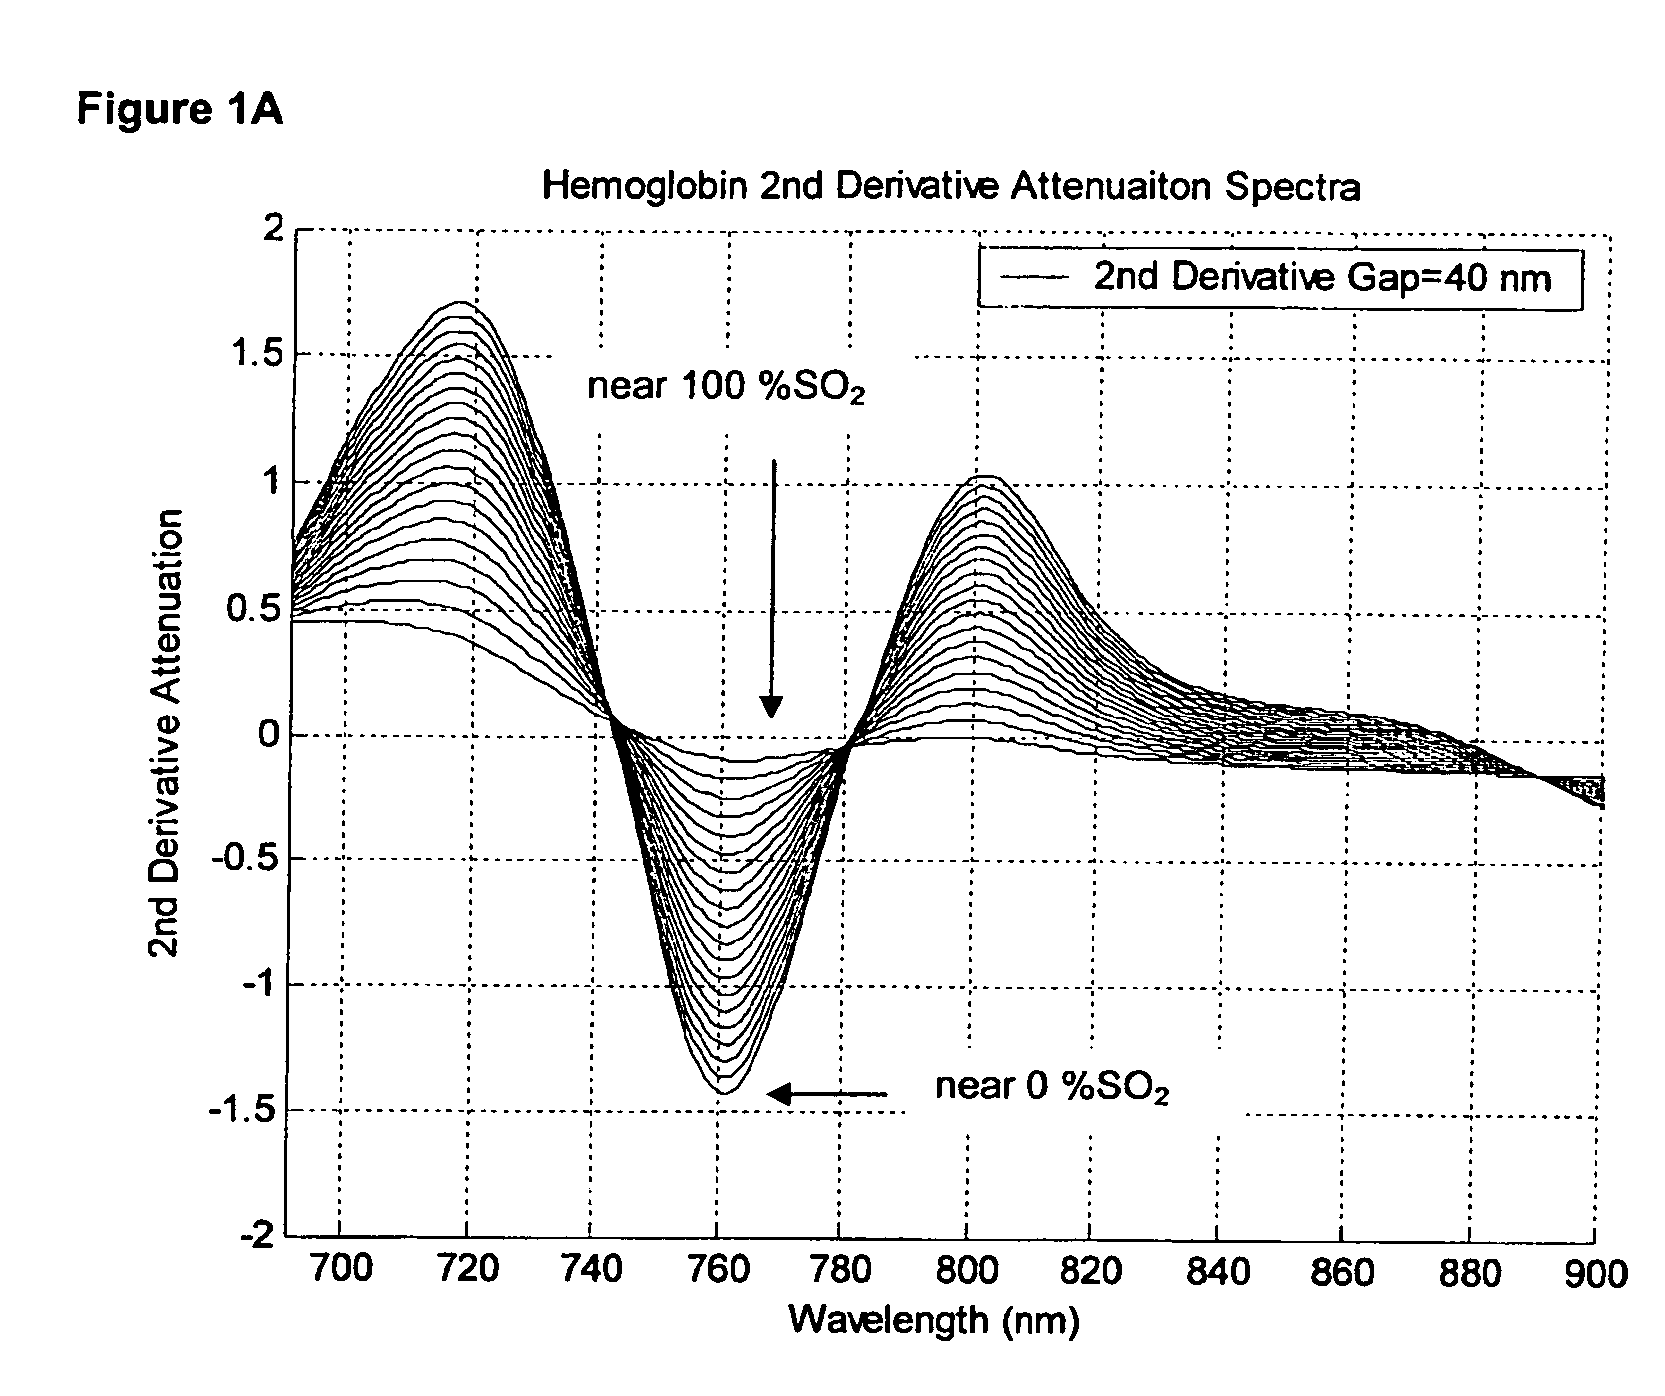
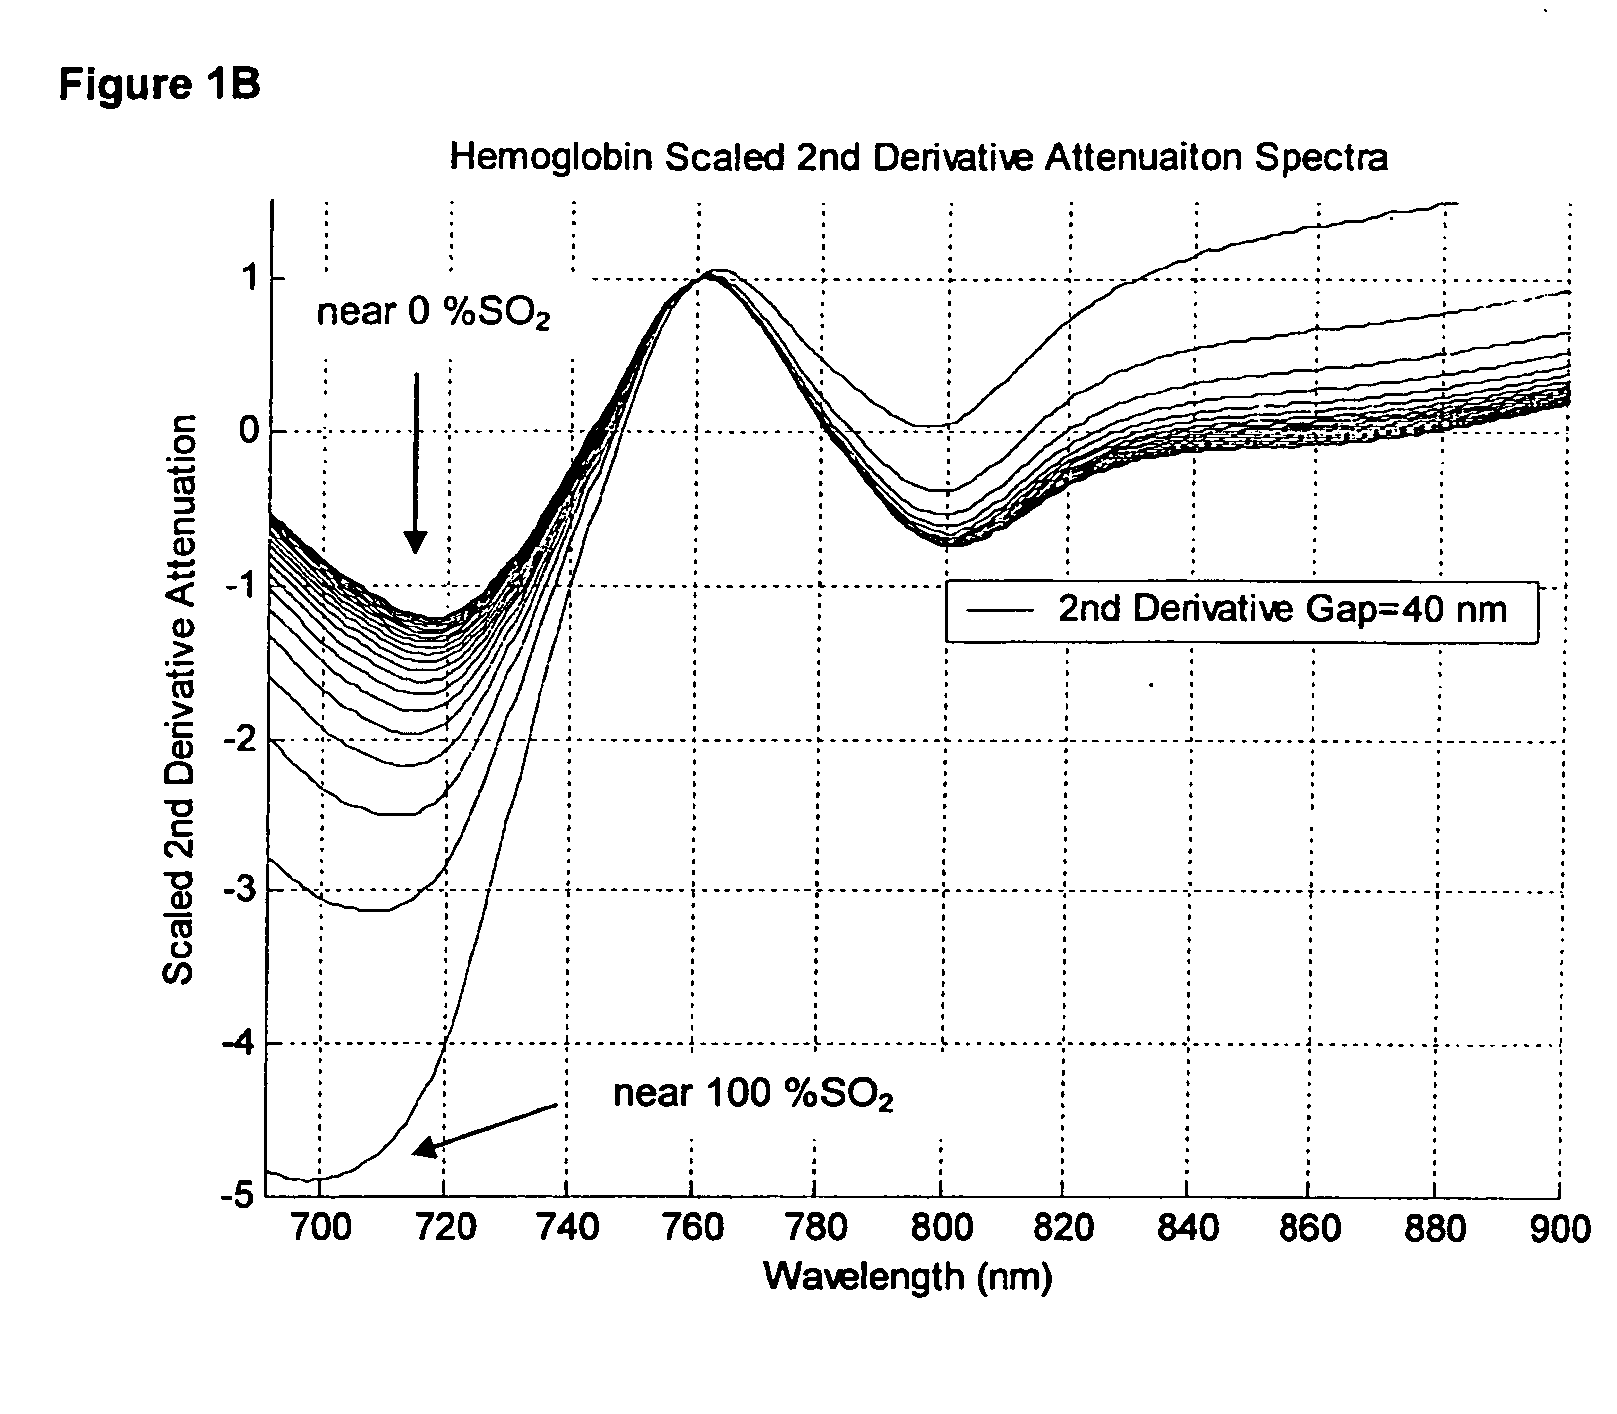
[0010] The disclosed method and apparatus provide improved tools for measurement of hemoglobin concentrations in tissue using NIRS. The invention relates specifically to an algorithm method and apparatus which relates a scaled (ratioed) 2nd derivative attenuation measurement to in vivo hemoglobin oxygen saturation (% StO2). A 2nd derivative transformation of tissue attenuation measurements (2nd derivative spectroscopy) removes both baseline offset and linear slope from optical density attenuation spectra and provides a degree of robustness to the effects of wavelength dependent scattering. Another benefit of 2nd derivative spectroscopy is that tissue absorbers having near constant or linear absorption (over a chosen wavelength region) do not interfere with measurement of a desired analyte chromophore which exhibits significant non-linear wavelength dependent absorption.
[0011] The disclosed method describes how to optimize the wavelength gap used for calculating a 2nd derivative tissue attenuation measurement in order to reduce and / or eliminate the spectral influence of a confounding (interfering) chromophore on a desired analyte chromophore measurement. The method specifically relates to an analyte chromophore measurement that is correlated to the ratio of two distinct 2nd derivative attenuation measurements. The gap interval may be uniform or non-uniform (transformed) and can be similar or different between the chosen numerator and denominator 2nd derivative attenuation wavelengths. A common result of the gap interval optimization is that the spectral features of the interfering chromophore nearly equally affect the two 2nd derivative attenuation measurements and do not significantly affect the scaled (ratioed) 2nd derivative attenuation measurement which directly correlates to the measured analyte chromophore.

Problems solved by technology

Such methods (predominantly used to resolve problems in adult brain measurements) have met with only limited success.
While all these methods yield apparent values for tissue chromophore concentrations, there have been relatively few attempts to compare and / or cross-validate, one against the other.
Tissue absorbers which exhibit non-linear absorption and overlap the measured wavelength region can confound measurement accuracy for the desired analyte.

Method used


Image

  • Optimized wavelength gap for improved StO2 measurement
  • Optimized wavelength gap for improved StO2 measurement
  • Optimized wavelength gap for improved StO2 measurement

Examples


Embodiment Construction

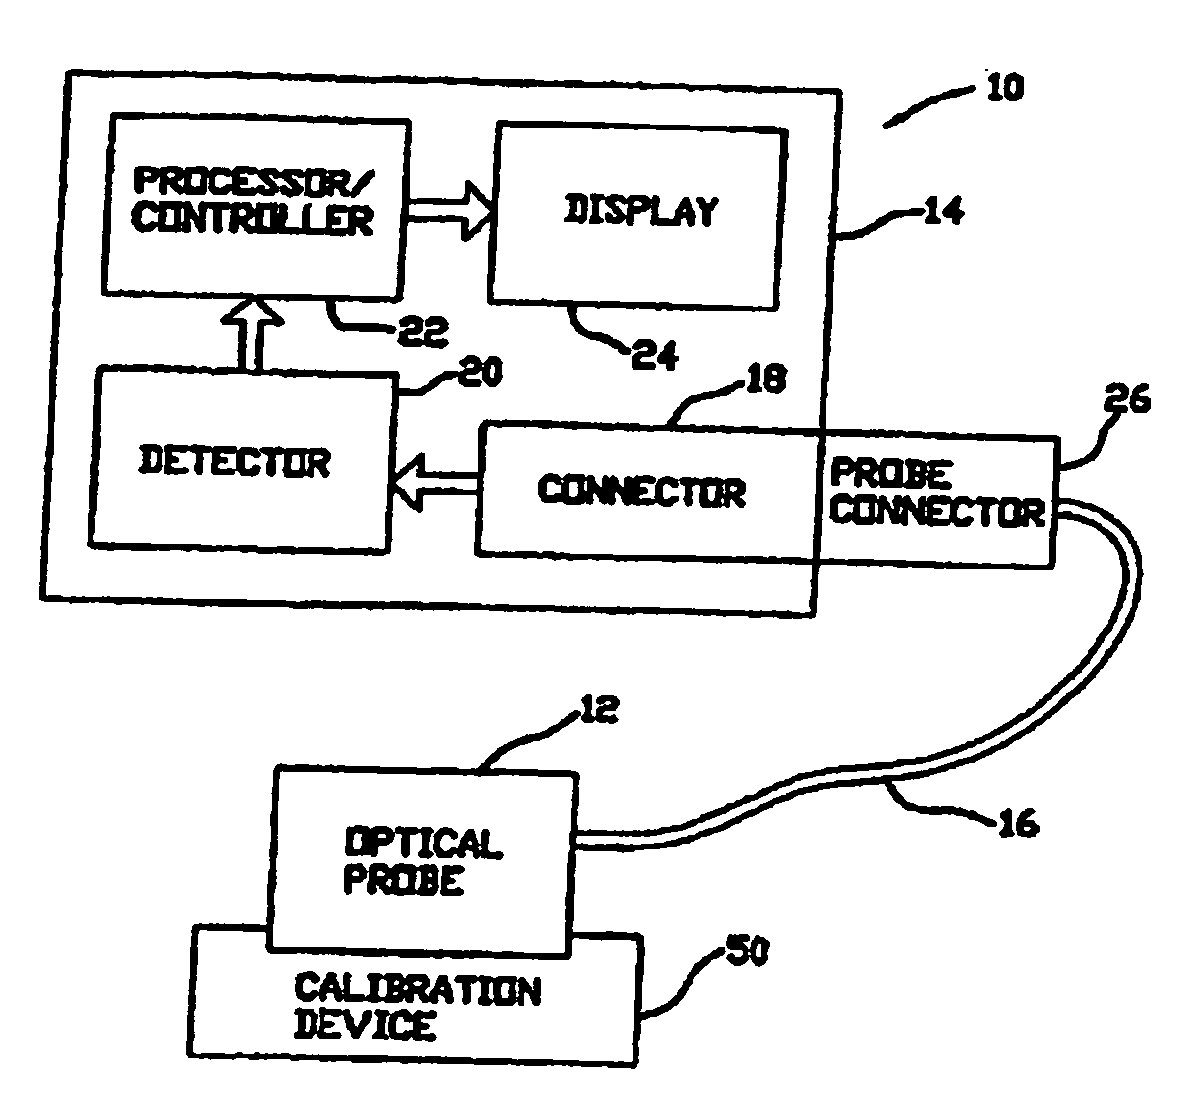
[0031] Referring now to FIGS. 9 and 10, thereshown are a basic structure for a spectrometer 10. The spectrometer can include an optical probe 12 and a base unit 14. The optical probe can include light sources or light pathways for placing light on tissue under study and collecting light from the tissue under study. The light pathways can be carried in cable 16. A probe connector 26 connects the optical probe to the base unit 14. Base unit 14 includes a connector 18, a detector 20, a processor / controller 22 and a display 24. The connector 18 is for connecting the base unit to the optical connector. Detector 20 measures light collected from the tissue at specific wavelength ranges and produces one or more output signals that are proportional to the sensed light. The processor controller then uses the equations noted above to calculate a final value for StO2 from the output signal(s). The display 24 receives and displays the StO2 value. Calibration device 50 can be a synthetic target t...


PUM


Abstract

A method and system for producing improved more accurate measurements of oxyhemoglobin levels in tissue when measured using near infrared spectroscopy (NIRS). Light sources and processing methods are selected to such that the effects of a confounding chromophore in the tissue under study are minimized.

Description

CROSS-REFERENCE TO RELATED APPLICATIONS [0001] This application claims priority to U.S. Provisional Patent Application No. 60 / 572,220, filed May 18, 2004, which is included herein by reference.BACKGROUND OF THE INVENTION [0002] A goal of in vivo Near Infrared Reflectance Spectroscopy [“NIRS”] is to provide a reliable and accurate noninvasive quantification of oxyhemoglobin concentration [HbO2], deoxyhemoglobin concentration [Hb], total hemoglobin concentration [HbO2+Hb] and / or tissue hemoglobin oxygen saturation [HbO2] / [HbO2+Hb] in a tissue environment where measured light photons, 650 nm to 1000 nm for example, are numerously scattered along their propagation paths. In vivo NIRS instruments use reflectance mode probes to measure scattered light remitted at some distance from where the light is emitted into the tissue. This probe spacing distance weights the measured attenuated light signal to hemoglobin absorption occurring below the tissue surface. [0003] Continuous wave (CW) spec...

Claims


Application Information

Patent Timeline
IPC IPC(8): A61B5/00G01N21/31
CPCA61B5/14551A61B5/7239A61B2560/0233
Inventor MYERS, DEAN E.
Owner HUTCHINSON TECH
Learn More