
Image analysis

a digital image and image technology, applied in image analysis, image enhancement, instruments, etc., can solve the problems of difficult to obtain the qualification to perform such examinations, frequent review, and exacerbated by the complexity of some samples, and achieve cost-effective effects

Active Publication Date: 2006-04-20
QINETIQ LTD
View PDF19 Cites 60 Cited by
  • Summary
  • Abstract
  • Description
  • Claims
  • Application Information

AI Technical Summary

Benefits of technology

The patent text describes an automated method for analyzing images of breast cancer tissue to detect and grade the cancer. This method uses a computer program to identify and evaluate cells in the image based on their size and shape. This approach is faster, more objective, and less subjective than the current manual process, which can lead to errors and delays in diagnosis. The invention aims to improve the accuracy and effectiveness of breast cancer screening and diagnosis, potentially saving lives and avoiding unnecessary treatment.

Problems solved by technology

This is, however, a time consuming, labour intensive and expensive process.
Qualification to perform such examination is not easy to obtain and requires frequent review.
This problem is exacerbated by the complexity of some samples, especially in marginal cases where there may not be a definitive conclusion.
If sufficient trained staff are not available this impacts upon pressures to complete the analysis, potentially leading to erroneous assessments and delays in diagnosis.
These problems mean that there are practical limitations on the extent and effectiveness of screening for breast cancer with the consequence that some women are not being correctly identified as having the disease and, on some occasions, this failure may result in premature death.
Conversely, others are being incorrectly diagnosed with breast cancer and therefore undergoing potentially traumatic treatment unnecessarily.

Method used

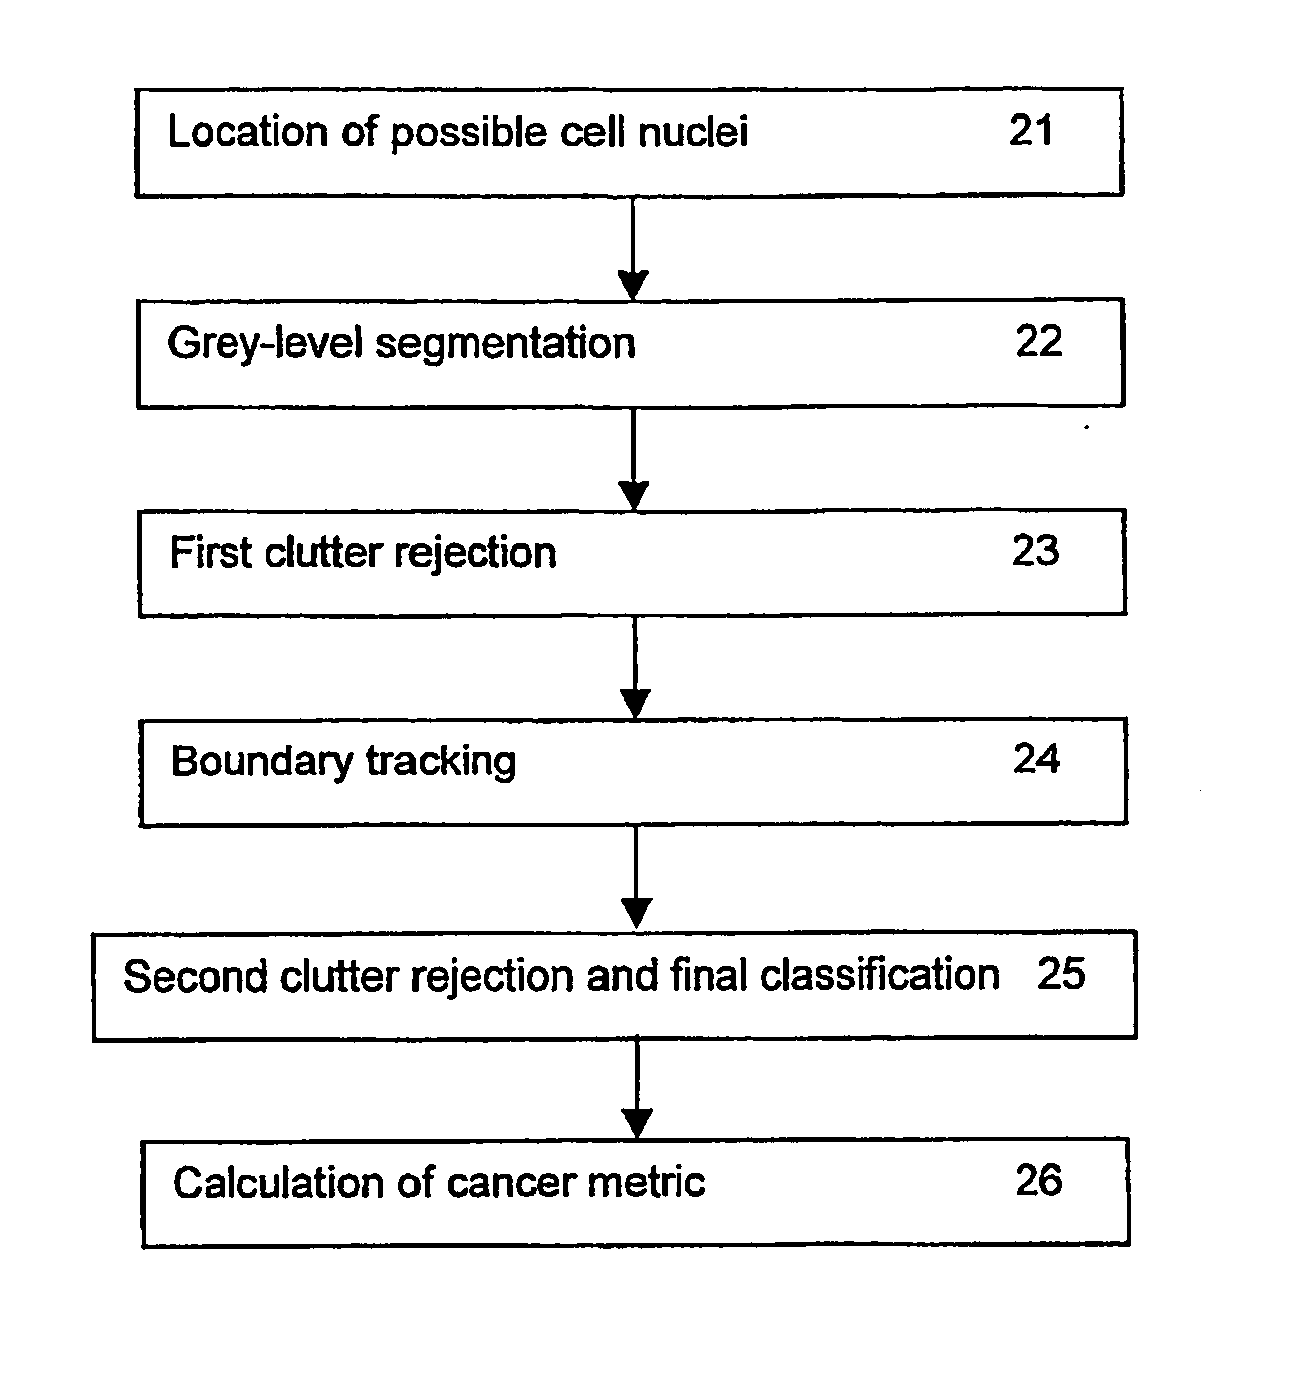
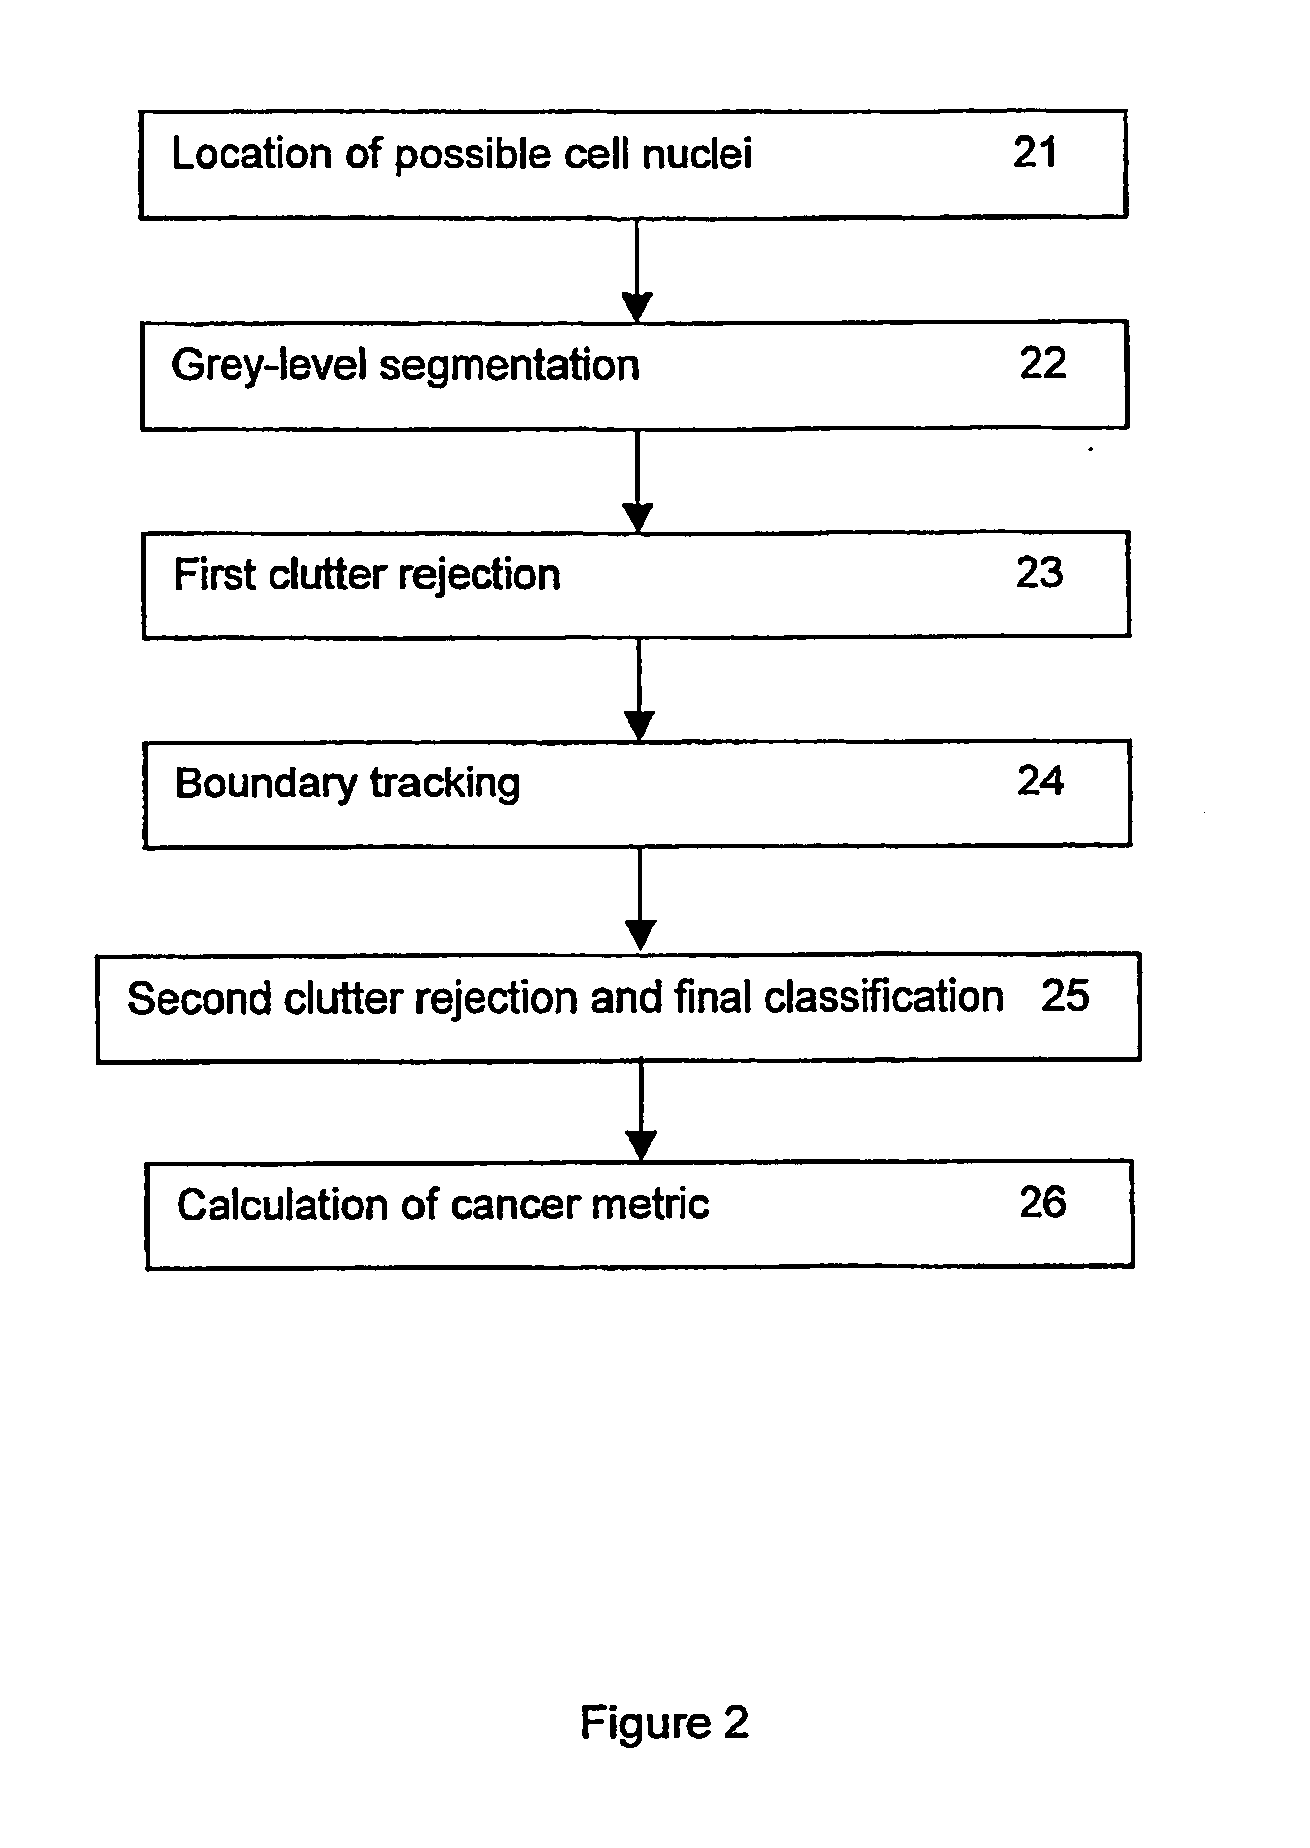

Image

  • Image analysis
  • Image analysis
  • Image analysis

Examples


example results

[0177]FIG. 4 is a visualisation of the boundary extraction process performed in stage 32 for a typical object. FIG. 4(a) is a reproduction of a small region taken from an actual image which includes an object 41 representing an epithelial cell nucleus. FIG. 4(b) depicts successive stages in the wave propagation as described in Steps 1 to 4 above for this object, starting from an inner circle 42 centred on the position 43 identified for the object in stage 31 and evolving outwards in successively deformed curves. Curve 44 is the one chosen in Step 5 above and FIG. 4(c) depicts the boundary 45 as finally derived after refinement of this curve in Step 6 above. FIGS. 4(b) and 4(c) have been generated from data in the image reproduced in FIG. 4(a) using an actual implementation of the algorithm described herein and FIG. 4(c) shows how well the boundary 45 thus derived matches the actual boundary of the object 41 in FIG. 4(a).

33 Second Clutter Rejection and Final Classification

[0178] T...


PUM


Abstract

A method for the automated analysis of digital images, particularly for the purpose of assessing nuclear pleomorphism from images of histological slides for prognostication of breast cancer. The method includes the steps of identifying the locations of objects within the image which have intensity and size characteristics consistent with epithelial cell nuclei and deriving boundaries for those objects. Statistics concerning at least the shapes of the derived boundaries are calculated and clutter is rejected on the basis of those statistics and / or they are used to assign probabilities that the respective objects are epithelial cell nuclei, and a measure of the variability of at least the areas enclosed by such boundaries is then calculated. In one embodiment the boundaries are derived by seeking closed contours consisting of points of the same grey-level within regions centred on the locations of such objects. Another embodiment involves the deformation of a closed loop starting within the respective object, moving outward in stages in accordance with grey-level gradients around the loop, and selecting as the best fit to the real boundary the deformed loop which satisfies specified edge metrics.

Description

FIELD OF THE INVENTION [0001] The present invention relates to the automated analysis of digital images. It is more particularly concerned with the automated assessment of nuclear pleomorphism from digital images of histological or cytology specimens and most particularly for the purpose of assessing the presence and severity of cancer in breast tissue, and it is in this context that the invention is principally described herein. The invention may, however, also find application in the assessment of other forms of cancer, such as colon and cervical cancer, and in the analysis of various other kinds of structure presenting image components which are amenable to identification in a similar way, that is to say images containing objects with relatively smooth boundaries and whose shape is generally convex, embedded in cluttered backgrounds. BACKGROUND AND SUMMARY OF THE INVENTION [0002] Many thousands of women die needlessly each year from breast cancer, a cancer from which there is the...

Claims


Application Information

Patent Timeline
Patent Type & Authority Applications(United States)
IPC IPC(8): G06K9/00G06K9/62G06K9/40
CPCG06K9/00127G06T7/0012G06T2207/10056G06T2207/30024G06T7/12G06T7/62G06V20/69
Inventor WATSON, SHARON KATRINAWATSON, GRAHAM HOWARD
Owner QINETIQ LTD
Learn More