Method for Raman computer tomography imaging spectroscopy

a computer tomography and raman light technology, applied in the field of computed tomography imaging raman light detection, can solve the problems of limited time elapsed, inability to detect raman light, and inability to use chemical imaging to monitor dynamic changes in samples,

Inactive Publication Date: 2006-07-20
CHEMIMAGE
View PDF14 Cites 17 Cited by
  • Summary
  • Abstract
  • Description
  • Claims
  • Application Information

AI Technical Summary

Benefits of technology

[0007] The present invention provides for a method for measuring spatial and spectral information from a sample using computed tomography imaging spectroscopy. An area of the sample is illuminated using an illumination source having substantially monochromatic light. Raman scattered light is directed from said illuminated area of said sample onto a two dimensional grating disperser. Light output, from the two dimensional grating disperser, is directed onto a detector that detects a dispersed image. The dispersed image from the detector is applied to a processing algorithm that generates a plurality of spatially accurate, wavelength resolved images of the sample.
[0008] The present invention also provides for a method for measuring spatial and spectral information from a sample over a period of time using computer tomography imaging spectroscopy. During a first time period, an area of the sample is illuminated using an illumination source having substantially monochromatic light. Raman scattered light is directed from said illuminated area of said sample onto a two dimensional grating disperser. Light output, from the two dimensional grating disperser, is directed onto a detector that detects a dispersed image. The dispersed image from the detector is applied to a processing algorithm that generates a plurality of spatially accurate, wavelength resolved images representative of the sample at the first time. During a second time period, these steps are repeated a second time to generate a second plurality of spatially accurate, wavelength resolved images representative of the sample at the second time, the second time being later than the first time. One or more dynamic changes in the sample are detected between the first and second times by comparing the first plurality of spatially accurate, wavelength resolved images and the second plurality of spatially accurate, wavelength resolved images.

Problems solved by technology

Furthermore, monitoring of dynamic changes in a sample, using chemical imaging, has also been limited in that significant time may elapse between the collection of an image at a first wavelength and collection of an image at a second wavelength.
However, it is believed that previous CTIS systems have not been developed or applied to detect Raman light.

Method used


Image

  • Method for Raman computer tomography imaging spectroscopy
  • Method for Raman computer tomography imaging spectroscopy
  • Method for Raman computer tomography imaging spectroscopy

Examples


Embodiment Construction

[0016] Reference will now be made in detail to the preferred embodiments of the present invention, examples of which are illustrated in the accompanying drawings. Wherever possible, the same reference numbers will be used throughout the drawings to refer to the same or like parts.

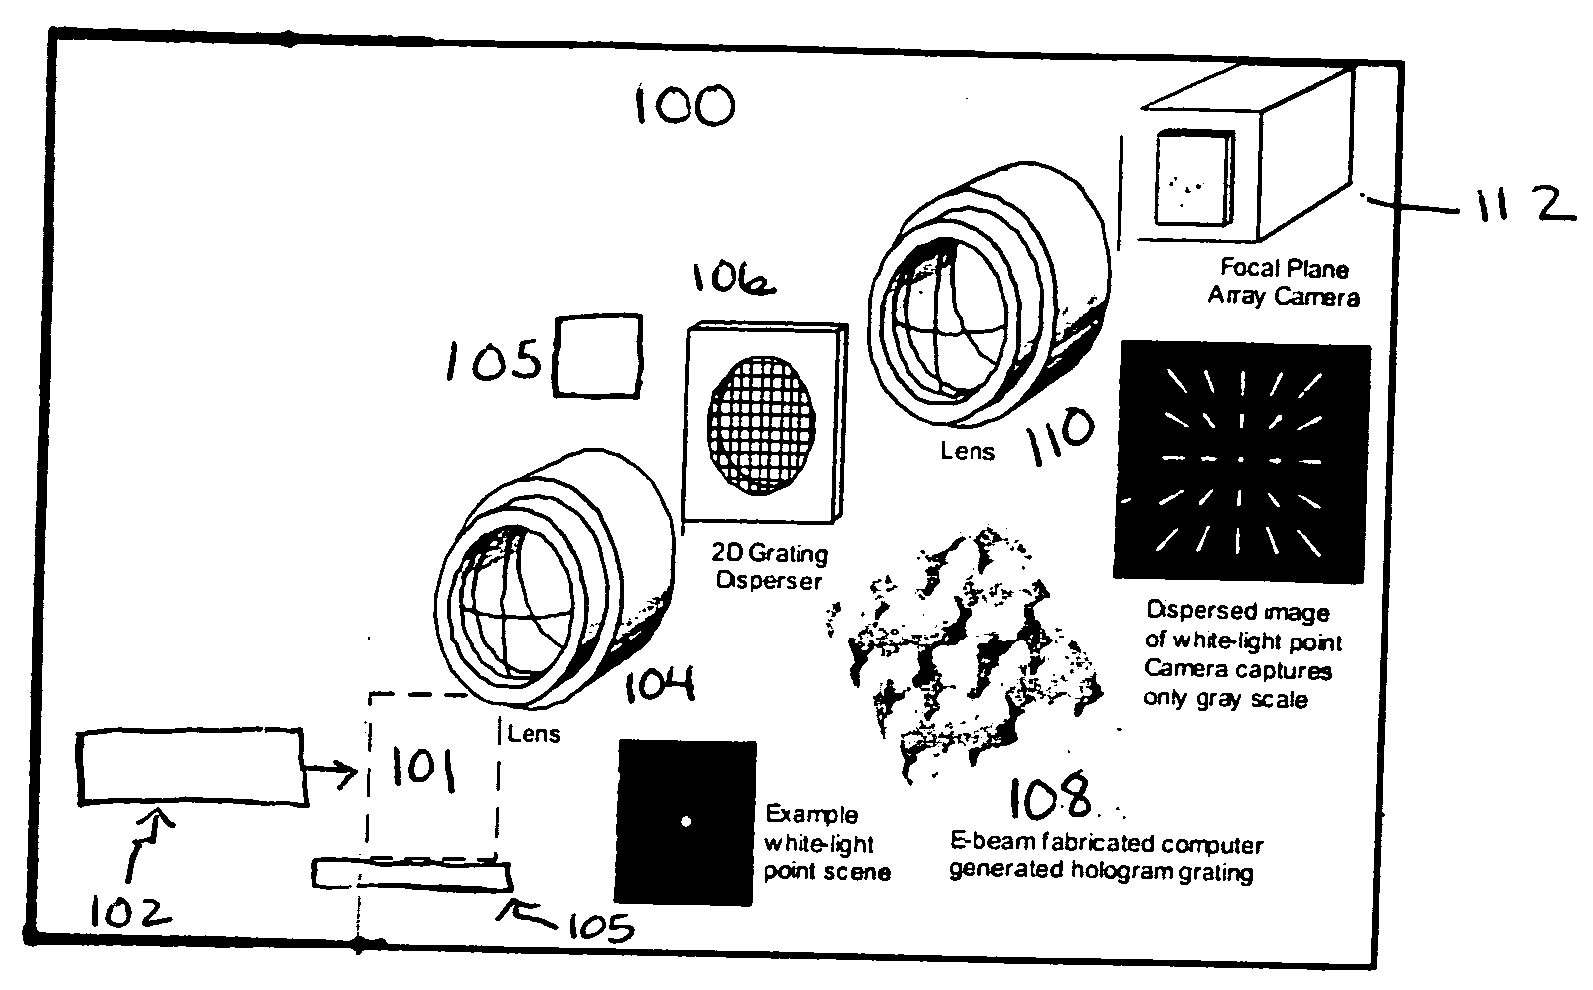
[0017]FIG. 1 illustrates system 100 that may be used to carry out the method of the present invention. Sample 101 is positioned on substrate 105. Substrate 105 can be any conventional microscopic slide or other means for receiving and optionally securing sample 100. Light source 102 is positioned to provide incident light to sample 100. Light source 102 provides substantially monochromatic light. The source 102 of substantially monochromatic light is preferably a laser source, such as a diode pumped solid state laser (e.g., a Nd:YAG or Nd:YVO4 laser) or Ar ion laser capable of delivering monochromatic light at a wavelength of 532 nanometers. In another embodiment, the substantially monochromatic light sour...


PUM

PropertyMeasurementUnit
Raman Shiftaaaaaaaaaa
wavelengthaaaaaaaaaa

Abstract

A method for measuring spatial and spectral information from a sample using computed tomography imaging spectroscopy. An area of the sample is illuminated using an illumination source having substantially monochromatic light. Raman scattered light is directed from said illuminated area of said sample onto a two dimensional grating disperser. Light output, from the two dimensional grating disperser, is directed onto a detector that detects a dispersed image. The dispersed image from the detector is applied to a processing algorithm that generates a plurality of spatially accurate, wavelength resolved images of the sample.

Description

[0001] This application claims the benefit of U.S. Patent Application No. 60 / 645,127 filed Jan. 20, 2005 entitled Raman CTIS System.FIELD OF THE INVENTION [0002] The present invention provides for a method for measuring spatial and spectral information from a sample using Computed Tomography Imaging Raman Spectroscopy. BACKGROUND OF THE INVENTION [0003] When light interacts with matter, a portion of the incident photons are scattered in all directions. A small fraction of the scattered radiation differs in frequency (wavelength) from the illuminating light. If the incident light is monochromatic (single wavelength) as it is when using a laser source or other sufficiently monochromatic light source, the scattered light which differs in frequency may be distinguished from the light scattered which has the same frequency as the incident light. Furthermore, frequencies of the scattered light are unique to the molecular or crystal species present. This phenomenon is known as the Raman ef...

Claims


Application Information

Patent Timeline
Patent Type & Authority Applications(United States)
IPC IPC(8): G01J3/44G01N21/65
CPCG01J3/2823G01J3/44G01N21/65G01N2021/1787
Inventor MAIER, JOHN S.TREADO, PATRICK J.
Owner CHEMIMAGE
Why Eureka
Try Eureka