Optical transillumination and reflectance spectroscopy to quantify disease risk

a technology of reflectance spectroscopy and optical transillumination, which is applied in the field of optical transillumination/reflectance spectroscopy, can solve the problems of high cost of current disease screening techniques, redirected investigators' focus, and late introduction of breast cancer risk assessment and risk assessment. to achieve the effect of increasing the individual risk of this diseas

Inactive Publication Date: 2006-08-03
UNIV HEALTH NETWORK
View PDF1 Cites 34 Cited by
  • Summary
  • Abstract
  • Description
  • Claims
  • Application Information

AI Technical Summary

Benefits of technology

[0009] The present invention uses spectroscopic tissue volume measurements using non-ionizing radiation to detect pre-disease transformations in the tissue, which increase the individuals risk for this disease.

Problems solved by technology

As early cancer or disease detection and diagnosis make further inroads into clinical practice, the high cost of current disease screening techniques redirected the focus of the investigators towards methods capable of quantifying the risk towards these diseases as a practical pre-screening tool.
One of the major disadvantages of the current standard for Breast Cancer Risk assessment is the use of ionizing radiation.
This results in the late introduction of this diagnostic modality during the life of a woman, due to the inherent risk when using ionizing radiation in a diagnostic modality.
However, the late onset in using these risk assessment modality will reduce the available time frame for any intervention aimed at reducing the disease risk.
These spectroscopic applications, including an article by Egan and Dolen (8) are rather intended for determination of the probability for the presence of cancer, but do not address the concept of risk assessment, e.g. as a pre-screening tool.

Method used


Image

  • Optical transillumination and reflectance spectroscopy to quantify disease risk
  • Optical transillumination and reflectance spectroscopy to quantify disease risk
  • Optical transillumination and reflectance spectroscopy to quantify disease risk

Examples


example

Breast Tissue Transillumination Study

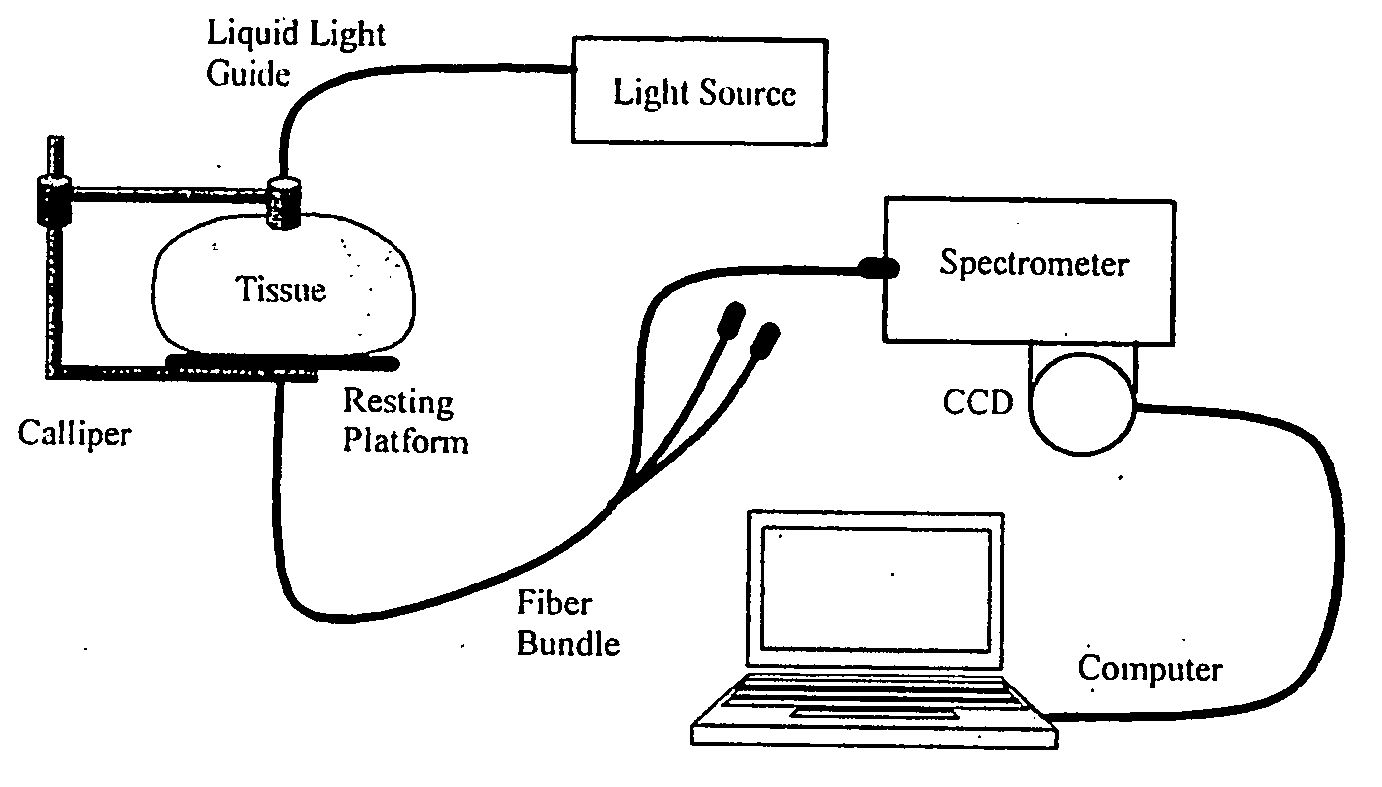
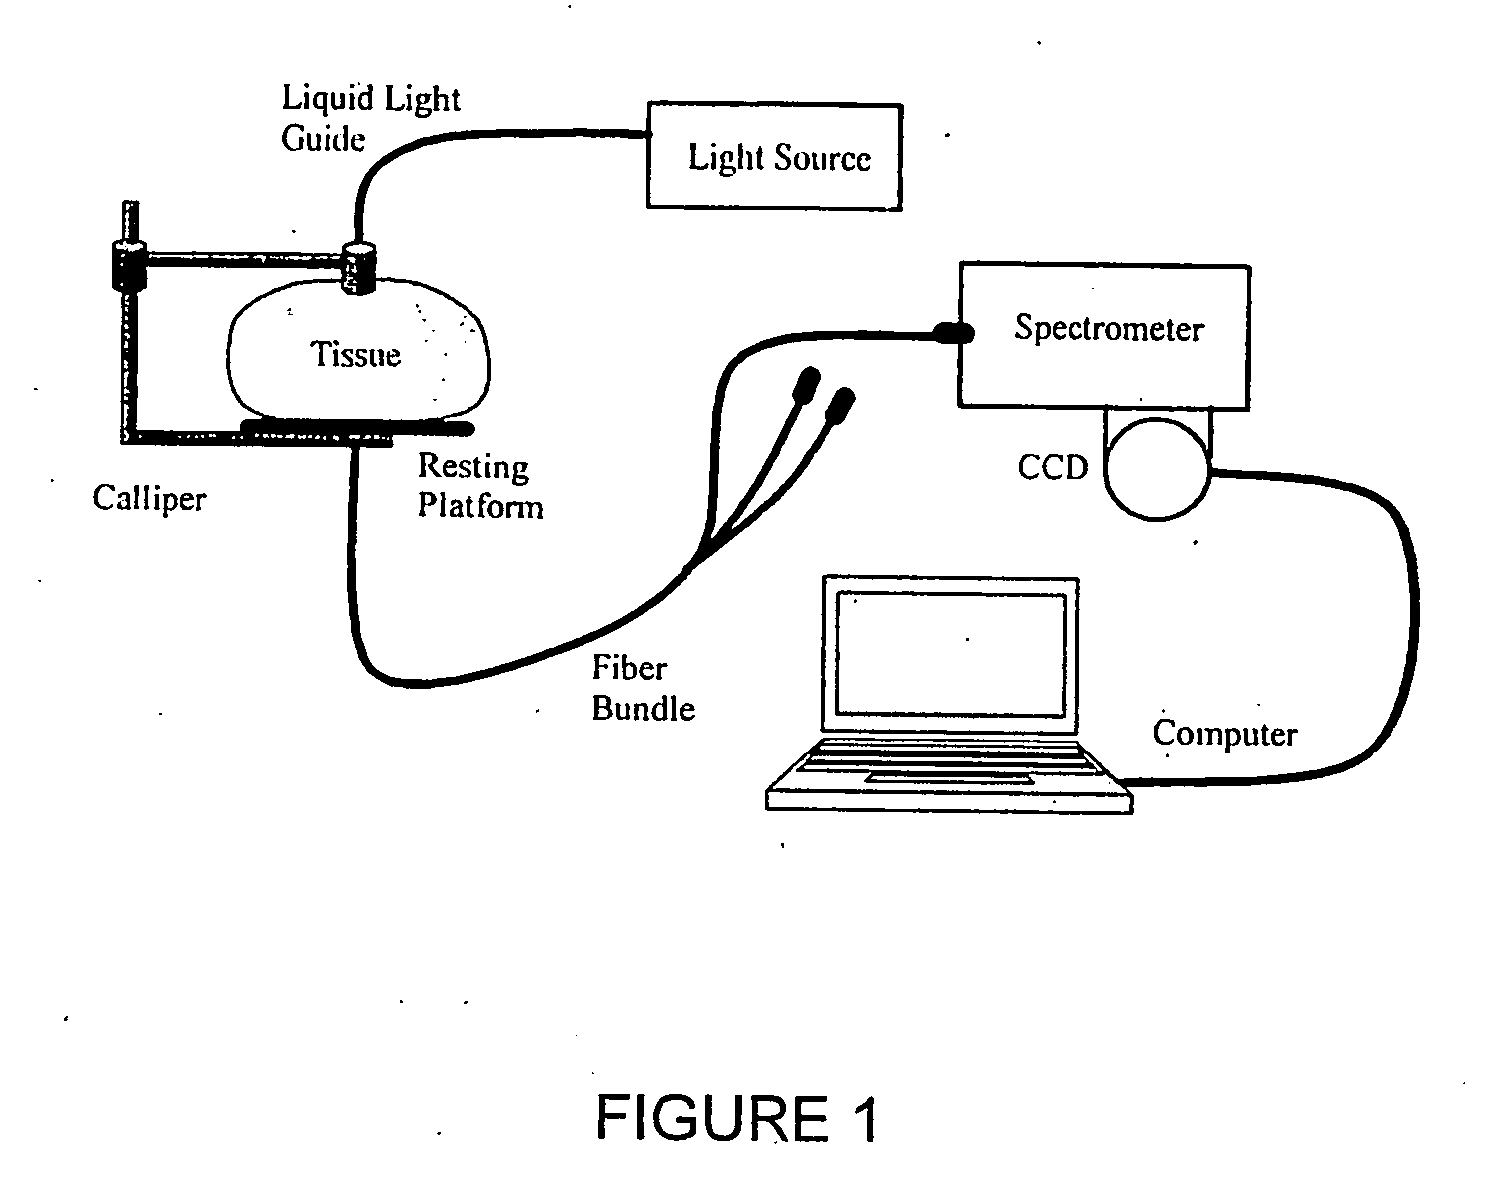
[0061] Transillumination spectroscopy measurements were taken in a dark room with the volunteer seated comfortably, and the breast resting on a horizontal support (FIG. 1). Total data acquisition time was approximately 15 minutes allowing measurements at all 8 positions and necessary re-positioning of the optodes. There was little discomfort to the volunteers due to point compression of the breast by the source optode.

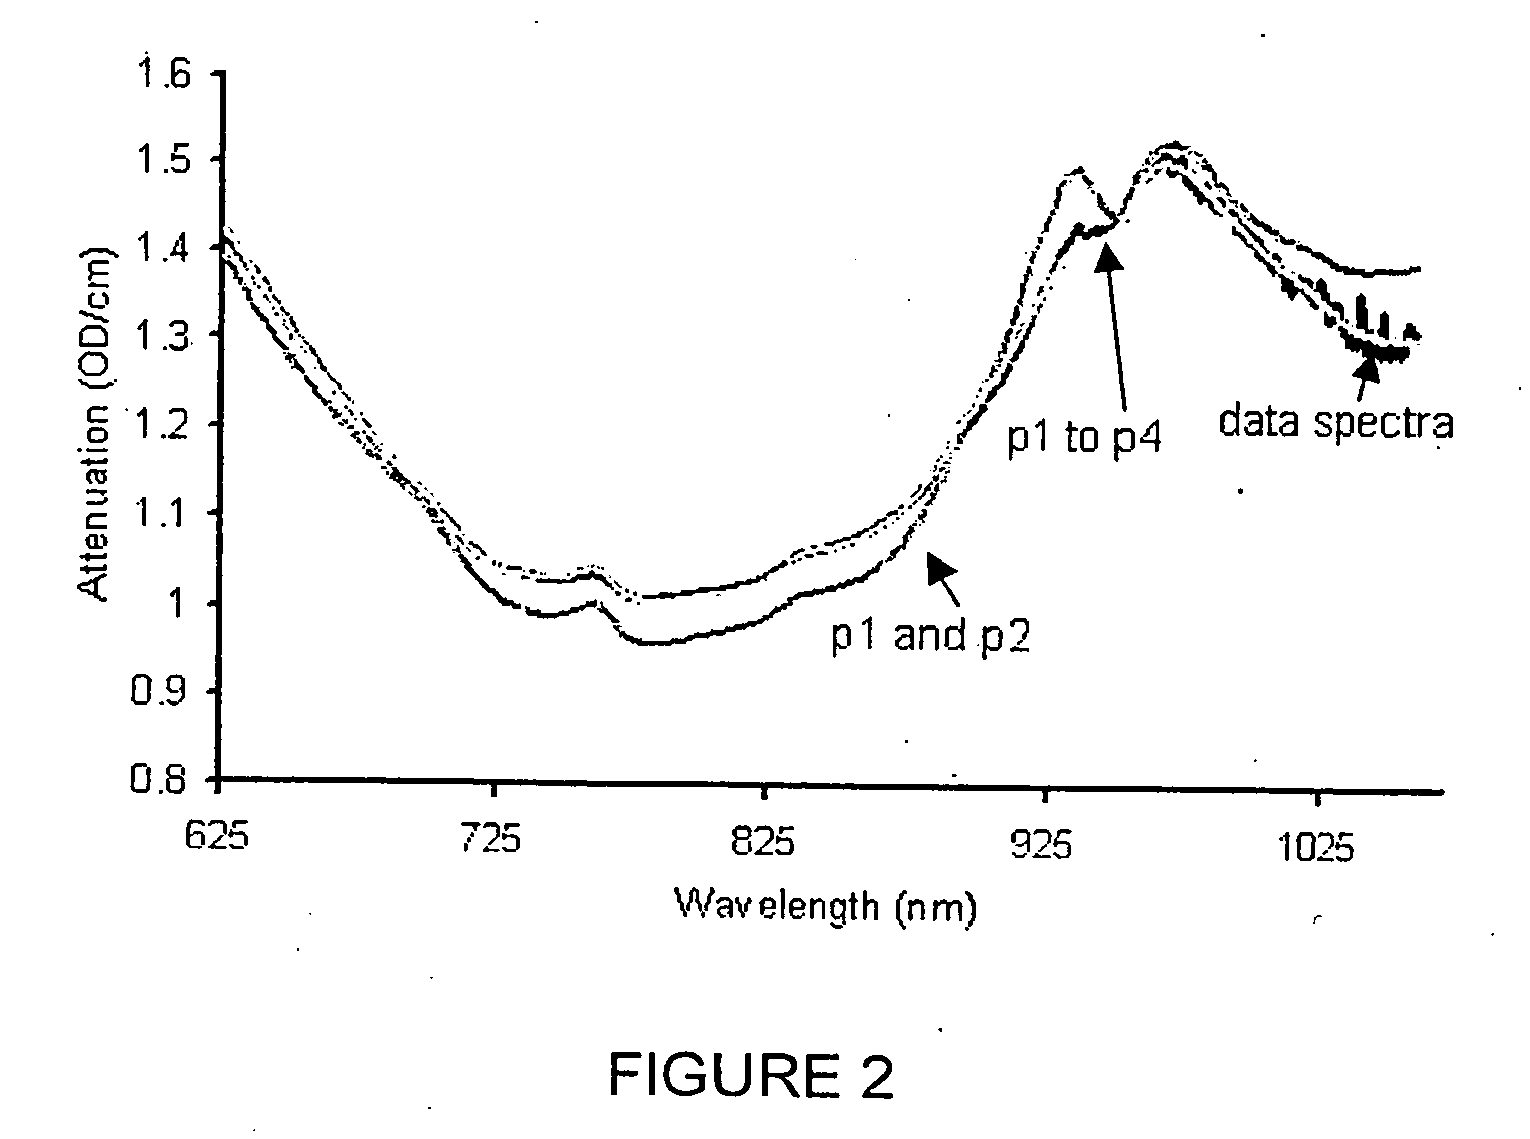
[0062]FIG. 3 shows an example of a typical set of measurements comprised of eight spectra from the volunteer. Spectra from the respective bilateral positions of the breast show symmetry, as expected in women with healthy breast tissue. In previous studies, this criterion of spectral symmetry in the same position of both breasts was used, by Egan and Dolan, to indicate absence of breast cancer in the examined areas (8). The reproducibility of the optical transillumination measurements within one visit was analyzed by recruiting a v...


PUM


Abstract

The present invention uses spectroscopic tissue volume measurements using non-ionizing radiation to detect pre-disease transformations in the tissue, which increase the risk for this disease in mammals. The method comprises illuminating a volume of selected tissue of a mammal with light having wavelengths covering a pre-selected spectral range, detecting light transmitted through, or reflected from, the volume of selected tissue, and obtaining a spectrum of the detected light. The spectrum of detected light is then represented by one or more basis spectral components, an error term, and an associated scalar coefficient for each of the basis spectral components. The associated scalar coefficient is calculated by minimizing the error term. The associated scalar coefficient of the each of the basis spectral components is correlated with a pre-selected property of the selected tissue known to be indicative of susceptibility of the tissue for the pre-selected disease to obtain the susceptibility for the mammal to developing the pre-selected disease.

Description

CROSS REFERENCE TO RELATED UNITED STATES PATENT APPLICATION [0001] This patent application relates to U.S. provisional patent application Ser. No. 60 / 331,633, filed on Nov. 20, 2001, entitled OPTICAL TRANSILLUMINATION SPECTROSCOPY to quantify Disease Risk.FIELD OF THE INVENTION [0002] The present invention relates to the use of optical transillumination / reflectance spectroscopy as a diagnostic for determination of the risk for diseases. BACKGROUND OF THE INVENTION [0003] As early cancer or disease detection and diagnosis make further inroads into clinical practice, the high cost of current disease screening techniques redirected the focus of the investigators towards methods capable of quantifying the risk towards these diseases as a practical pre-screening tool. One particular application area is epidemiological science and public health research into cancer prevention, so the invention is applicable for a wide variety of chronic or slowly developing diseases such as Alzheimer's, o...

Claims


Application Information

Patent Timeline
Patent Type & Authority Applications(United States)
IPC IPC(8): A61B6/00A61B5/00
CPCA61B5/0091A61B5/4312
Inventor LILGE, LOTHARWILSON, BRIAN C.NIELSEN, MICHELLE K. SIMICK
Owner UNIV HEALTH NETWORK
Why Eureka
Try Eureka