Data analysis system and method

a data analysis and data technology, applied in the field of data analysis system and method, can solve the problems of difficult recognition of cmss, unsuitable for use in ill-defined domains or domains, unknown and possibly abnormality, etc., and achieve the effect of improving detection accuracy

Active Publication Date: 2006-08-31
BRITISH TELECOMM PLC
View PDF10 Cites 39 Cited by
  • Summary
  • Abstract
  • Description
  • Claims
  • Application Information

AI Technical Summary

Benefits of technology

[0041] Embodiments of the invention allow the organisation of a multitude of sensors into an effective sensor network. Sensors can form sensor groups that combine data from several sensors by sensor data fusion. For each sensor or sensor group normality models may automatically be built up. A normality model allows the system to learn what normal conditions are for any sensor or group of sensors in the absence of any knowledge about abnormal conditions. By using normality models to predict the data to be observed by a sensor or sensor group and by comparing this prediction with the actually measured data the system can automatically detect abnormal conditions without the need for any confirmed knowledge about abnormal conditions to be rece

Problems solved by technology

Most of the incoming signatures are usually tainted with noise, which makes their recognition difficult.
If the system does not recognise the incoming signature to be within the tolerance level of any reference signature, then it will be considered as unknown and possibly abnormal.
That means CMSs are not suitable for use in ill-defined domains or domains where abnormal conditions have not been observed before, are not likely to be observed and cannot be created or predicted easily.
An example would be the failure of an expensive piece of machinery.
Failure may be devastating such that it is not possible to drive the monitored machine into failure mode in order to record failure conditions.
There may be only vague and uncertain knowledge about thresholds of monitored signals and this knowledge may no

Method used


Image

  • Data analysis system and method
  • Data analysis system and method
  • Data analysis system and method

Examples


Embodiment Construction

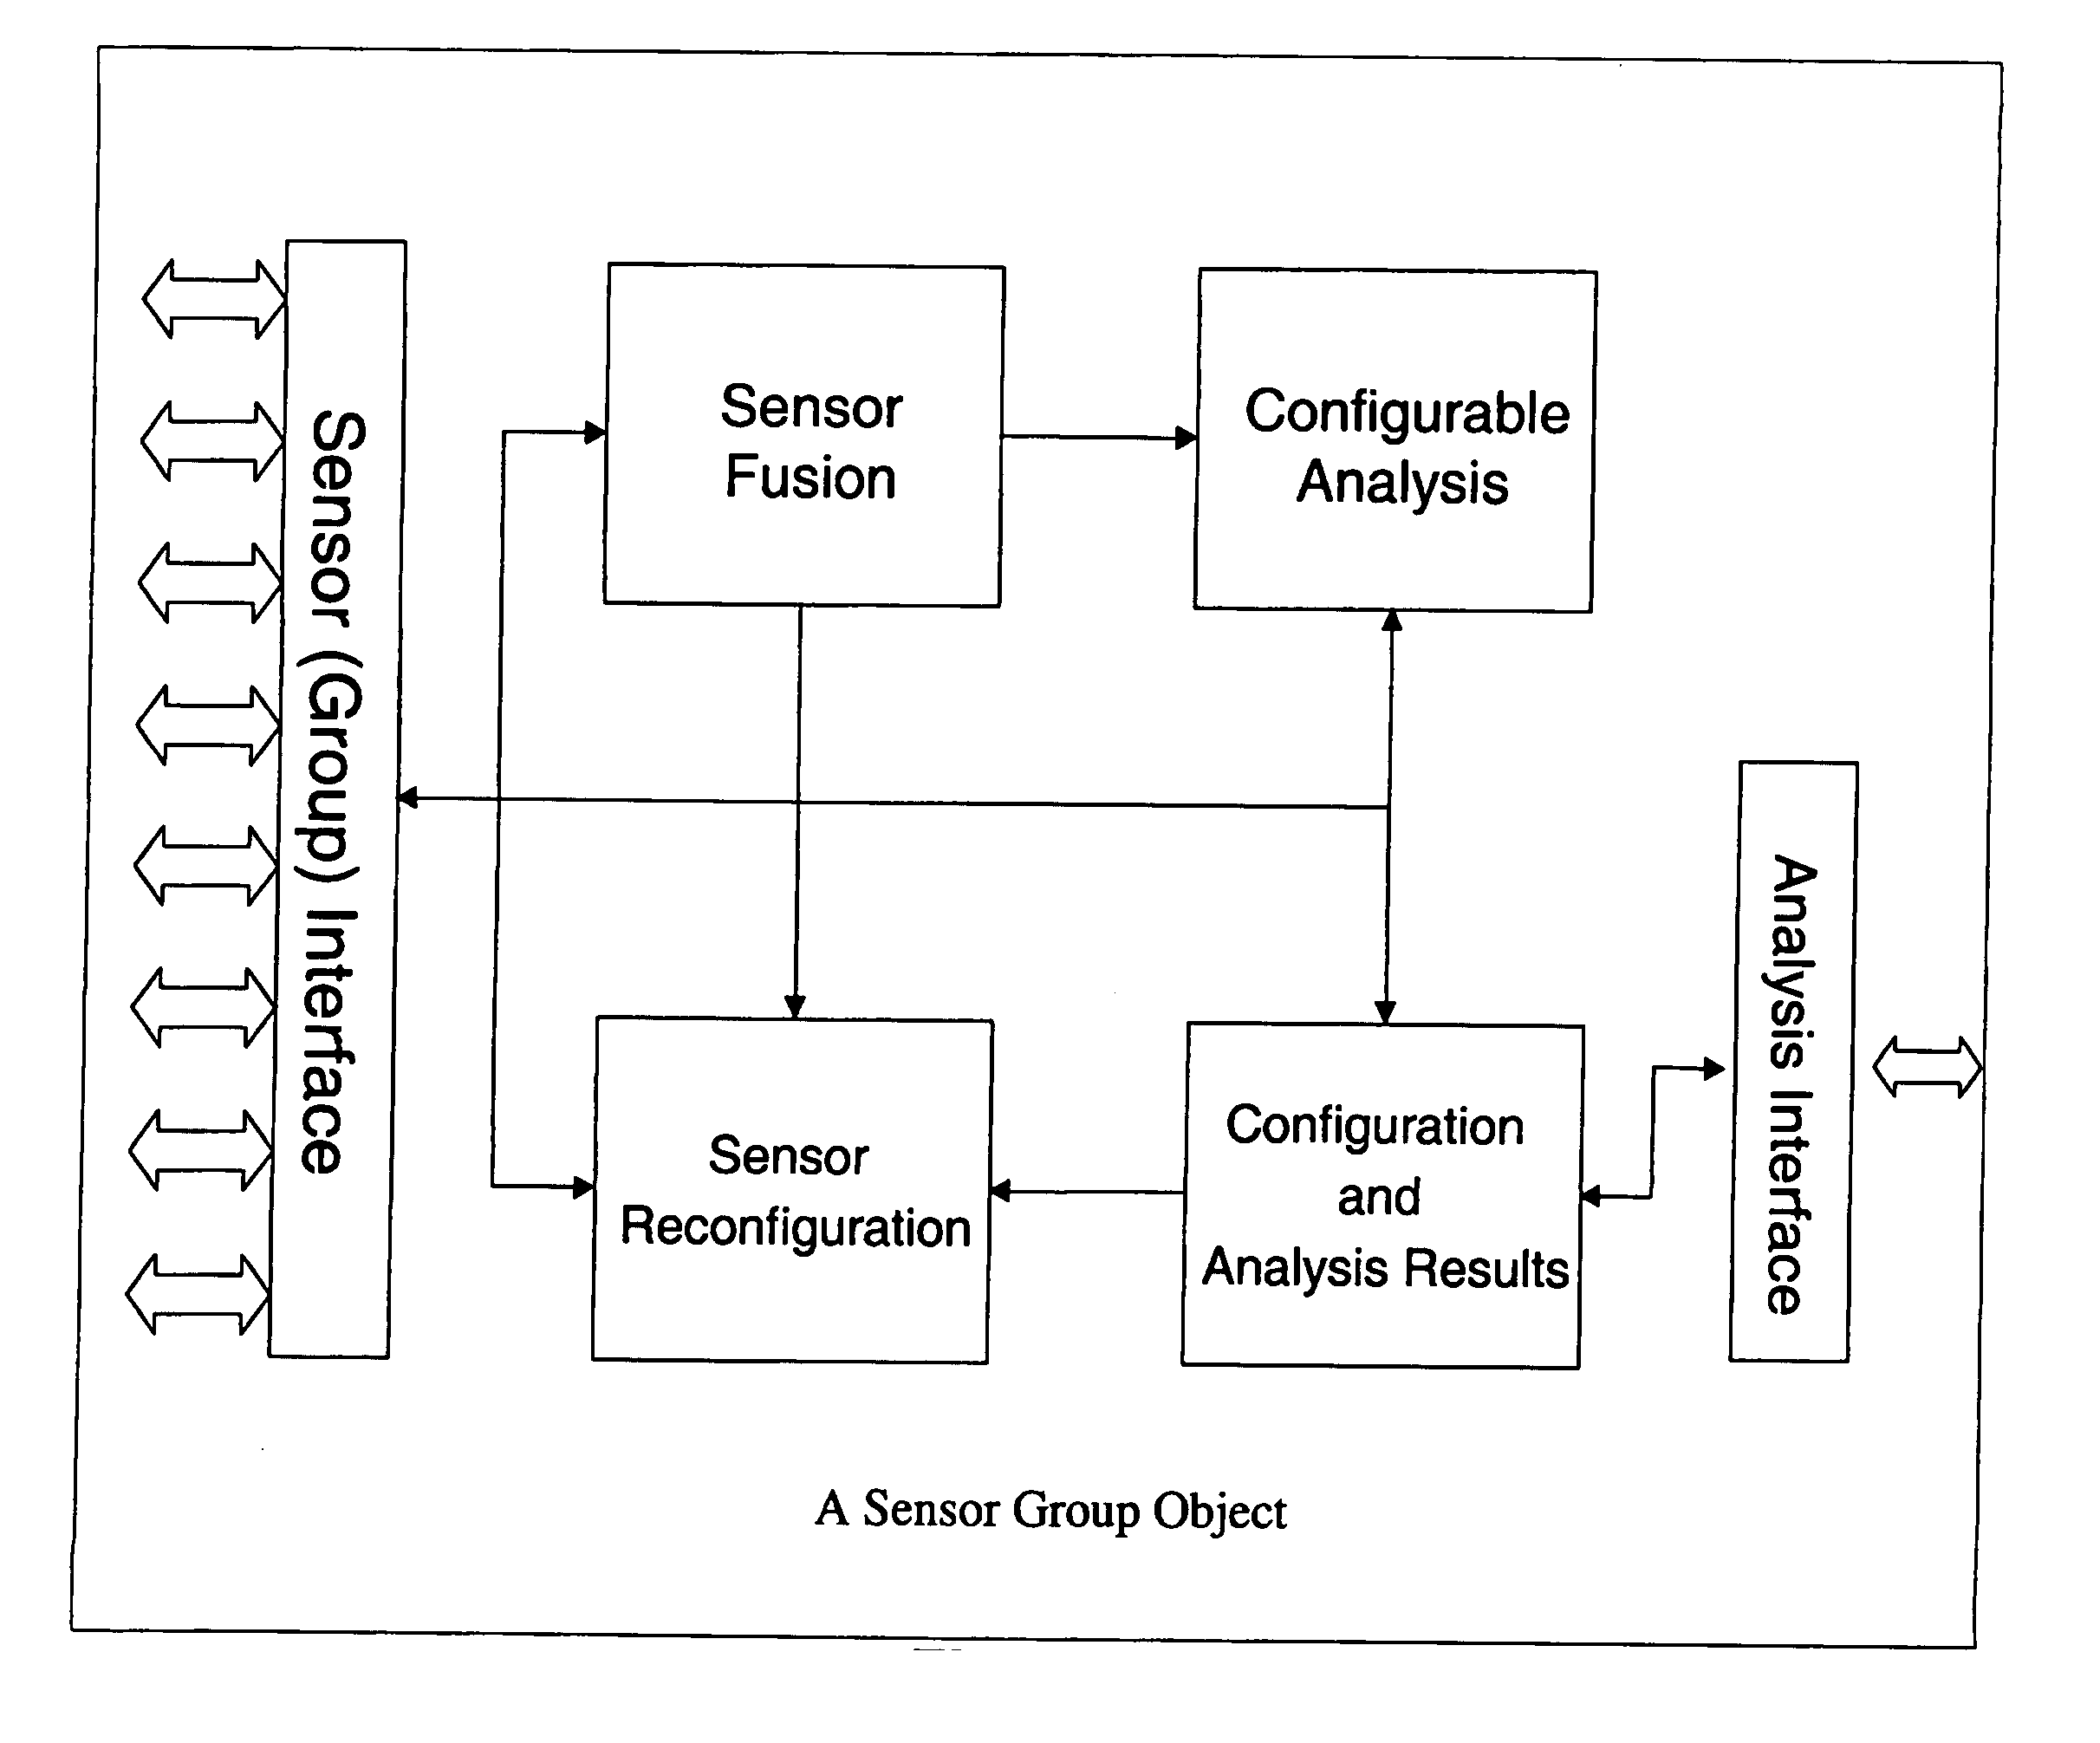
[0082] With reference to FIGS. 8 to 10, an Intelligent Data Analysis (IDA) unit 10 for a sensor network is shown. This unit is responsible for collecting, managing and analysing data from a hierarchically structured network of sensors. The IDA unit 10 allows users to add sensors to or remove them from the network, organise them into groups, configure them and analyse the data they produce. The IDA unit 10 allows for automatic data analysis by learning normal / abnormal patterns in sensor data. On detection of abnormal patterns an alarm is raised automatically. The user can configure the learning and analysis features of the unit by specifying rules for individual sensors. The unit also provides analysis of historic sensor data and generates reports on demand.

[0083] Functions of the IDA unit 10 may include: [0084] Providing an output to a GUI that allows users to configure and analyse sensor data; [0085] Managing a sensor network by organising sensors into sensor groups; [0086] Access...


PUM


Abstract

Methods and systems for analysing data from a monitoring system for monitoring characteristics of a dynamic system, said monitoring system providing characteristic data in respect of a dynamic system with at least one known normal state, the analysis system comprising: means (100) for receiving characteristic data from the monitoring system, means (101) for receiving confirmation information from an operator when the dynamic system is in a known normal state, normality modelling means (105) for deriving a normality model comprising data indicative of known normal states in response to received characteristic data and confirmation information, prediction generating means (105) for predicting future characteristic data from the normality model, difference function providing means (105) for providing a difference function indicating an acceptable difference between predicted and received characteristic data, and comparison means (105) for comparing predicted characteristic data with received characteristic data in conjunction with the difference function and producing an abnormality signal if the difference exceeds the difference function.

Description

[0001] The present invention relates to systems and methods for the analysis of data from a monitoring system for monitoring a dynamic system. BACKGROUND [0002] Diagnosing abnormal behaviour of a system (e.g. a technical system, environmental conditions, vital signs, etc) is similar to a physician's diagnosis based on observing symptoms of a patient. Medical doctors are capable of interpreting symptoms and making a diagnosis based on data obtained from observing a patient. Even if the observed symptoms are not sufficient to determine the cause of an illness, medical doctors can often determine that a symptom or measurement is not normal because they know from experience what is normal in a patient and what is not. [0003] In order to replicate such an intelligent diagnosis process in an automated Condition Monitoring System (CMS), the CMS must know “what is normal” and “what is not normal”. Known CMSs use signatures to achieve that goal. A signature is a limited amount of data that r...

Claims


Application Information

Patent Timeline
IPC IPC(8): G05B13/02G05B23/02
CPCG05B17/02G05B23/0254Y10S706/90
Inventor NAUCK, DETLEFDAZVINE, BEHNAMSPOTT, MARTIN
Owner BRITISH TELECOMM PLC
Why Eureka
Try Eureka