Memory debugging tool

a memory debugging and tool technology, applied in the field of computer software development, can solve the problems affecting the performance of the application, and generally being unable to determine at any particular point in the execution of the application how many memory objects and how much total memory, etc., and achieve the effect of generating a large volume of data

Active Publication Date: 2006-08-31
SAP PORTALS ISRAEL
View PDF5 Cites 28 Cited by
  • Summary
  • Abstract
  • Description
  • Claims
  • Application Information

AI Technical Summary

Benefits of technology

[0005] Embodiments of the present invention address this problem by providing the software developer with tools that can be used to track and visualize allocation of memory objects in a software program. For this purpose, a profiler collects records of memory allocations during a trial run of the program. This step generates a large volume of data, since a typical program may create thousands or even millions of objects during even a short run. Therefore, in embodiments of the present invention, the records are sorted and aggregated so as to permit the developer to see the amount of allocation that occurred at each point in the program and, typically, to bring out the most allocation-intensive program lines. The aggregated records may also include stack traces, to enable the programmer to observe the sequence of program steps leading up to points of heavy allocation. This presentation of information enables the programmer to identify, understand and debug the points of excessive memory allocation in the program.

Problems solved by technology

The developer is generally unable to determine at any particular point in the execution of the application how many memory objects and how much total memory have actually been allocated.
Excessive memory allocation will lead to long and frequent garbage collection, which may in turn degrade the performance of the application.
This step generates a large volume of data, since a typical program may create thousands or even millions of objects during even a short run.

Method used


Image

  • Memory debugging tool
  • Memory debugging tool
  • Memory debugging tool

Examples


Embodiment Construction

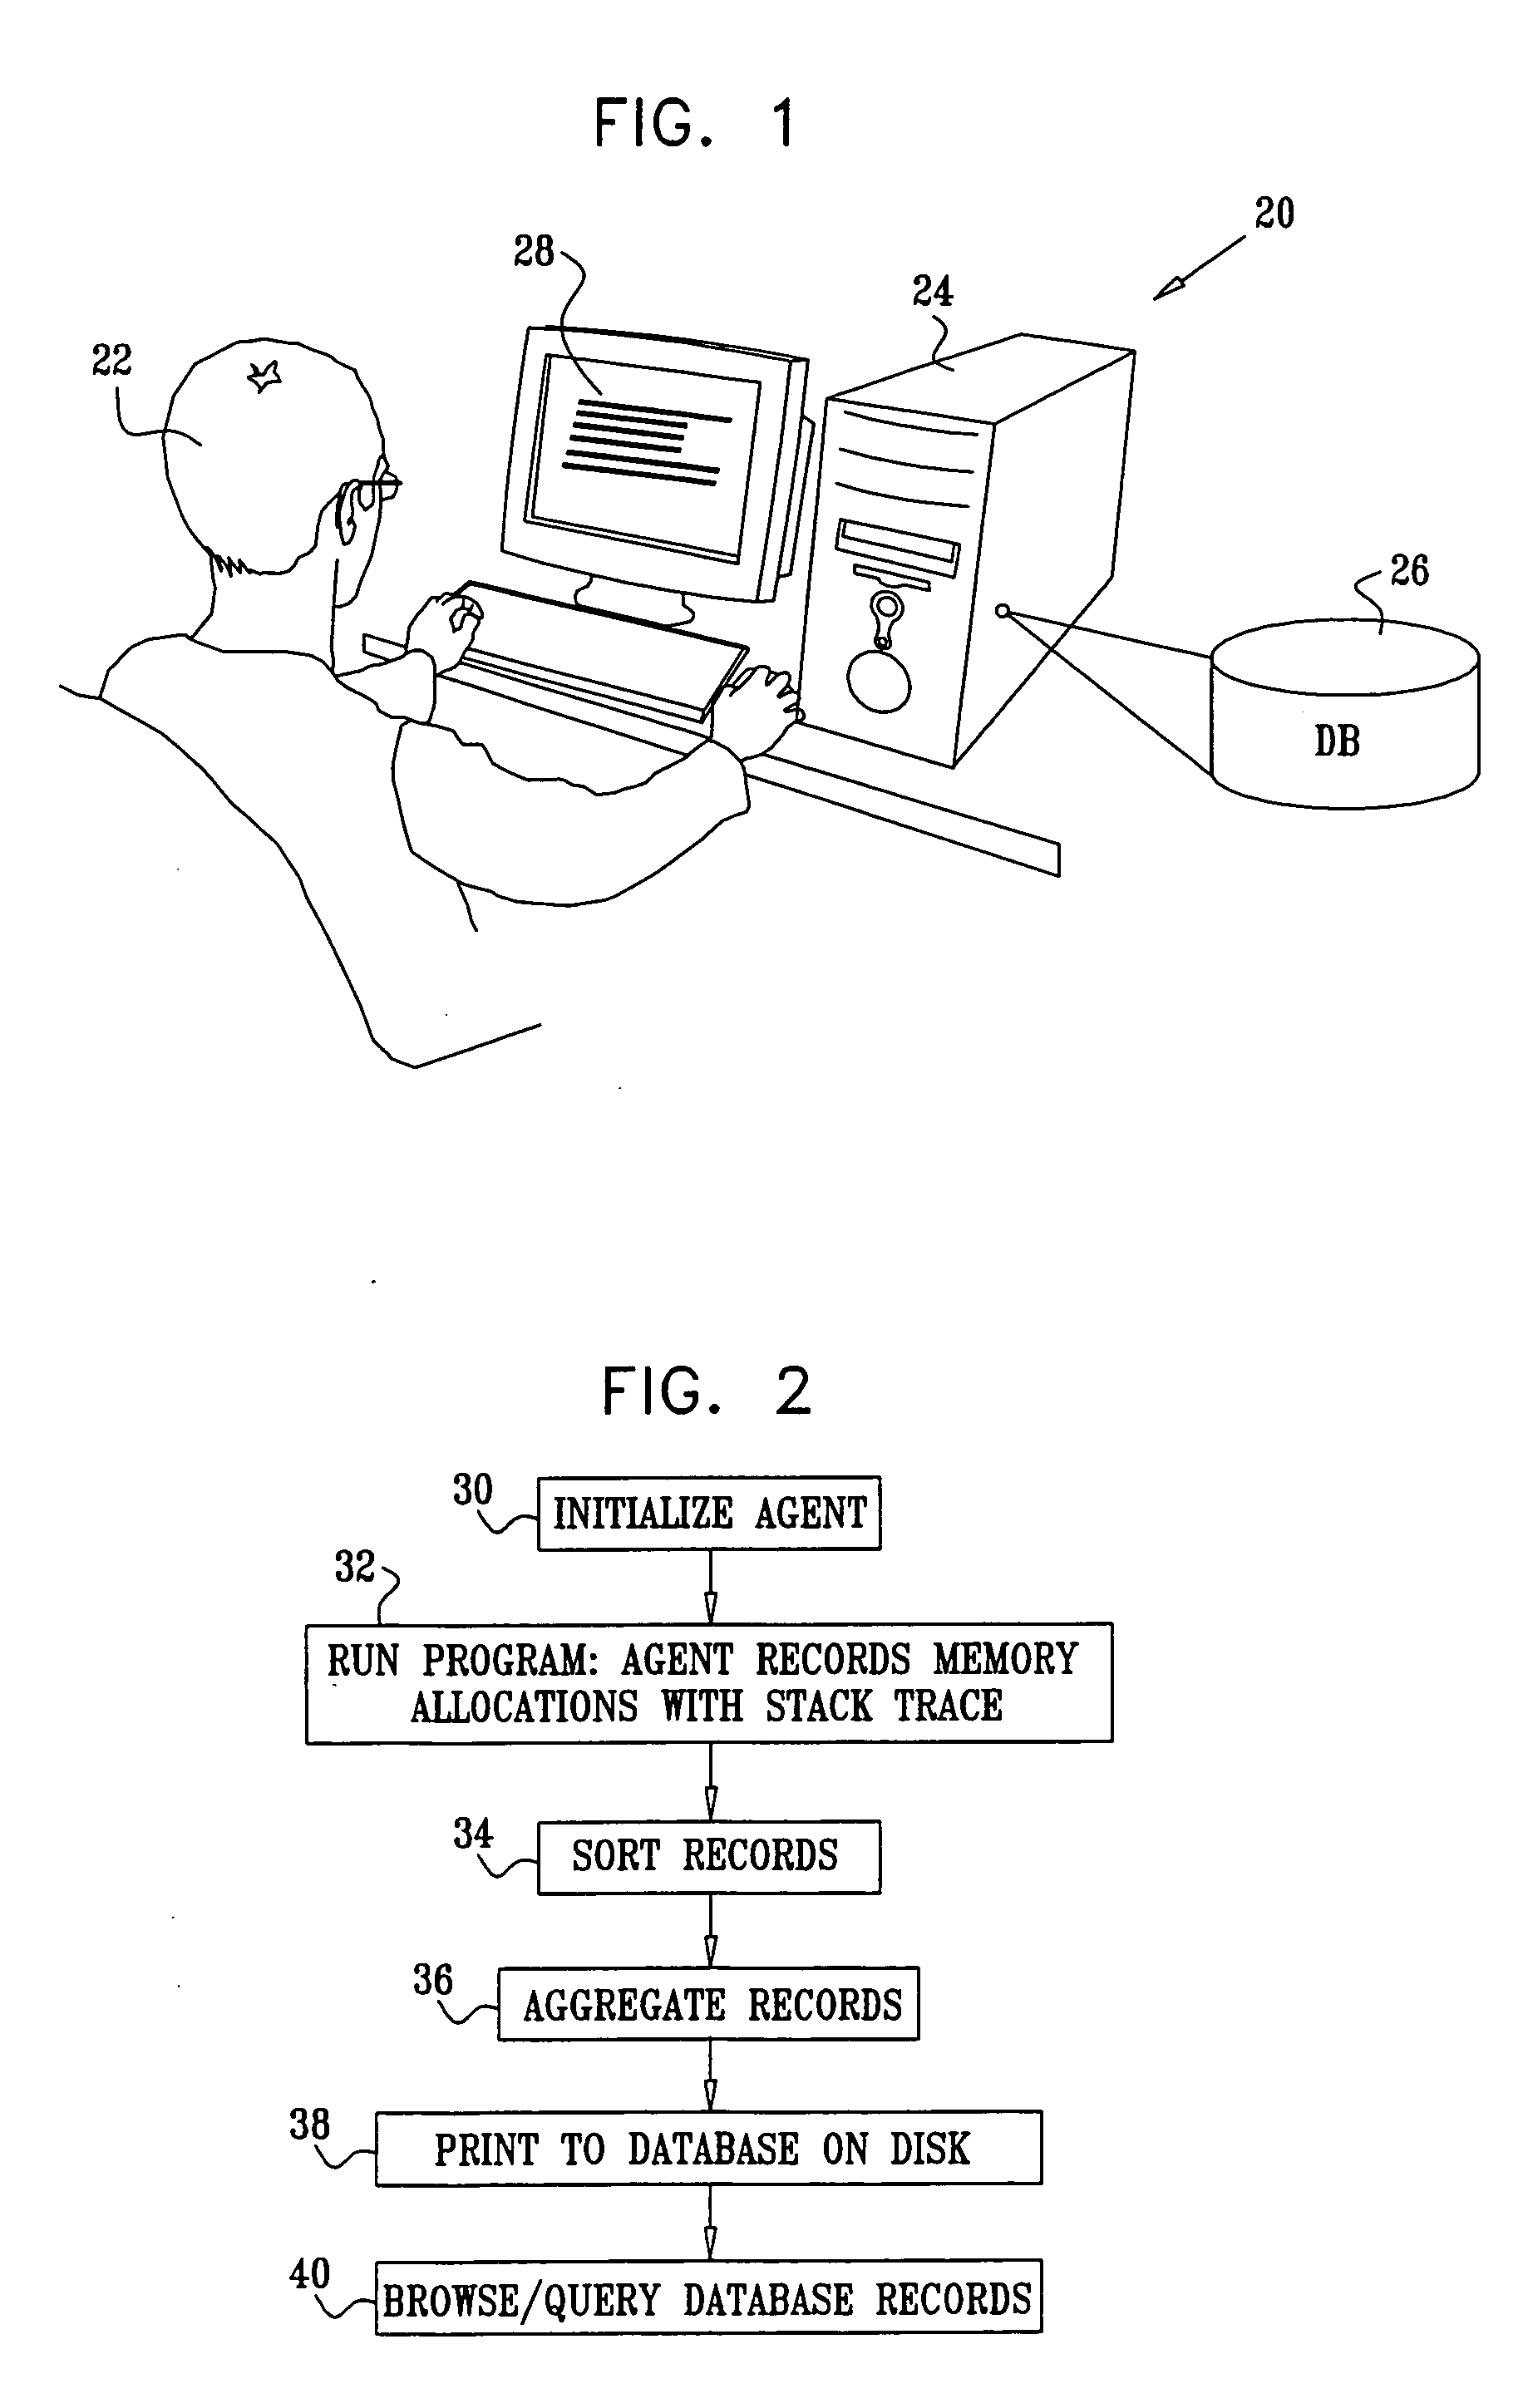
[0026]FIG. 1 is a schematic, pictorial illustration of a system 20 for software development, in accordance with an embodiment of the present invention. The system is used by a programmer 22 to run and debug a software program under development, such as a Java application. Typically, the system is built around a computer processor 24, which is programmed in software to carry out the functions described hereinbelow. This software may be downloaded to system 20 in electronic form, over a network, for example, or it may be furnished on tangible media, such as optical, magnetic or electronic memory.

[0027] The operation of system 20 is described in detail hereinbelow with reference to the figures that follow. Briefly, processor 24 runs the program under test and records memory allocations that occur during the program. These records are sorted, aggregated and then stored in a database in a memory 26. Alternatively, other sorts of data structures, as are known in the art, may be used to h...


PUM


Abstract

A method for assessing memory use of a software program includes collecting records of memory allocations while running the program, the records indicating respective allocation points in the program. The records are sorted according to the respective allocation points, and the sorted records are displayed so as to enable a user to observe totals of the memory allocations at the respective allocation points. In a disclosed embodiment, stack traces are collected at the allocation points, and information regarding the stack traces is displayed for at least some of the allocation points.

Description

FIELD OF THE INVENTION [0001] The present invention relates generally to computer software development, and specifically to tracking the amount of memory allocated by a software program. BACKGROUND OF THE INVENTION [0002] In early programming languages, memory allocation and deallocation was a burden imposed directly on the programmer, who was responsible for allocating and deallocating memory blocks. This burden was eased by the introduction of garbage collectors, which are programs that deallocate memory that is assigned to dead or unreachable objects. Garbage collectors have improved programmer productivity and have enhanced software reliability. They are supported by a variety of modern programming languages, such as Java™. [0003] The Java Virtual Machine Profiler Interface (JVMPI) is a two-way function call interface between the Java virtual machine and an in-process profiler agent. The profiler agent issues controls and requests for information through the JVMPI. In response, ...

Claims


Application Information

Patent Timeline
Patent Type & Authority Applications(United States)
IPC IPC(8): G06F9/44
CPCG06F11/3636G06F11/366G06F12/023
Inventor BENTOLILA, ARIEL
Owner SAP PORTALS ISRAEL
Why Eureka
Try Eureka