Automated hierarchy classification in utility monitoring systems

a technology of utility monitoring and hierarchy, applied in the field of automatic alignment of data, automatic determination of power monitoring system hierarchy, can solve the problems of cumbersome, inefficient, expensive, and inconvenient monitoring of electrical power distribution systems, and the amount of data to be analysed and the context of data

Active Publication Date: 2007-01-04
SQUARE D CO
View PDF5 Cites 58 Cited by
  • Summary
  • Abstract
  • Description
  • Claims
  • Application Information

AI Technical Summary

Benefits of technology

[0013] According to still another embodiment of the present invention, an auto-learned hierarchy algorithm stores electrical data associated with multiple meters in a radial-fed distribution power monitoring system into a data table. A check matrix is calculated indicating whether a possible connection exists between any given pair of meters in the system. The meter with the largest power reading in the data table is put in a level list and is designated as the reference meter. A correlation coefficient matrix (CCM) is calculated based on the power data in the data table. Each correlation coefficient in the CCM is zeroed for meters that have zeros in the check matrix and meters that have been found to be connected (in the first iteration, there are none found to be connected yet). The column for the reference meter is copied from the CCM to the CRA, and the meter in the CRA having the highest correlation with the reference meter is identified. If that correlation exceeds a threshold value, the algorithm determines whether the current iteration is the first iteration for the meter in question. If so, the feeder associated with that meter is added to the list of meters on the current level. Otherwise, the algorithm determines whether the feeder correlation is trending higher.
[0014] If a higher trend is not determined, the algorithm checks whether all meters on the previous level have been analyzed. If not, the next meter on the previous level is obtained and the CCM is updated. Otherwise, the algorithm checks whether a connection for all meters has been found. If so, the algorithm exits, otherwise, the algorithm determines whether the maximum correlation coefficient in the CCM exceeds a threshold value. If so, the algorithm determines whether more meters exist for the current level. If not, the next meter with the highest power reading in the data table is determined. Otherwise, the meters on the current level are moved to the previous level, the CRA is cleared for the next level, and the algorithm repeats for the next level (which becomes the current level in the next loop), locating meters directly connected to the reference meter.

Problems solved by technology

Unfortunately, those responsible for evaluating data from monitoring devices are now overwhelmed by information from their monitoring systems.
Effectively monitoring today's electrical power distribution systems is cumbersome, expensive, and inefficient.
There are two problems here: the amount of data to be analyzed and the context of the data.
Accordingly, the data transmitted to the system computer from each monitoring device is often misaligned in that data from each monitoring device on the system does not arrive at the monitoring system's computer simultaneously.
Because of the data's complexity, quantity, and relative disjointed relationship from one monitoring device to the next, manual analysis of all the data is an enormous effort that often requires experts to be hired to complete the task.
This process is tedious, complex, prone to error and oversight, and time-consuming.
And this solution still requires the evaluation of large amounts of data because the system is only temporally in context; not spatially in context.
Synchronizing data using GPS systems is also disadvantageous because of time delays associated with other hardware in the system.
Furthermore, any alignment of data by a GPS-based system can only be as accurate as the propagation delay of the GPS signal, which means that the data still may not be optimally aligned when a GPS system is used.
The addition of supplemental monitoring devices in the electrical system does nothing more than generate more information about the electrical system at the point where the meter is added in the electrical system, increasing complexity without any benefit.
Any usefulness of the data is generally limited to the locality of the monitoring device that was added, while even more data is amassed.
The complexity of many electrical systems usually necessitates an involved configuration process of monitoring systems because each metered point in the electrical system has different characteristics, which is why multiple monitoring devices are installed in the first place.
As a result of the enormous volume of complex data accumulated from electrical monitoring systems heretofore, a thorough analysis of the data is typically not feasible due to limited resources, time, and / or experience.
Power monitoring devices measure the electrical system's operating parameters, but do not provide information about how the parameters at different points on the power monitoring system relate to each other.
Heretofore, the only techniques for passably integrating data were complex, expensive, manually intensive, and time-consuming for the user.
These techniques also permit only limited integration of data and require additional hardware (such as GPS hardware), data lines, and supplemental monitoring device accessories.

Method used


Image

  • Automated hierarchy classification in utility monitoring systems
  • Automated hierarchy classification in utility monitoring systems
  • Automated hierarchy classification in utility monitoring systems

Examples


Embodiment Construction

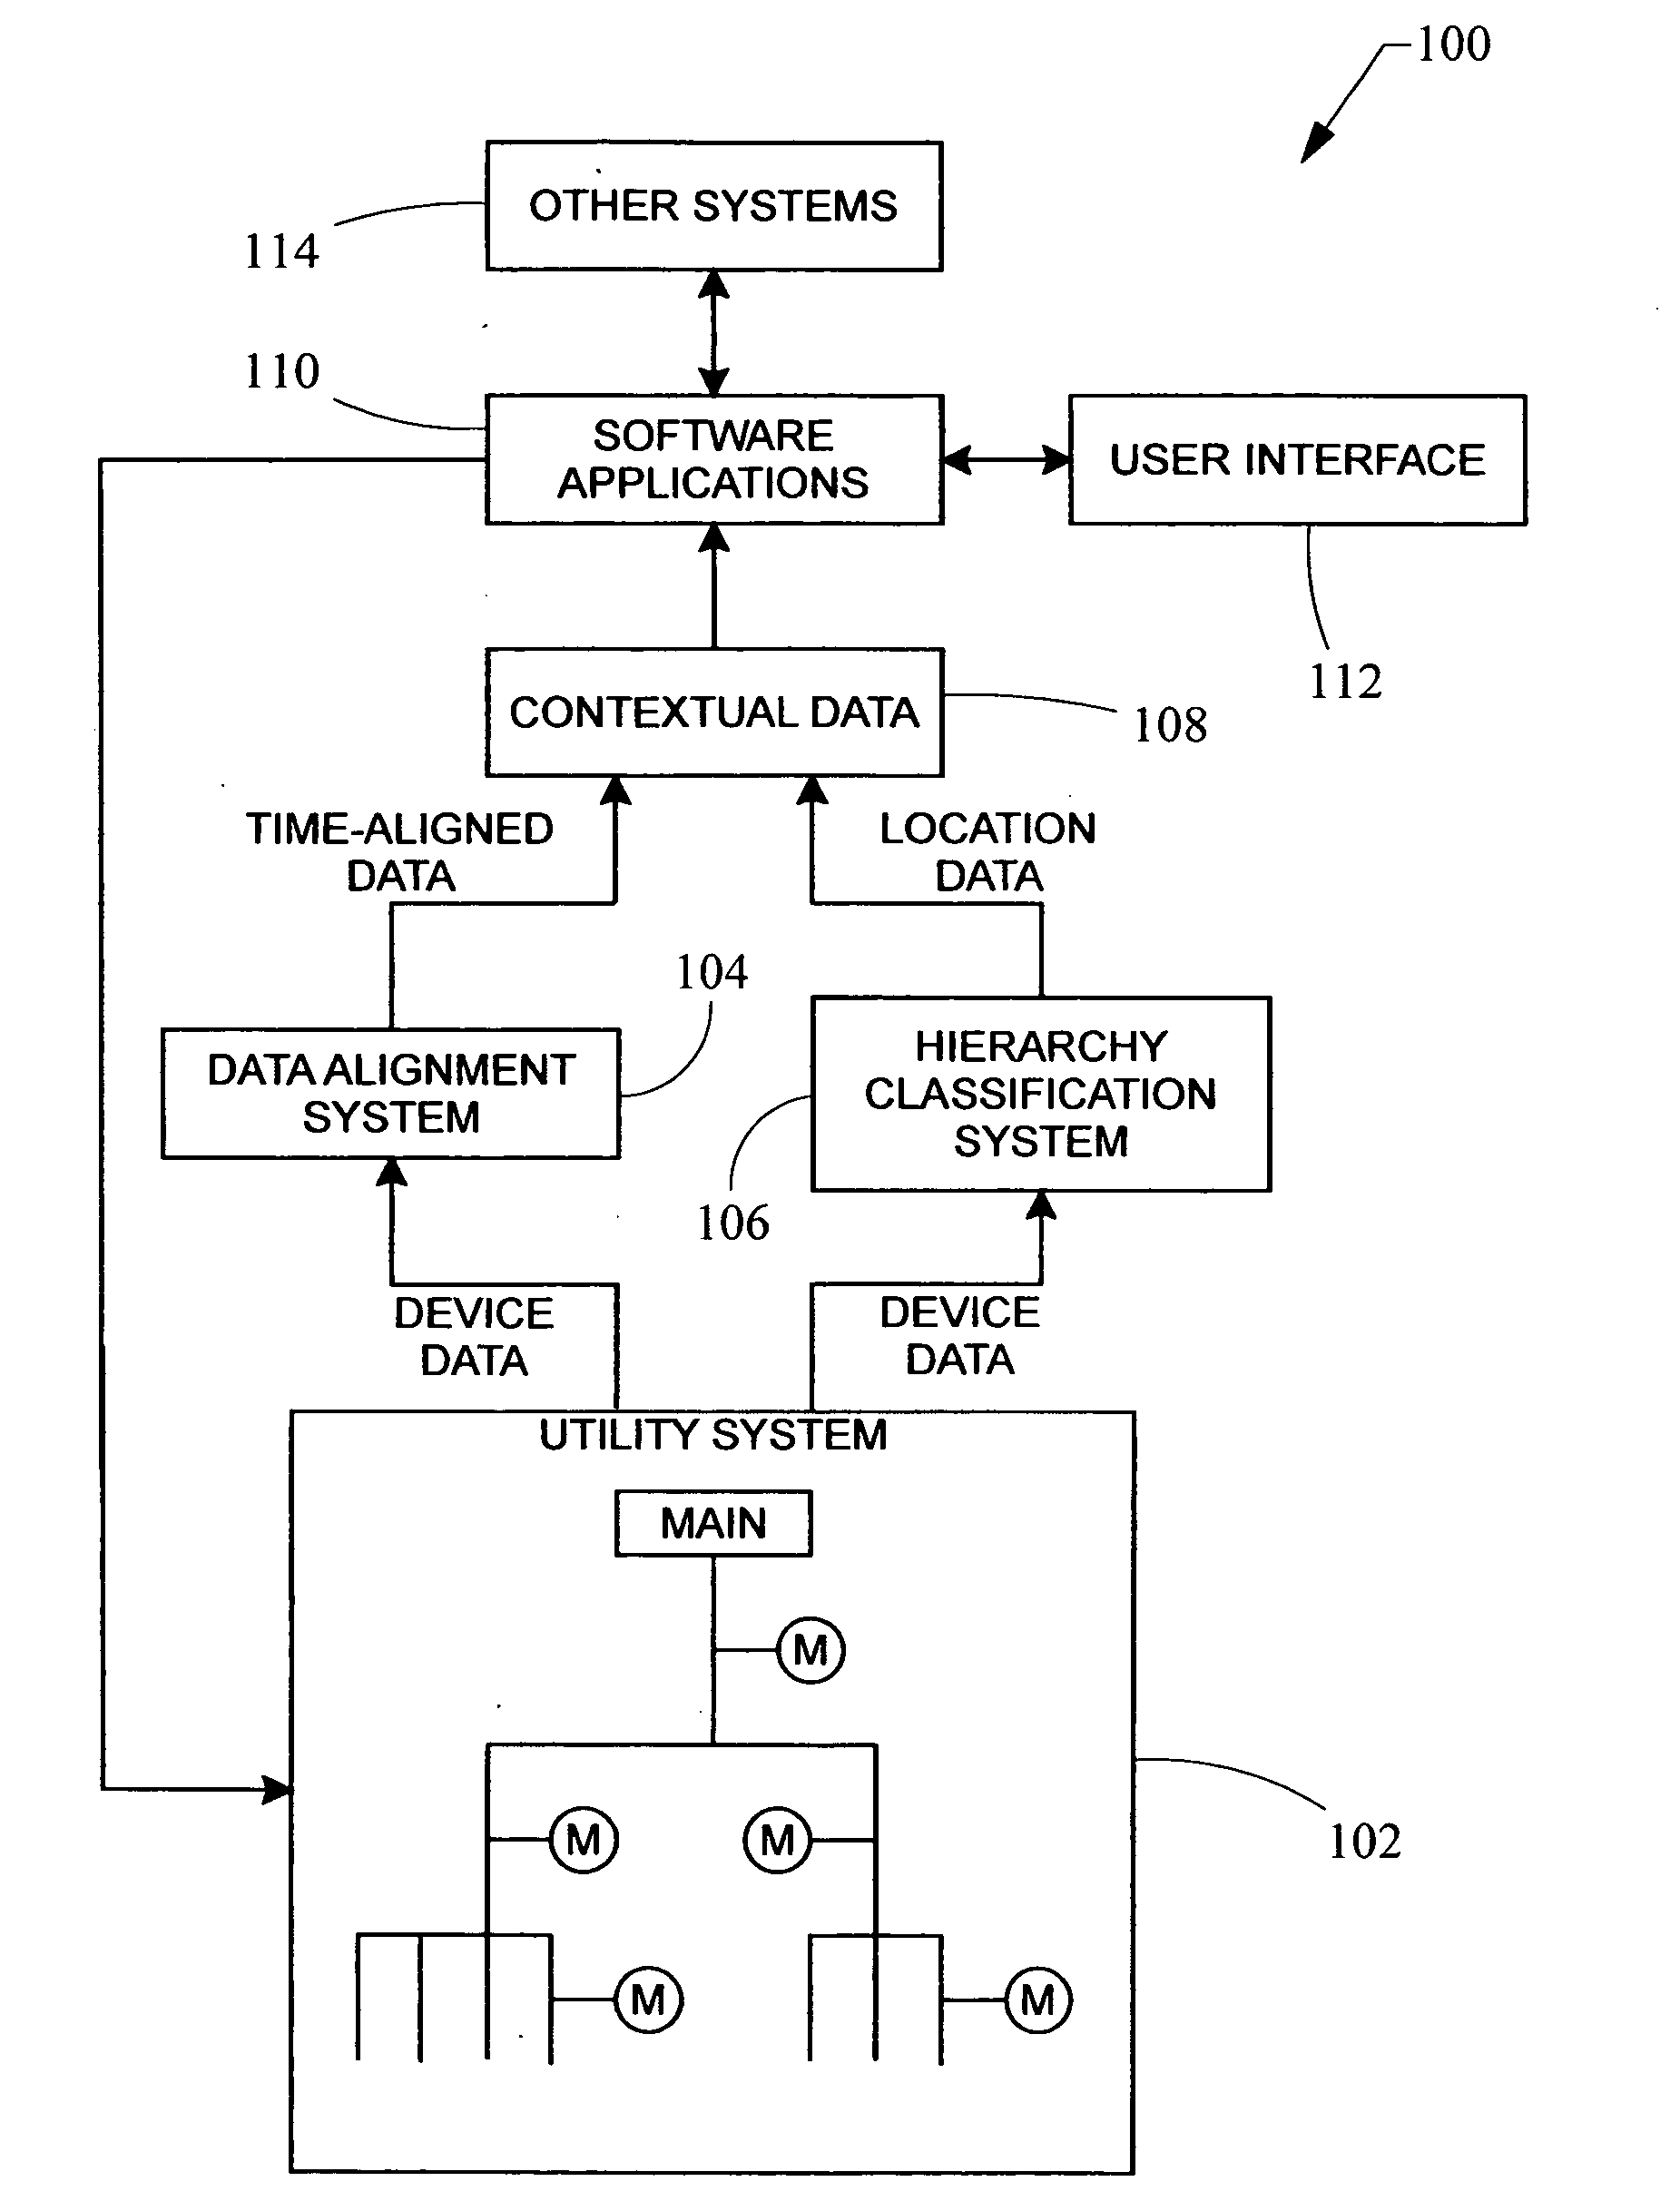
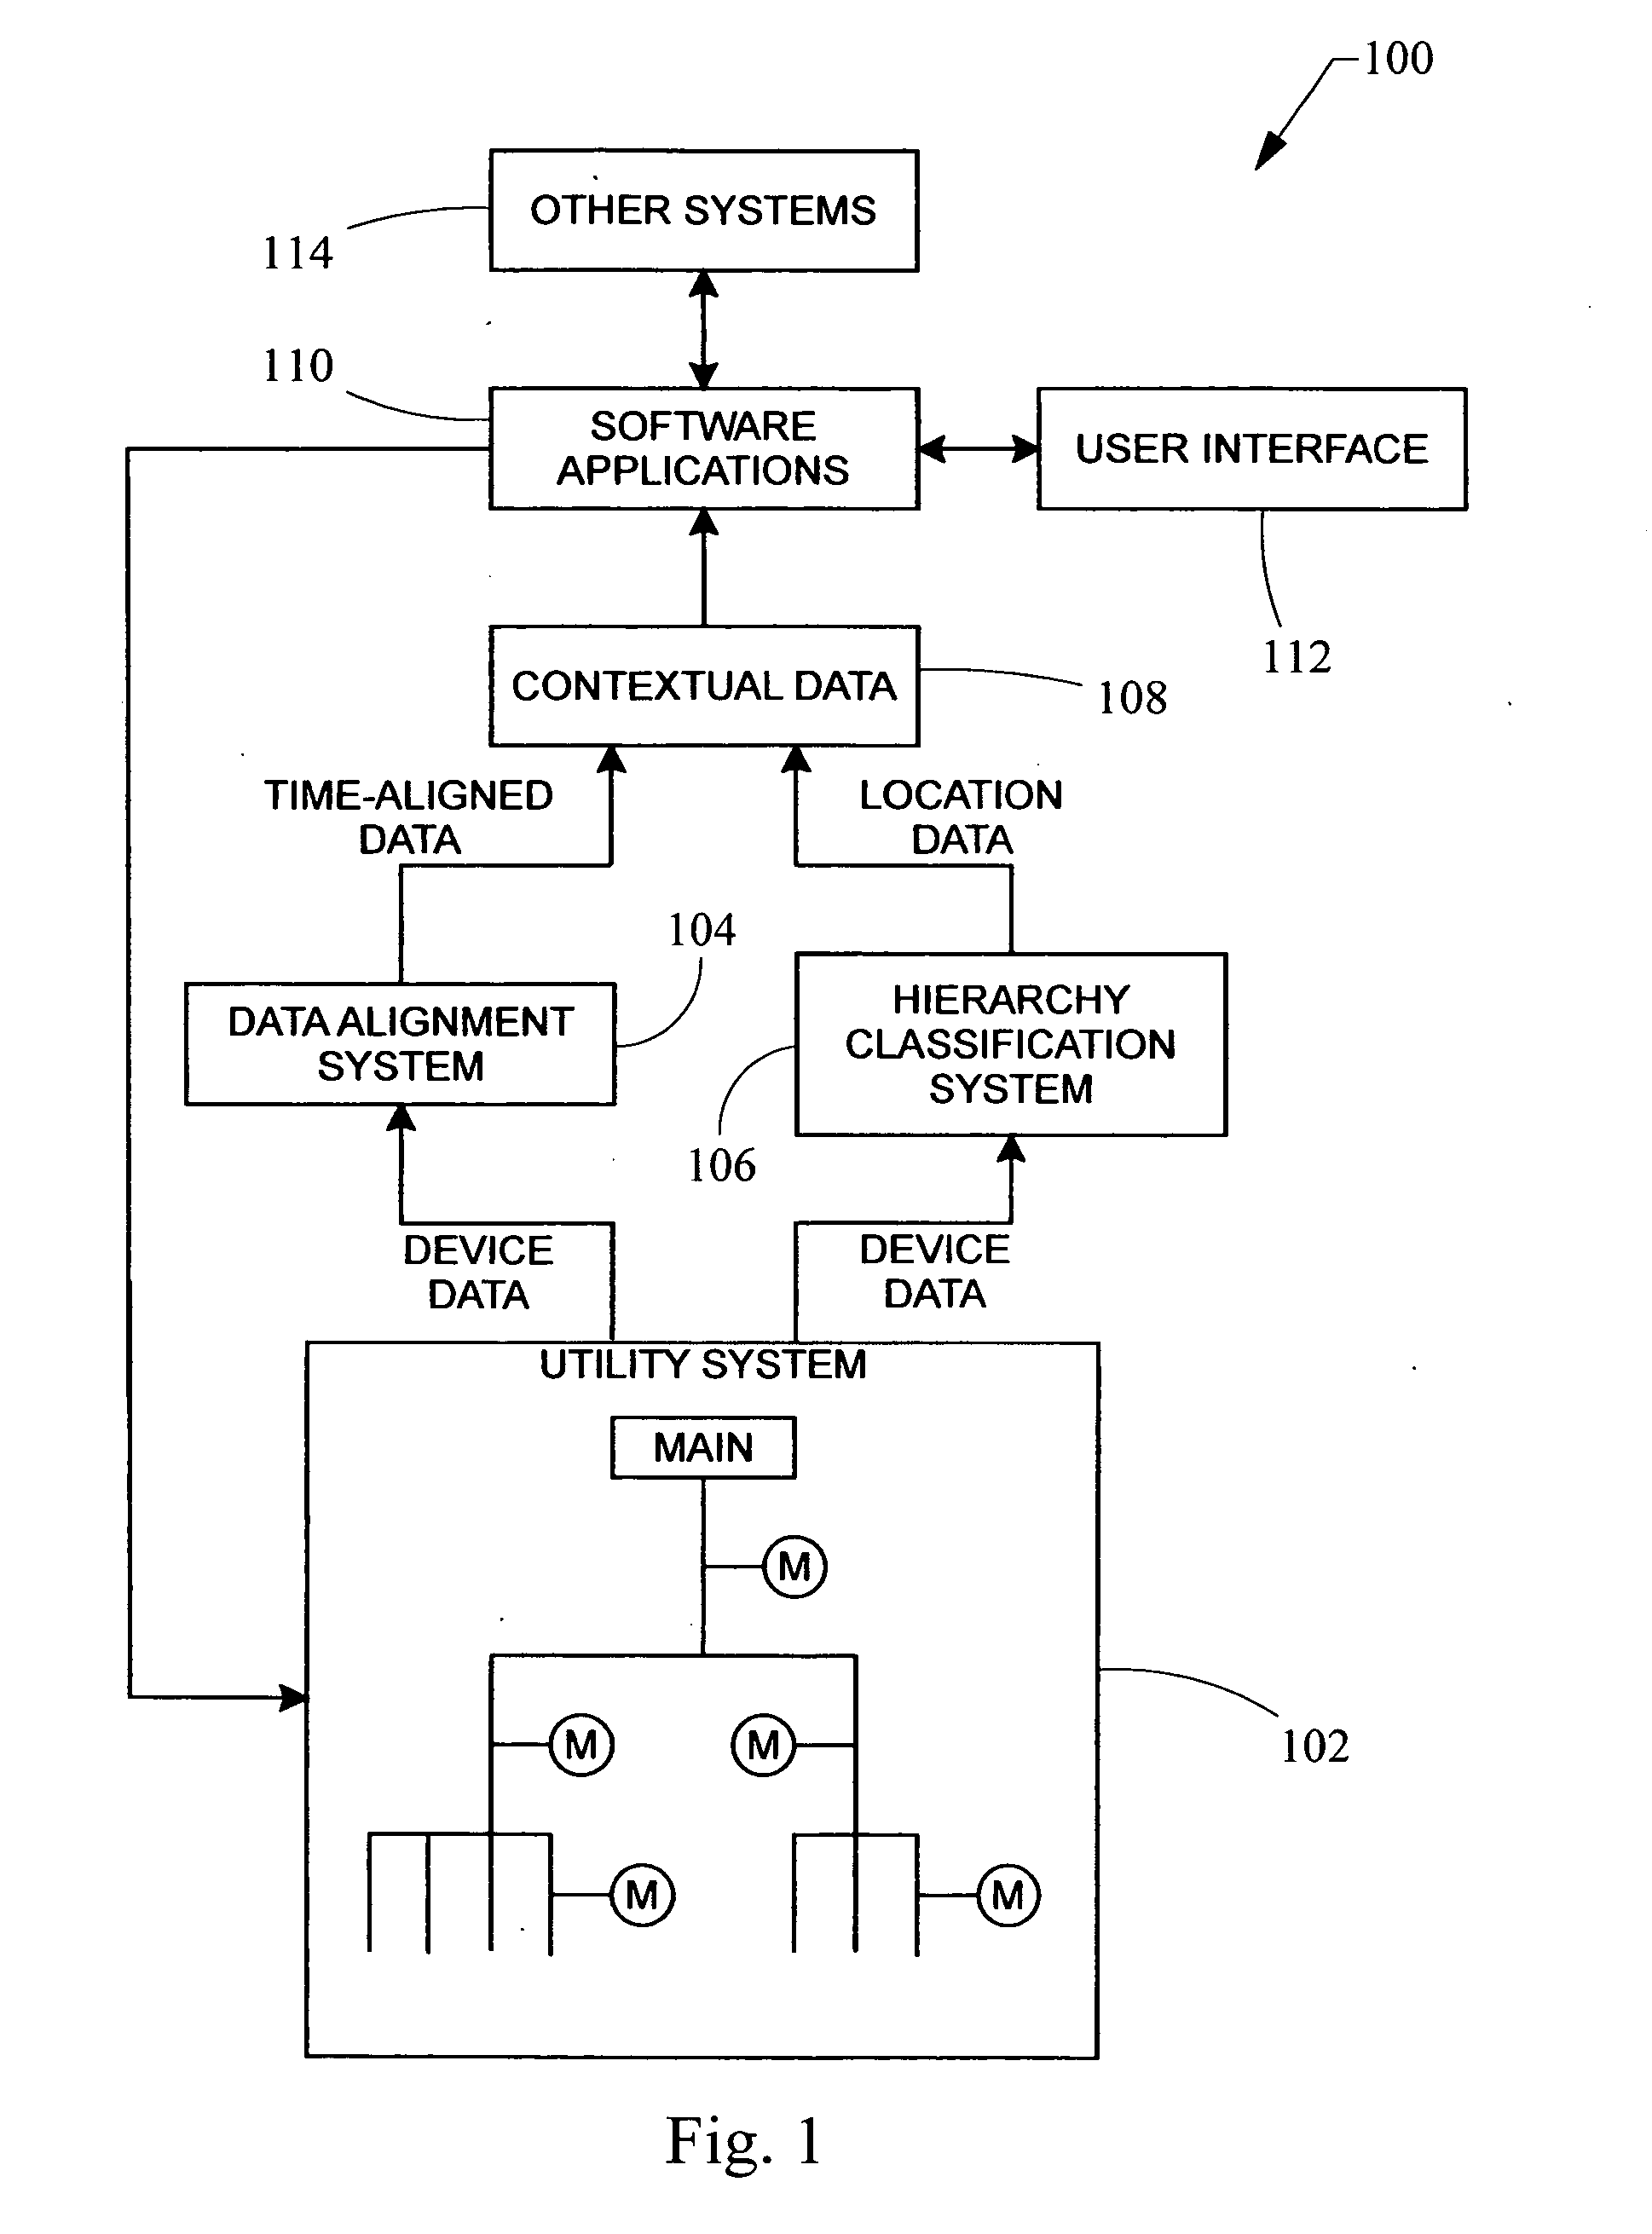
[0035] Turning now to FIG. 1, an automated data integrated monitoring system 100 is generally shown. A utility system 102 having multiple monitoring devices M provides data from each monitoring device M that is communicated to an automated data alignment system 104 and an automated hierarchy classification system 106. The data is aligned automatically in the automated data alignment system 104 in accordance with the present invention and produces data that is aligned such that it represents the data when it was actually seen simultaneously by the monitoring devices M in the power monitoring system 102. The hierarchy classification system 106 automatically learns the hierarchy of monitoring devices present in the utility system 102 and their relationships relative to one another.

[0036] Once the data from each monitoring device M is aligned and each monitoring device's location is known, the data is said to be in context 108. The contextual data 108 can be used by software applicatio...


PUM


Abstract

An auto-learned hierarchy algorithm that learns the hierarchical layout of a power monitoring system. Historical power data from each meter is received and placed into a data table. The main is assumed to be at the top of the hierarchy and is designated as the reference. A check matrix is developed indicating whether a possible connection exists between each meter pair combination. A correlation coefficient matrix (CCM) is calculated based on the data table, and entries in which no connection is possible are zeroed. The column for the reference meter from the CCM is copied to a correlation reference array (CRA), and the meter having the highest correlation with the reference meter in the CRA is marked as connected to the reference meter in a connection table. That meter's power is subtracted from the data table and the procedure is repeated until all meters have been analyzed.

Description

FIELD OF THE INVENTION [0001] The present invention relates generally to utility monitoring systems, and, in particular, to automated precision alignment of data, automated determination of power monitoring system hierarchy, and automated integration of data in a utility monitoring system. BACKGROUND OF THE INVENTION [0002] Since the introduction of electrical power distribution systems in the late 19th century, there has been a need to monitor their operational and electrical characteristics. The ability to collect, analyze, and respond to information about the electrical power system can improve safety, minimize equipment loss, decrease scrap, and ultimately save time and money. To that end, monitoring devices were developed to measure and report such information. With the dawn of the electronics age, the quality and quantity of data from monitoring devices was vastly improved, and communications networks and software were developed to collect, display and store information. Unfor...

Claims


Application Information

Patent Timeline
Patent Type & Authority Applications(United States)
IPC IPC(8): G01R21/00
CPCG01D4/002Y04S20/32Y02B90/241Y04S20/48G01D4/004G01D2204/24G01D2204/47Y02B90/20Y04S20/30
Inventor BICKEL, JON A.CARTER, RONALD W.
Owner SQUARE D CO
Why Eureka
Try Eureka