
Method to Provide Graphical Representation of Sense Through The Wall (STTW) Targets

Inactive Publication Date: 2007-02-15
REALTRONICS CORP
View PDF15 Cites 21 Cited by
  • Summary
  • Abstract
  • Description
  • Claims
  • Application Information

AI Technical Summary

Benefits of technology

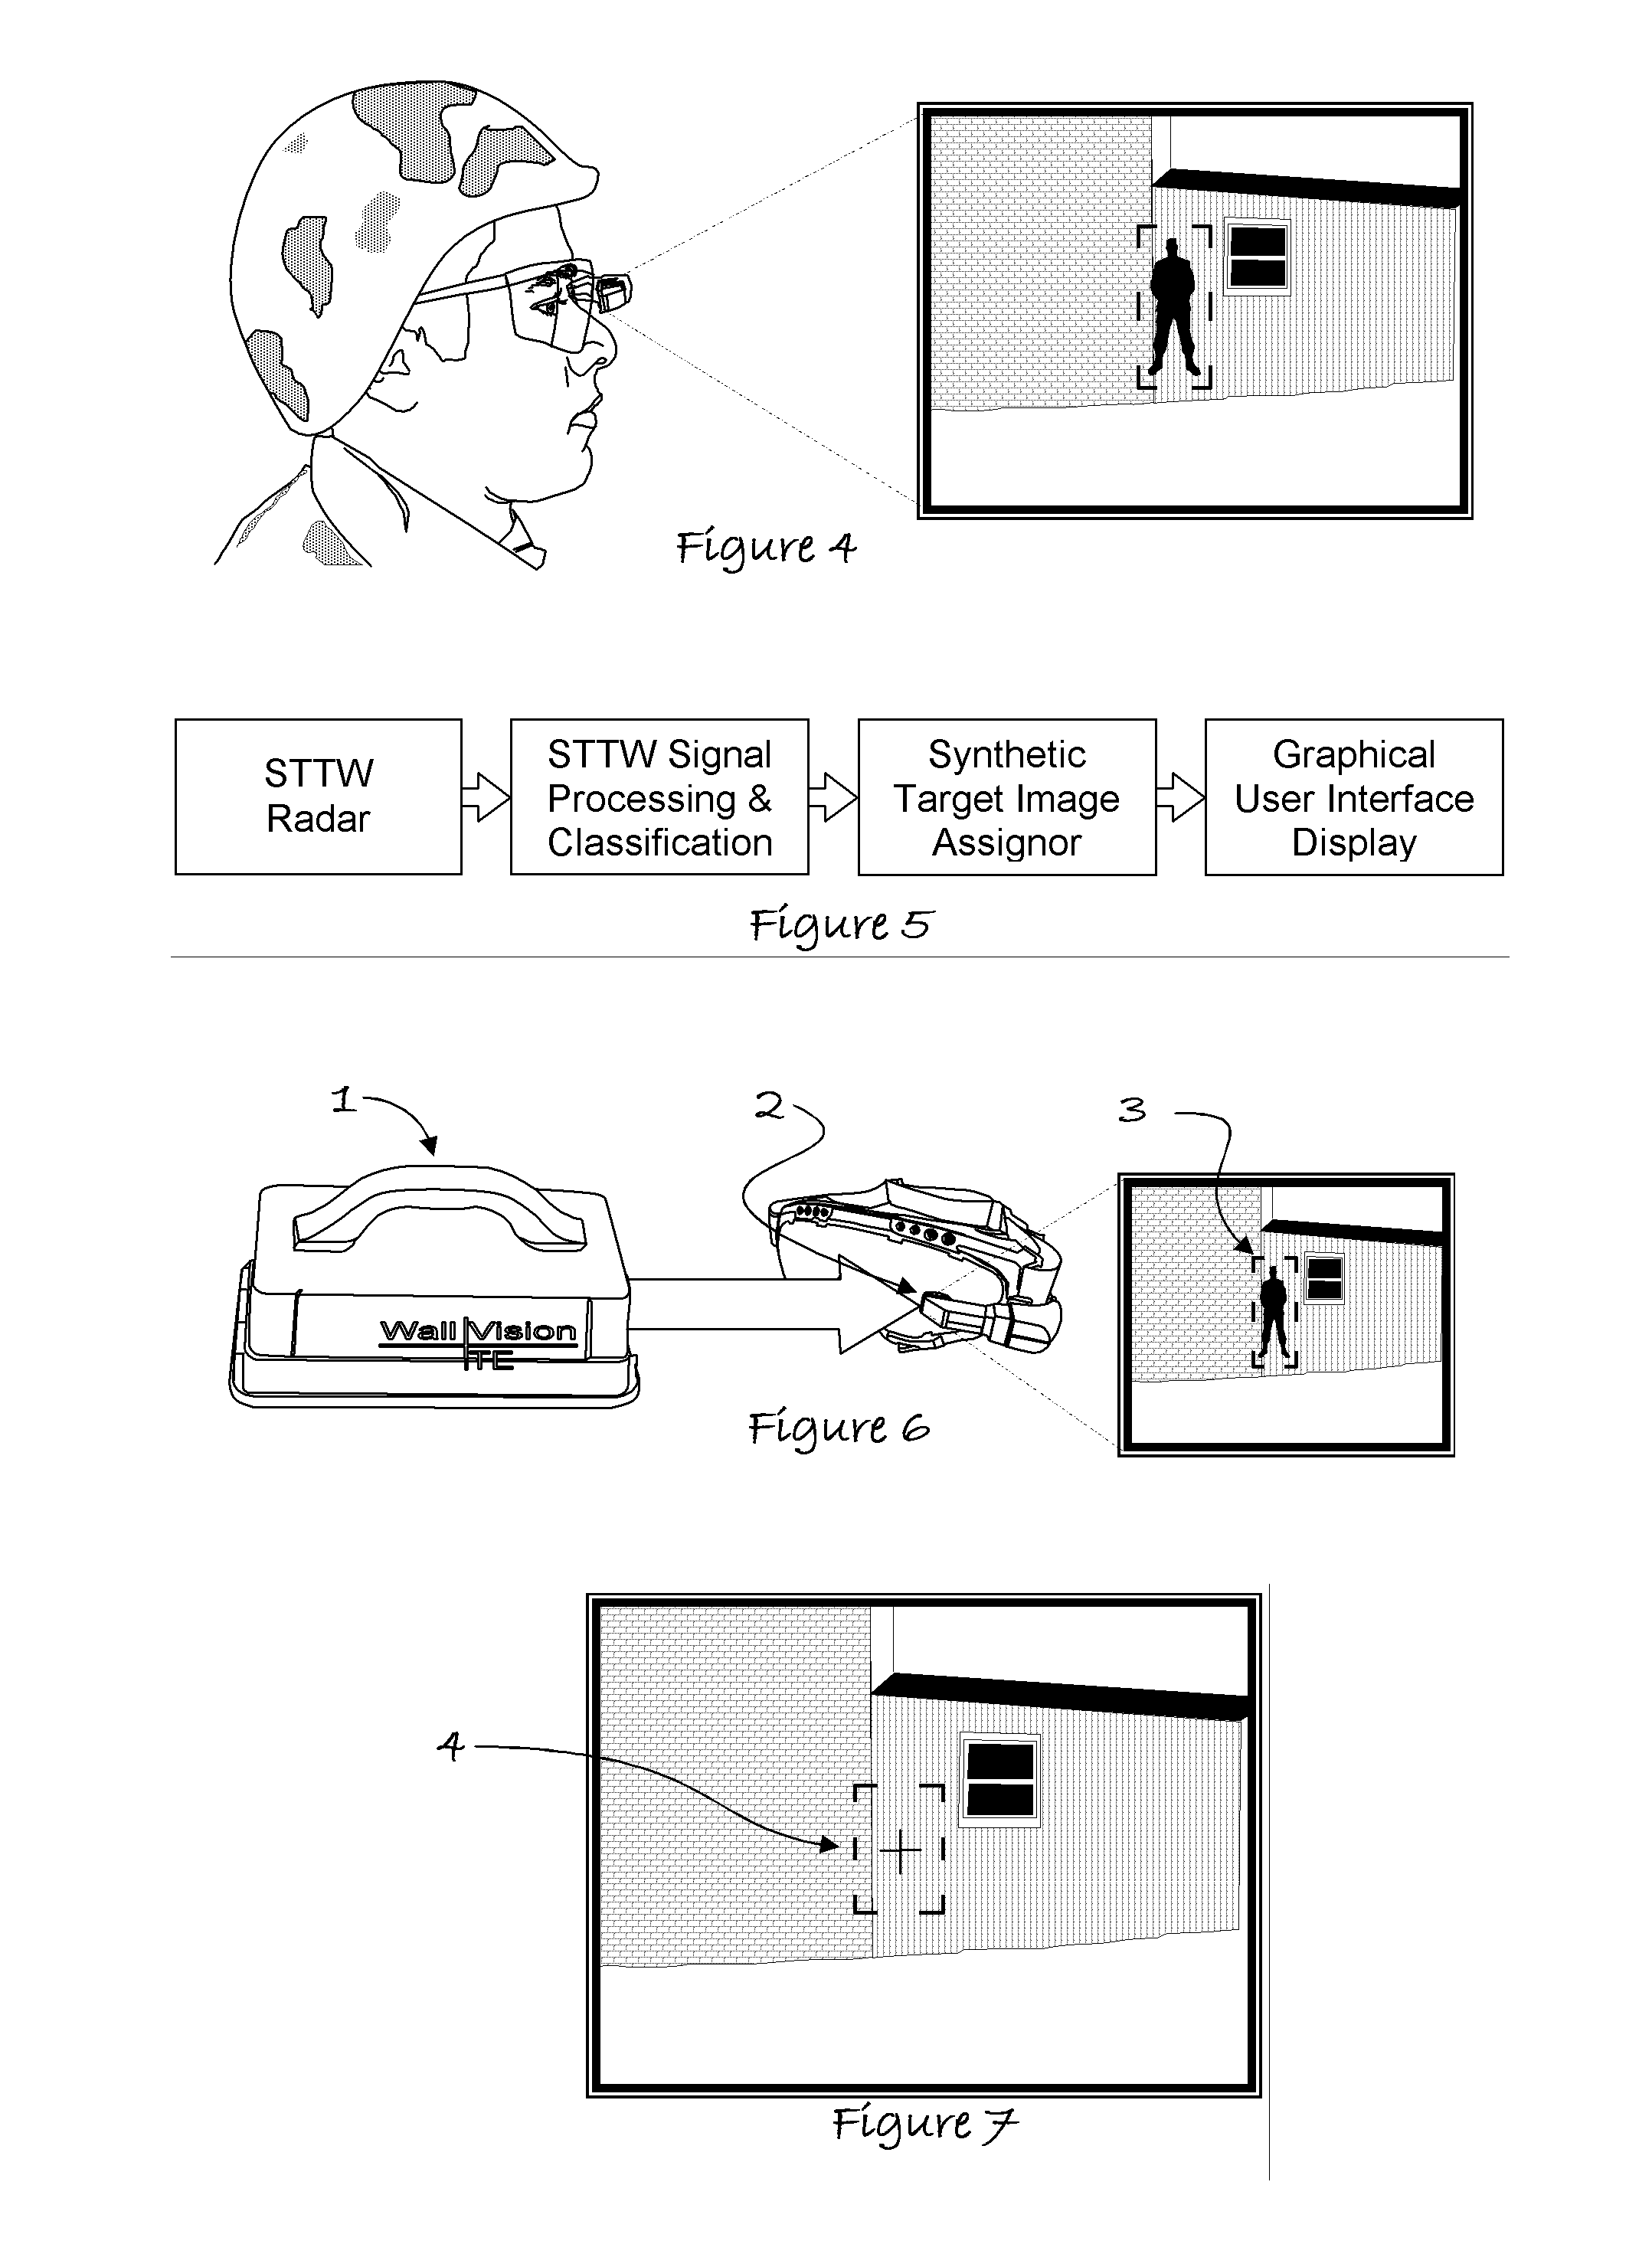
[0007] This invention describes a method to display Sense-Through-The-Wall (STTW) radar data that reduces the burden of skill and focus that is required to interpret the complex user interfaces that comprise the present STTW display state of the art. The disclosed method combines any form of data interpretation such as autocorrelation, statistical classification, biology modeled classifiers, and the like with pixel proper scale and placement of real or synthetic target images to form an intuitive, easily recognizable, visual display that is readily understood by practitioners of the technology. This type of information can be collected from any plurality of STTW sensors and can be displayed on any plurality of LCD panels, PDA devices, VGA displays, helmet mounted displays, and any other type of display.

Problems solved by technology

While STTW systems have evolved during the past decade, these platforms are struggling to achieve market penetration in spite of an extreme demand for the technology.
One of the largest barriers to widespread acceptance of STTW systems is the accompanying burden of expertise, focus, and response time that is needed to interpret the graphical user interfaces that are currently presented to practitioners of the technology.
The quest of providing easy to understand radar visual displays has been an on-going challenge since the infancy of radar in the 1940's.
While prior art adequately describes methods to display user interface data and symbols or icons that represent a target on LCD panels, PDA devices, VGA displays, helmet mounted displays, and any other type of display, even the state of the art lacks a method that specifically enables STTW platforms to convey complex radar data in a format that is easy to understand.
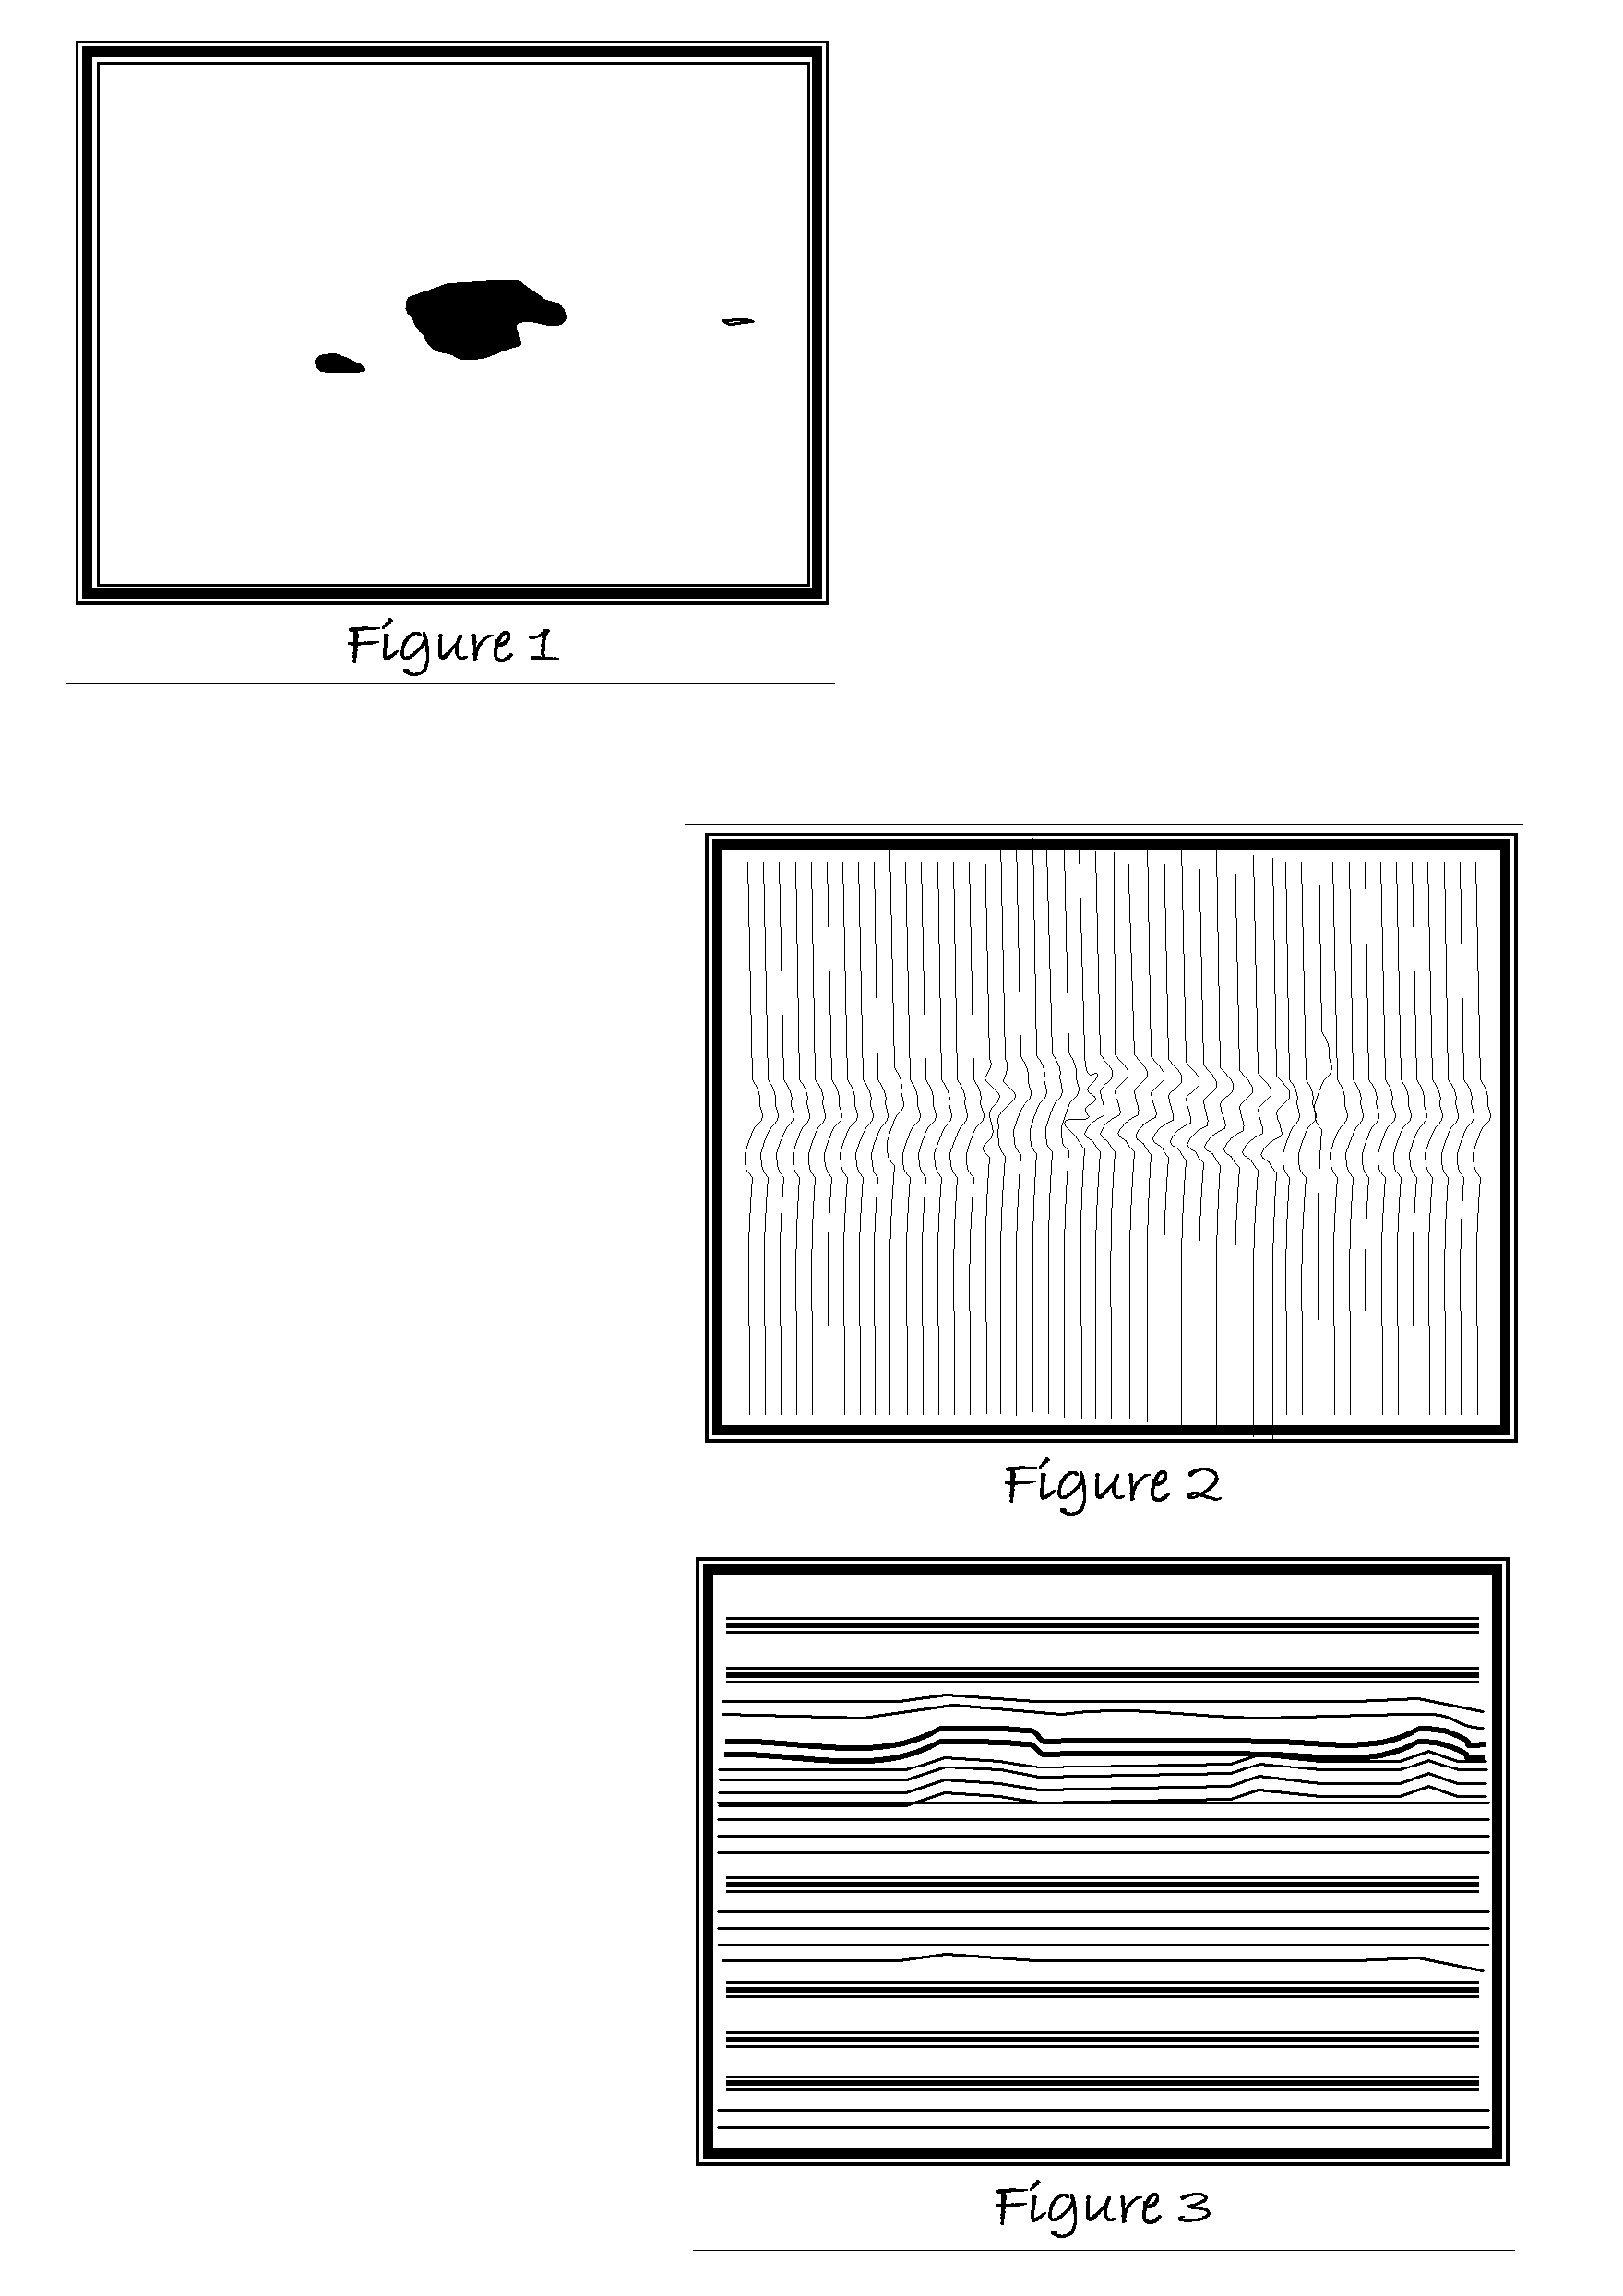
Consequently, the state of the art presents complex visual displays like those that are shown in FIGS. 1 through 4, which tend to distract practitioners of the technology from the focus of their mission.

Method used

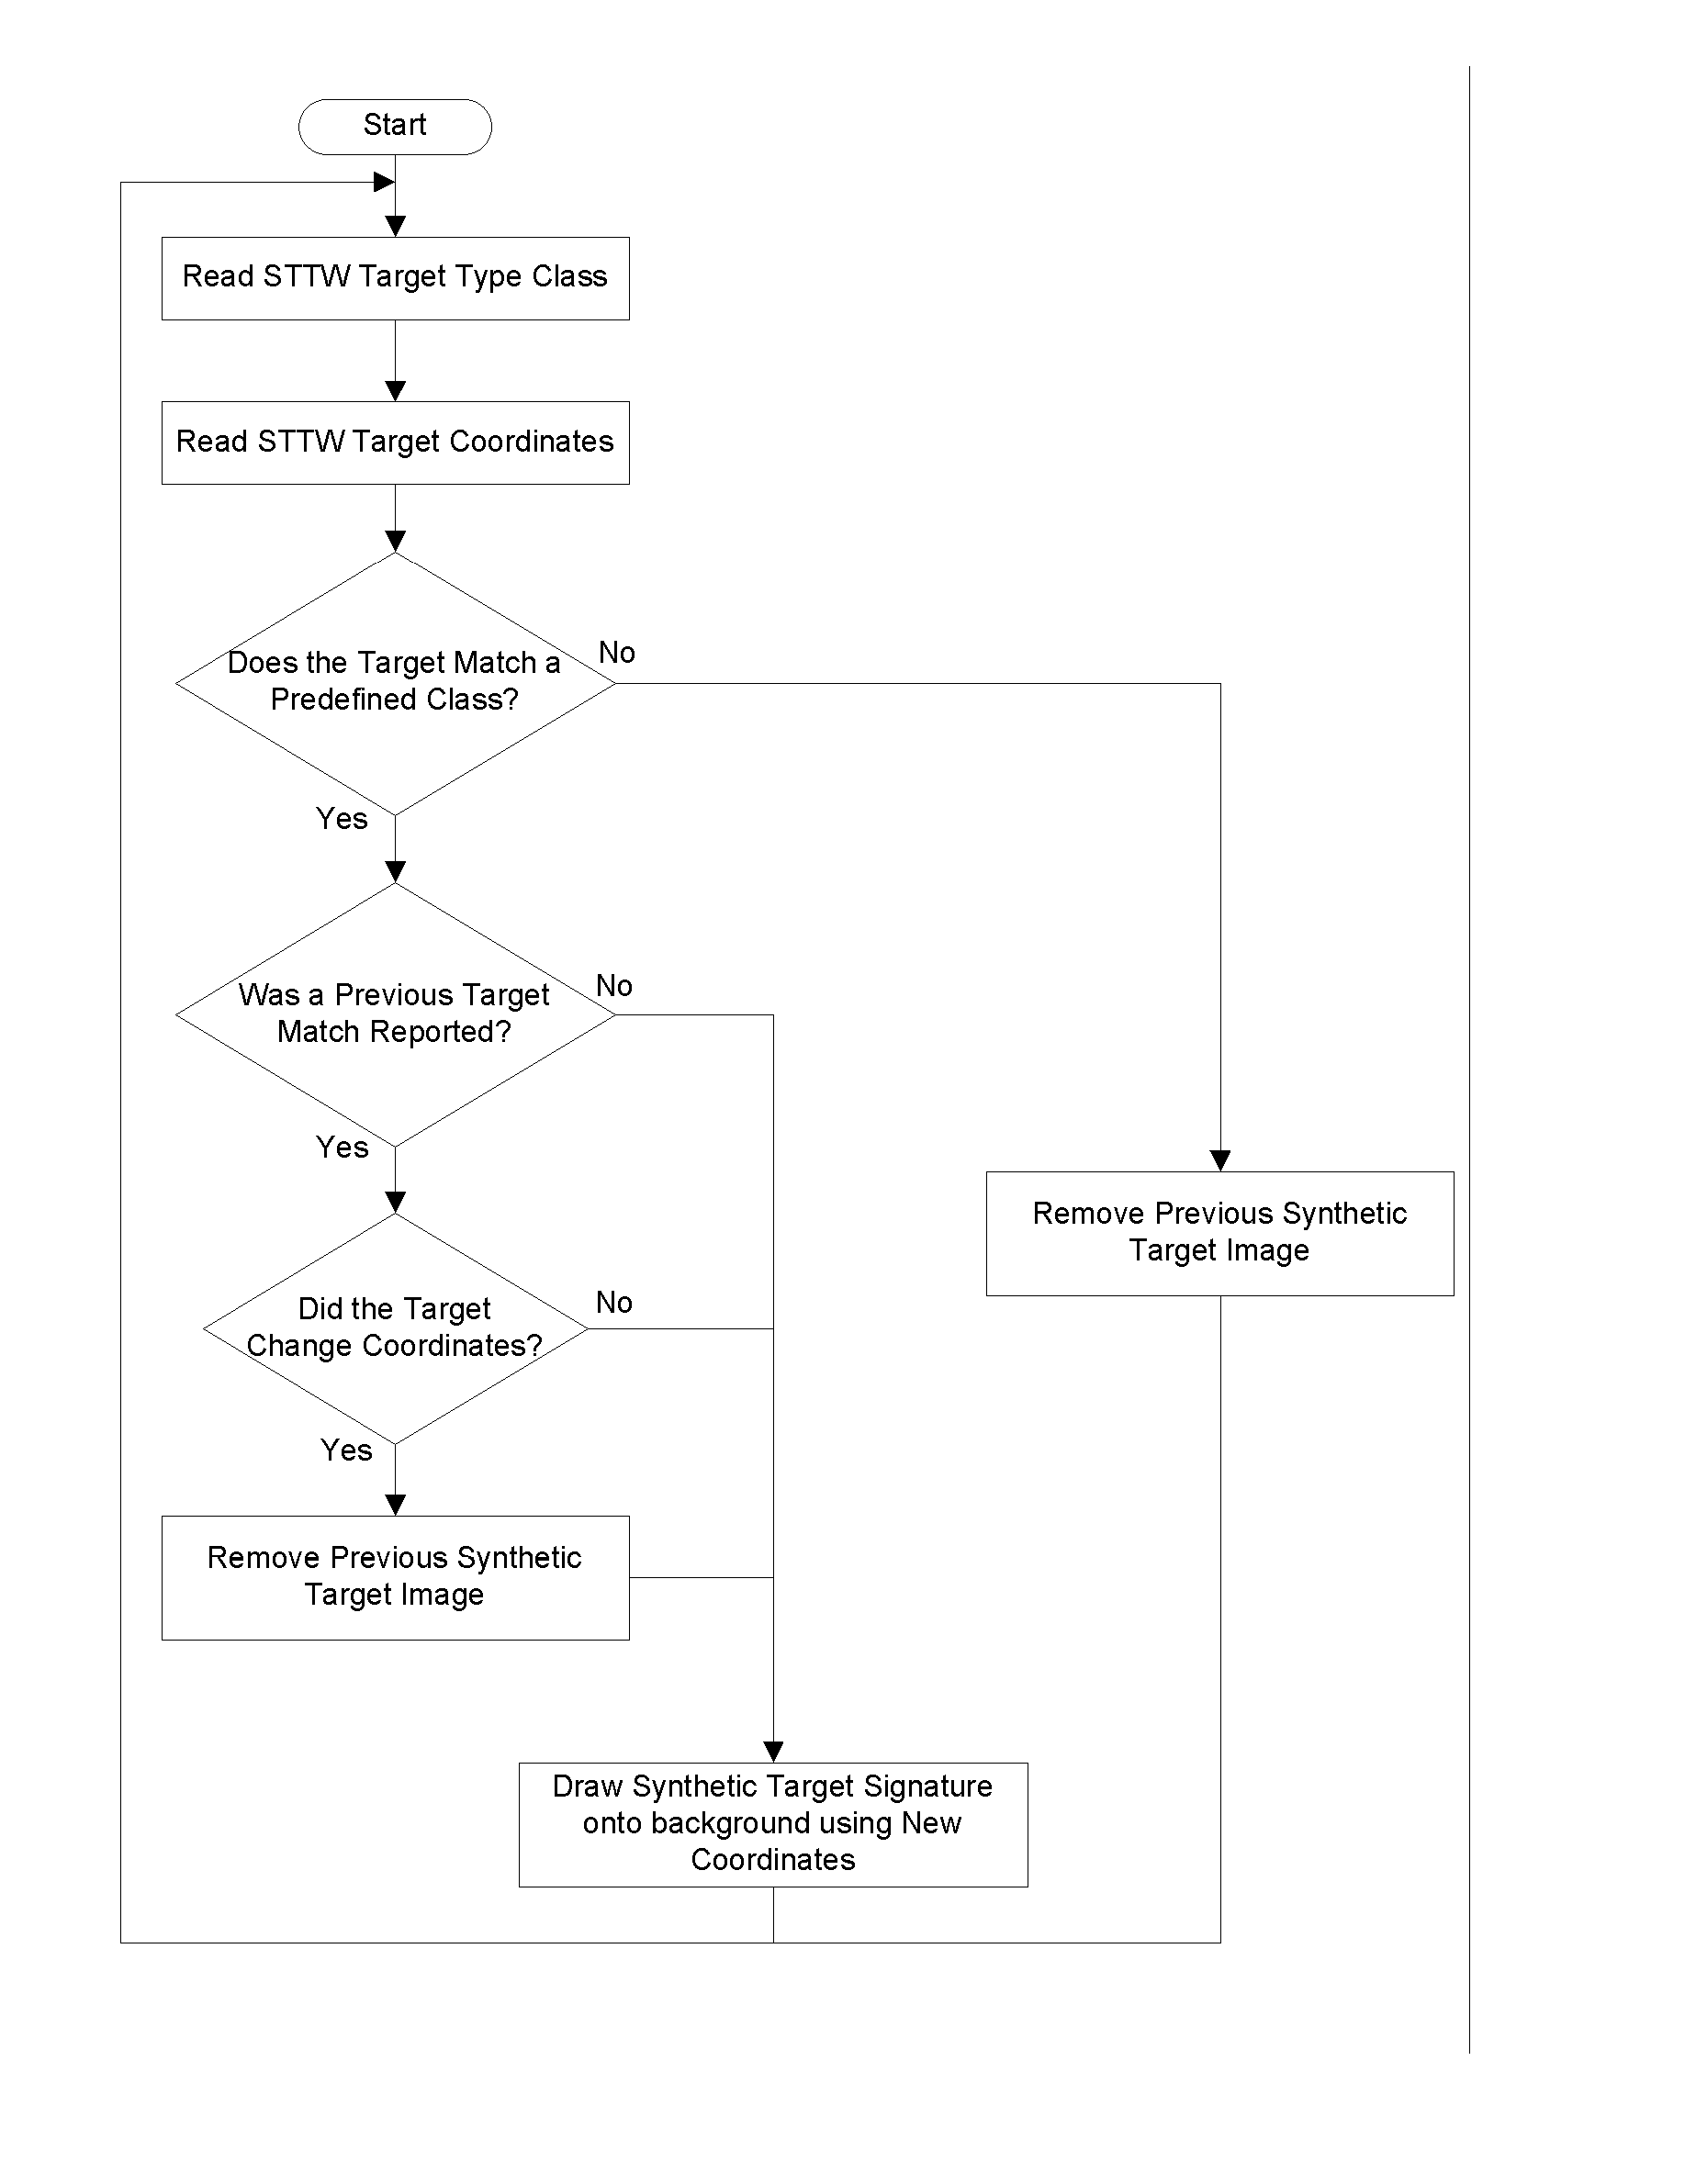

Image

  • Method to Provide Graphical Representation of Sense Through The Wall (STTW) Targets
  • Method to Provide Graphical Representation of Sense Through The Wall (STTW) Targets
  • Method to Provide Graphical Representation of Sense Through The Wall (STTW) Targets

Examples


Embodiment Construction

[0020] This invention is intended to improve the marketability of sense through the wall (STTW) systems by devising a method to display images that are easier to understand than the radar speckle, target blob, wiggle plot, and horizontal amplitude intensity displays that are used by the current state of the art and shown by example in FIGS. 1 through 3. The goal here is to make it easier for an STTW operator to rapidly understand, recognize, or respond to an object that is detected by the radar. In order to achieve the above and other objectives, the scope and spirit of this invention encompasses any method or device that combines Sense-Through-The-Wall (STTW) radar data interpretation such as autocorrelation, statistical classification, biology modeled classifiers, and the like with 1D, 2D, and 3D graphical methods cause any type of display device to present intuitive information that is based on the composition of the detected target.

[0021] The components of a preferred embodimen...


PUM


Abstract

A method to present easily understood images that represent targets that are detected through walls or other opaque barriers is disclosed. This method is particularly well suited for sense-through-the-wall radar systems. One of the main challenges of evolving STTW systems is that the practitioners of the technology are generally presented with complicated images to represent the gain adjusted amplitude of signals that are detected by the radar. Interpretation of images from prior art, which can be in the form of the radar speckle, target blob, wiggle plot, and horizontal amplitude intensity displays, shown in FIGS. 1 through 3, requires high levels of skill, focus, and time. Naturally, the foregoing places military and law-enforcement customers of the technology at considerable risk during hostile missions. This invention discloses a method that converts a typical radar signal into an image that is easily understood by a practitioner of STTW technology. This invention improves prior art by employing any combination of radar data interpretation with any combination of video feed overlay, hologram, target silhouettes, lines, borders, colored target representations and the like to concisely report target information to a STTW device operator.

Description

BACKGROUND OF THE INVENTION [0001] This invention relates to visual improvements to Sense Through The Wall (STTW) radar displays. In the post 9-11 era, there is a growing need for STTW technologies to support urban combat, Special Forces, tactical entry, homeland security, law enforcement, fire protection, and search and rescue. While STTW systems have evolved during the past decade, these platforms are struggling to achieve market penetration in spite of an extreme demand for the technology. One of the largest barriers to widespread acceptance of STTW systems is the accompanying burden of expertise, focus, and response time that is needed to interpret the graphical user interfaces that are currently presented to practitioners of the technology. The method disclosed herein causes a computer, embedded microprocessor, and the like to employ the output results of STTW radar signal classification algorithms to select and display an image that represents the target that is detected on th...

Claims


Application Information

Patent Timeline
IPC IPC(8): G01S13/88G01S13/89G01V3/12
CPCG01S7/22G01S13/89G01S13/888G01S7/411
Inventor THOMPSON, SCOTT RANDALLASKILDSEN, BERNT ASKILD
Owner REALTRONICS CORP
Learn More