

Power supply system
- Summary
- Abstract
- Description
- Claims
- Application Information
AI Technical Summary
Benefits of technology
Problems solved by technology
Method used
Image

Examples
first embodiment
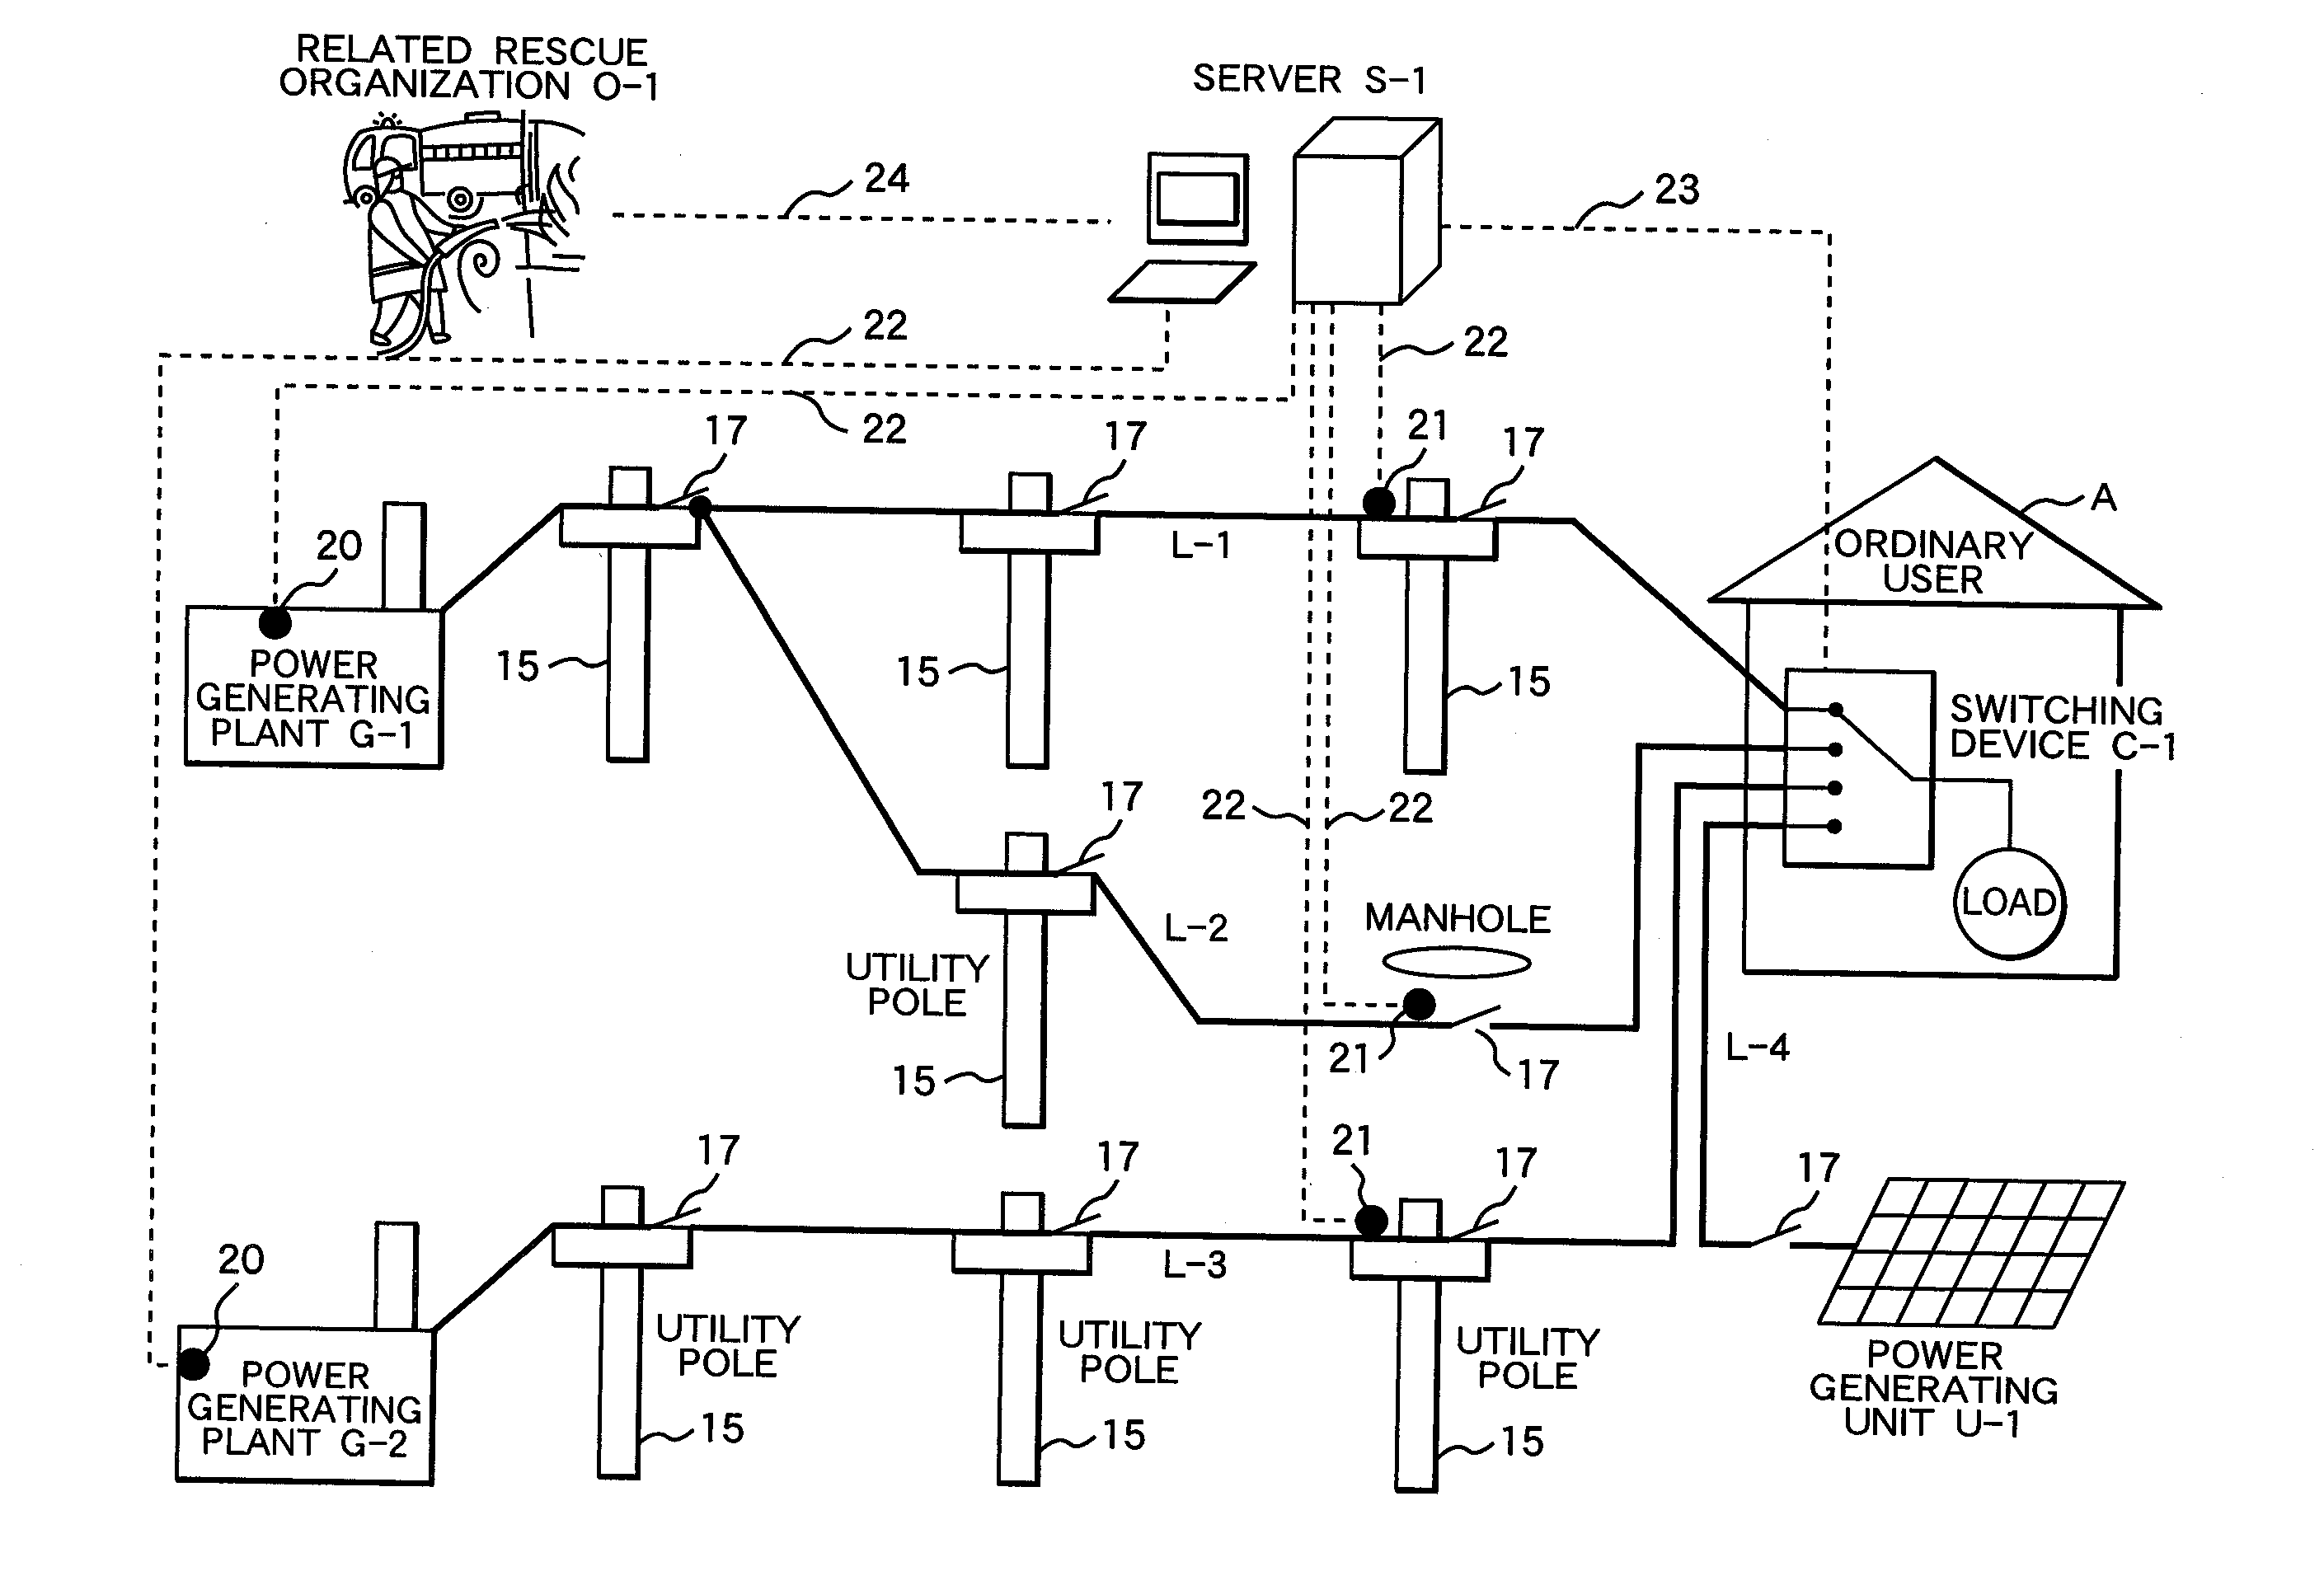
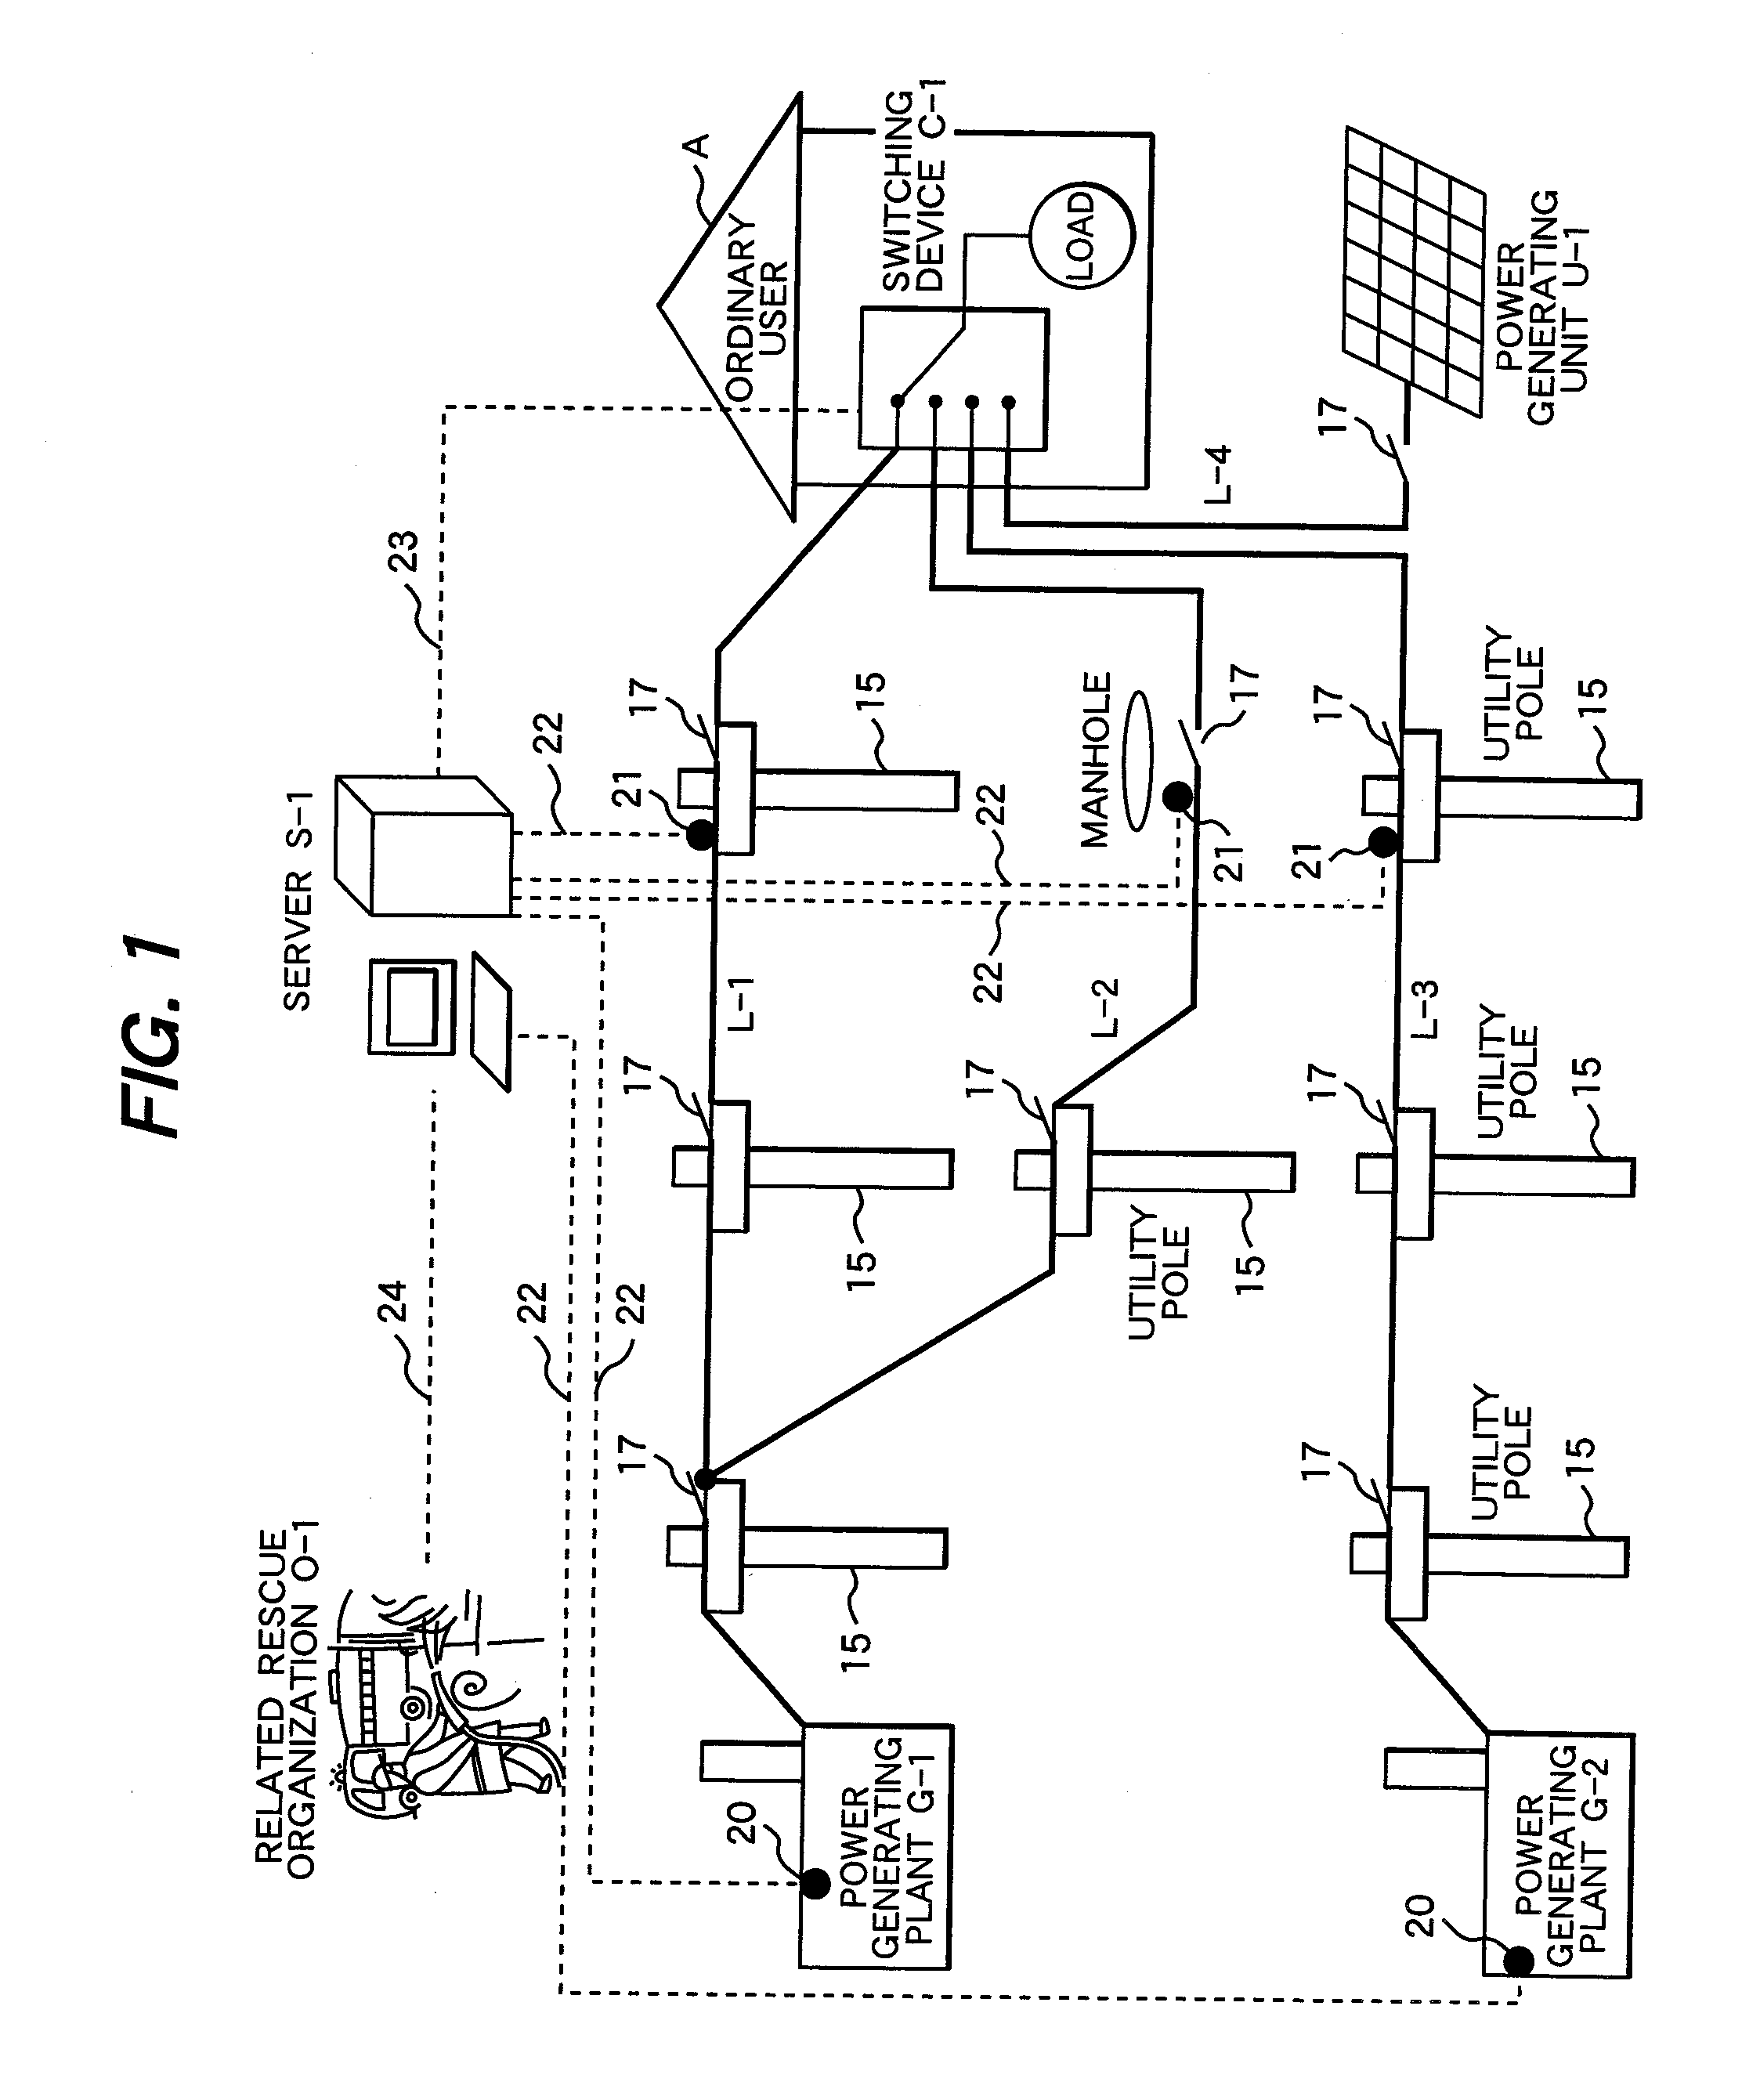
[0034]FIG. 1 shows the entire structure of a power supply system according to a first embodiment of the present invention. The power supply system in the first embodiment is intended for relatively small-scale ordinary users. The power supply system has a plurality of power generating plants (two power generating plants G-1 and G-2 in the figure). A power generating unit U-1 is a small-scale power generating facility, such as fuel cells, a photovoltaic power generating facility, or a wind power facility, provided at the site of a user A. The power generating plant G-1 is connected to a plurality of electric transmission / distribution lines (simply referred to below as lines); two lines L-1 and L-2 are connected in the figure. An electric transmission / distribution line includes an electric transmission line and an electric distribution line. The power generating plant G-2 is connected to a line L-3. The lines L-1 to L-3 are routed over utility poles 15 and manhole-and other power dist...
second embodiment
[0087] The examples in the first embodiment described above have been applied to power supply systems intended for relatively small-scale ordinary users. However, the present invention is not limited to them; it should be understood that the present invention can also be applied to power supply systems intended for so-called large-scale users.
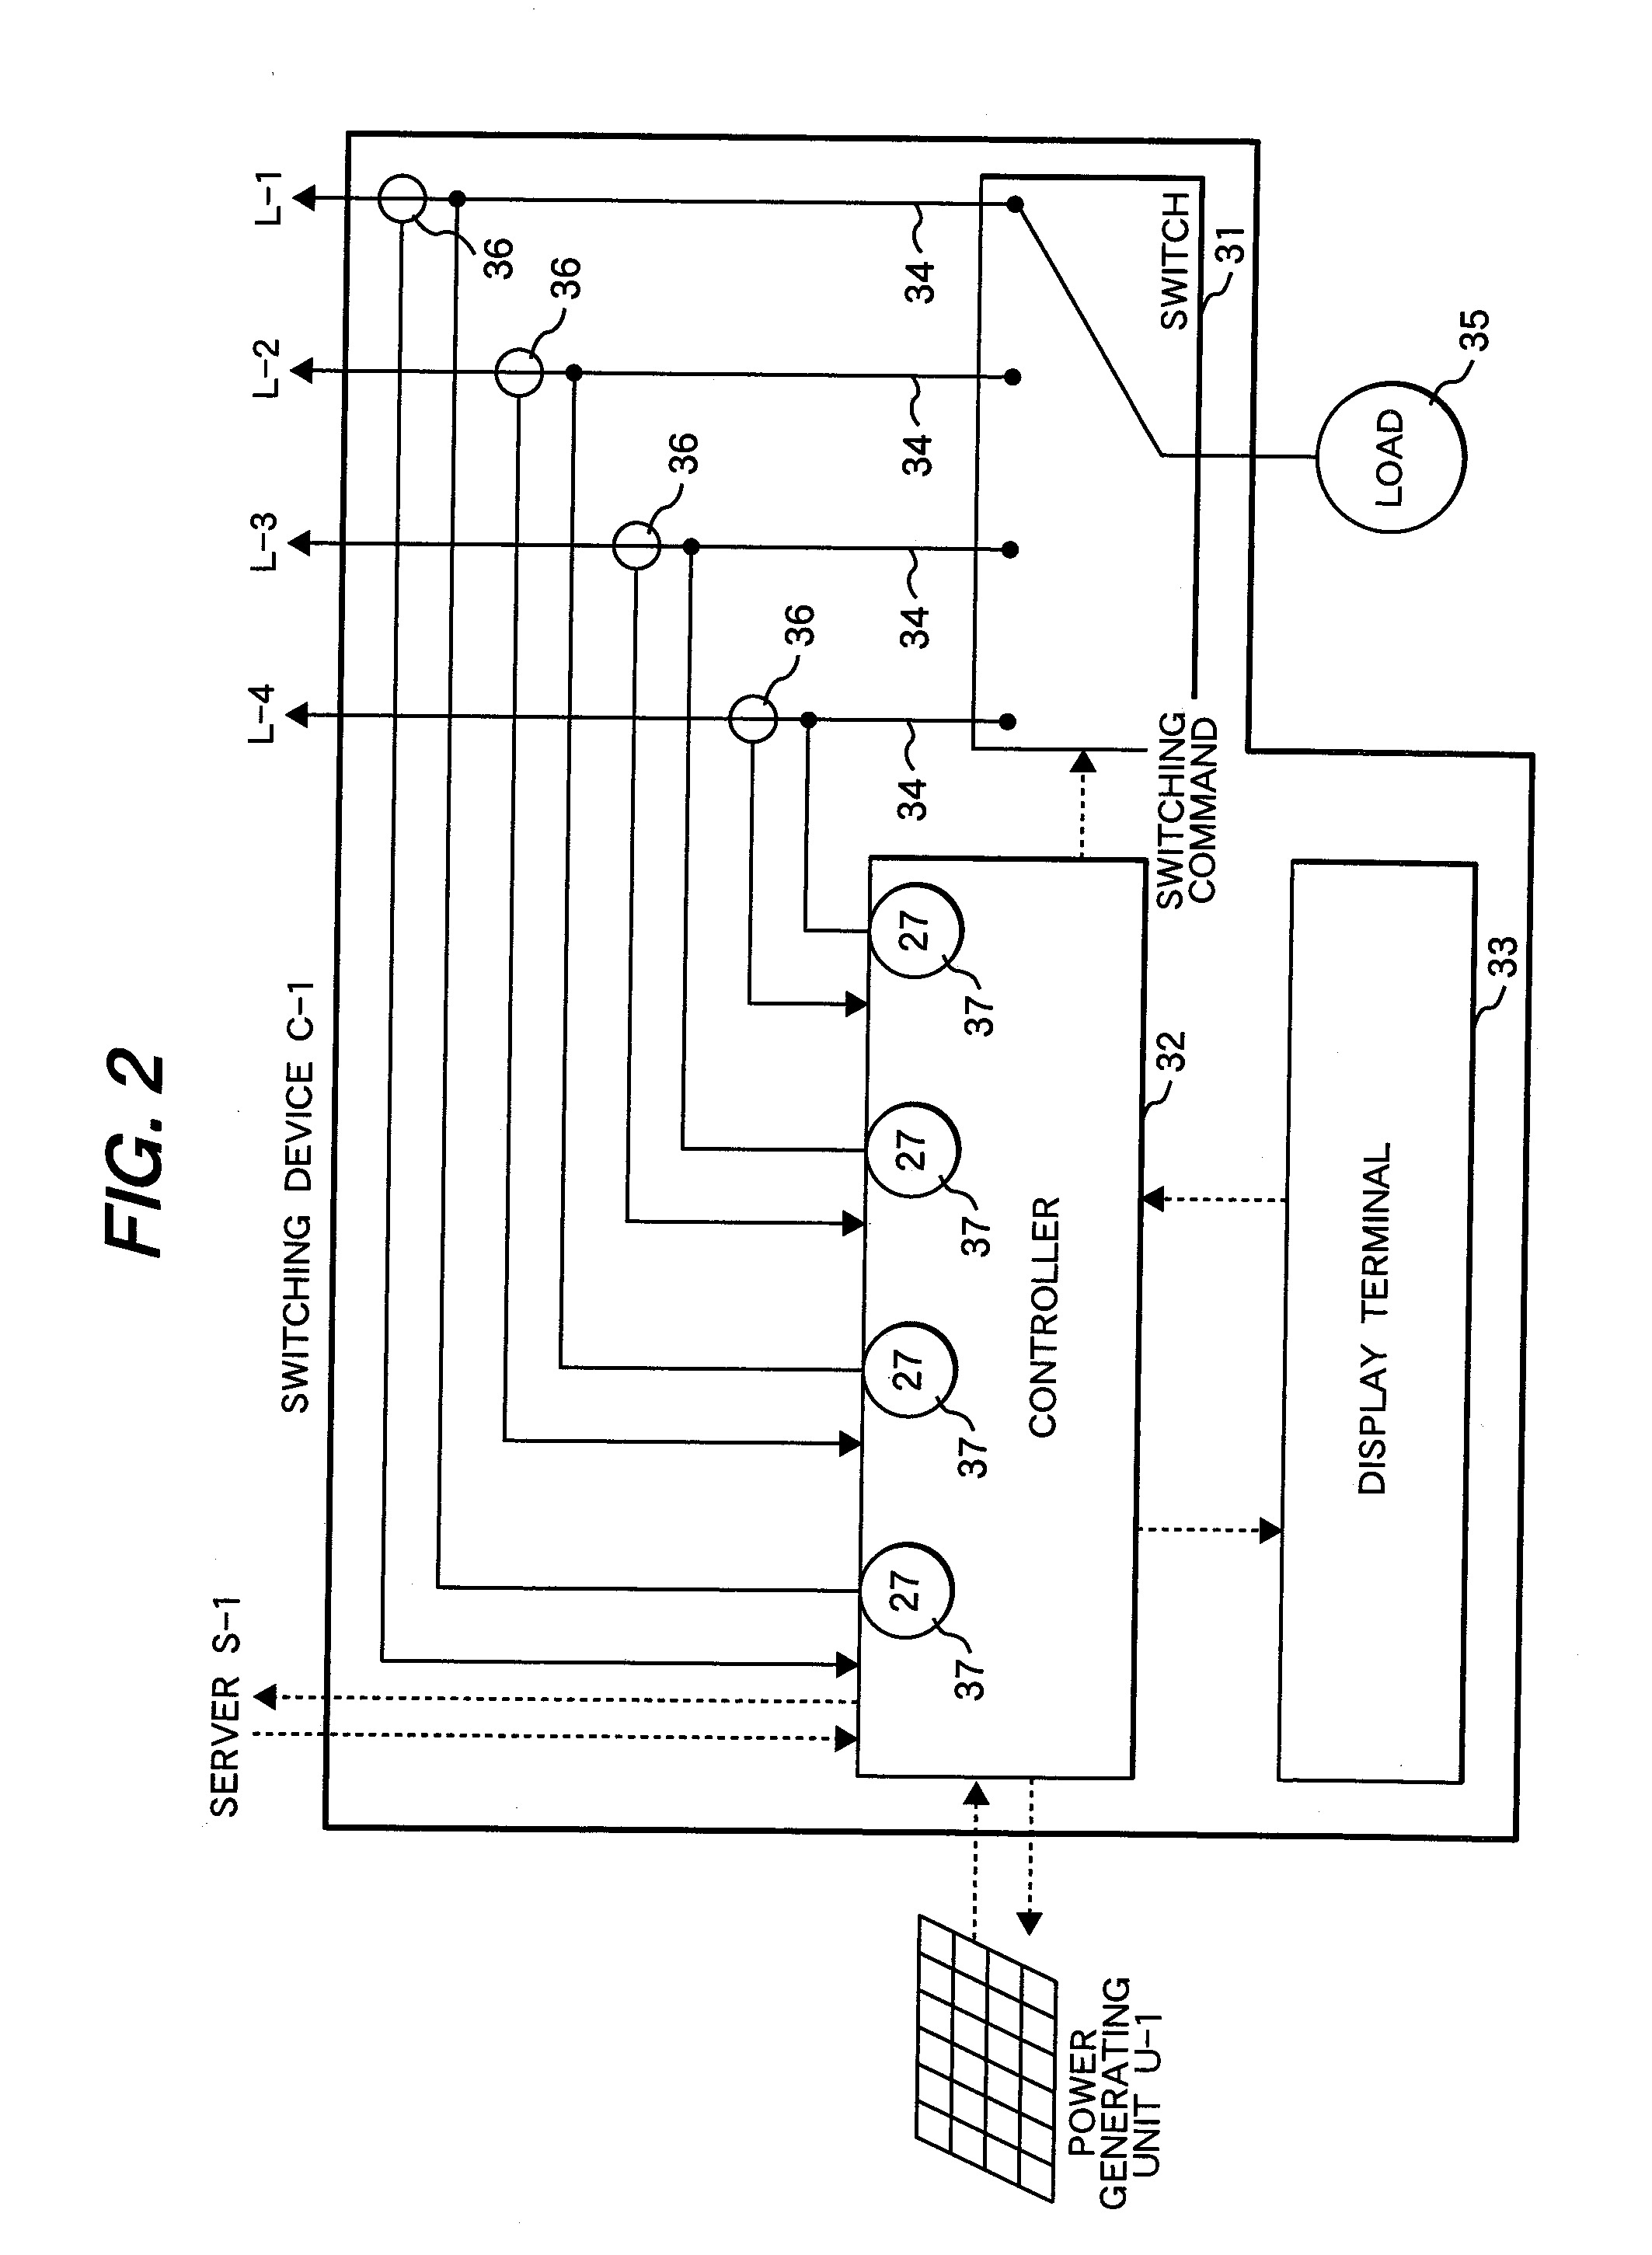
[0088]FIG. 8 shows the configuration of the systems of a power supply system intended for large-scale users. The second embodiment is essentially the same as the first embodiment in FIG. 1 except that the voltage levels on the power systems are high and the amount of power is large, so a description of the second embodiment will be omitted by assigning the same reference numerals to the same components as in the first embodiment.
third embodiment
[0089] Next, specific examples for the abnormality detector 21 on the line L-1 to L-3 which are applied to the power supply systems in the above first and second embodiments and for the methods of calculating predicted recovery times will be described.
PUM
 Abstract
Description
Claims
Application Information