Method and computer program product for measuring and utilizing efficiency of medical resource and services providers

a technology applied in the field of method and computer program products for measuring and utilizing can solve the problems of inability to distinguish utilization from price and place of actual drivers of service cost, inability to develop a scale that is independent of price, and inability to accurately measure the efficiency of medical resources and services providers

Active Publication Date: 2007-06-21
GROUP HEALTH PLAN
View PDF7 Cites 61 Cited by
  • Summary
  • Abstract
  • Description
  • Claims
  • Application Information

AI Technical Summary

Benefits of technology

[0024] Another object of the present invention is to provide a measurement of ef...

Problems solved by technology

One of many major challenges facing risk-bearing payer organizations in today's managed healthcare environment is to find a way to accurately measure resource use for medical procedures/treatment plan options and services independent of pricing.
Developing a scale that is independent of price is relatively difficult.
Thus, utilization is difficult to distinguish from price and place of...

Method used


Image

  • Method and computer program product for measuring and utilizing efficiency of medical resource and services providers
  • Method and computer program product for measuring and utilizing efficiency of medical resource and services providers
  • Method and computer program product for measuring and utilizing efficiency of medical resource and services providers

Examples


example 1

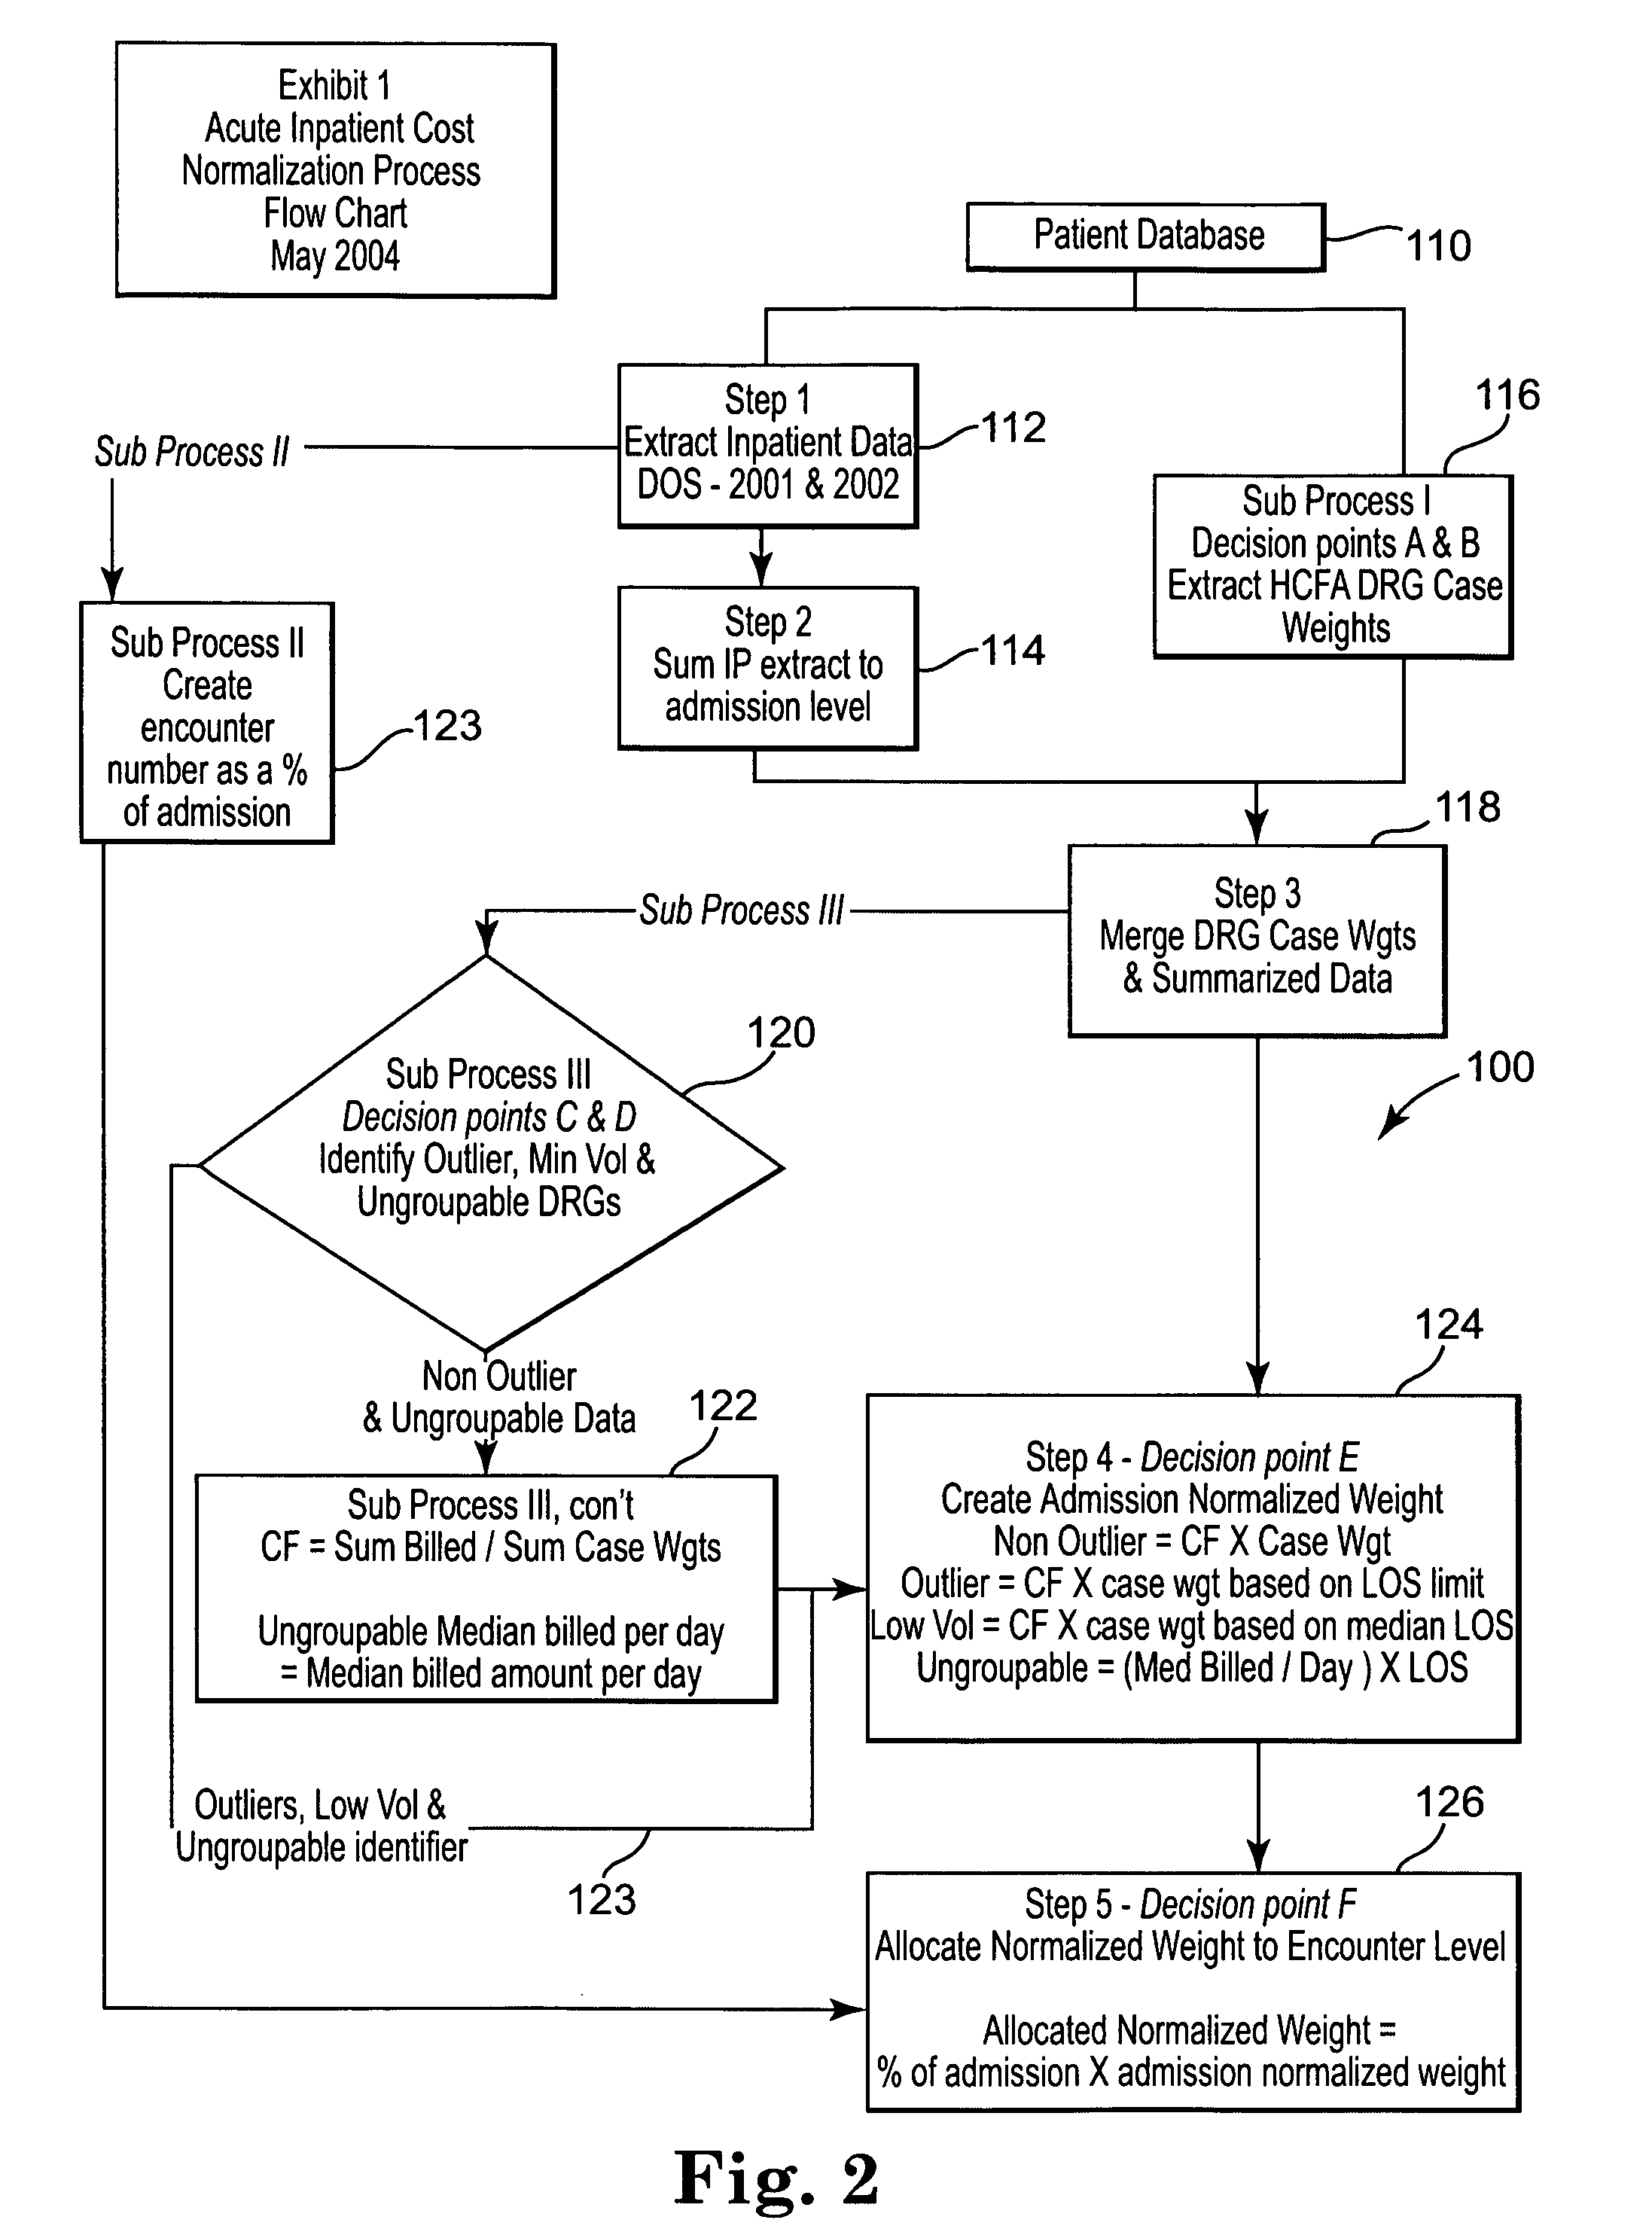
Inpatient Acute Cost Normalization

[0122] With specific reference to FIG. 2, and in accordance with steps 112 and 123 therein, the following exemplary data is provided:

DRGAdmit% ofCodeAdmission #FacilityEncounter #CountLOSBilledPaidAdmission4301Hos A1152295160621.74301Hos A20188262578378.3

[0123] Next, in accordance with steps 114, 116 and 118 wherein the data is summed to the admission level, merged on weights and the total DRG case data weight is calculated using the formula:

Total Weight=DRG Day 1 Weight=((LOS−1)×DRG Day 2 Weight.

DRGDRG Day 1DRG Day 2AdmitTotalCodeAdmission #FacilityWeightWeightCountBilledPaidWeight4301Hos A0.48349870.328834811055773897.717863

[0124] The conversion factor may now be calculated according to step 122 in FIG. 2, utilizing all data in process, excluding outliers and low volume data as described herein.

[0125] Thus, IP Acute Rate: 4,543.21; the Billed Amount is 2,641,762,527; and the total DRG Weights is 581,475.

[0126] Next, the RRV may be calculate...

example 2

Inpatient Non-Acute Cost Normalization

[0129] This example corresponds with FIG. 3.

[0130] The following data is provided with specific reference to reference numerals 212 and 214, wherein the data is extracted from the database and two groupings of data created, either Hospital Based or Skilled Nursing admissions.

AdmitAdmissionEncounter% ofType#Facility#LOSBilledPaidPaidSkilled1Facility1000 0%NurseBSkilled1Facility2000 0%NurseBSkilled1Facility3000 0%NurseBSkilled1Facility4154991164225%NurseBSkilled1Facility52910360317548%NurseBSkilled1Facility6175897186128%NurseB

[0131] Next, the data is summed to admission level using the formula: in accordance with step 216:

Admit TypeAdmission #FacilityEncounter #LOSBilledPaidBilled per daySkilled Nurse1Facility BN / A6121,2486,679.50348.34

[0132] Then, in accordance with step 218, outlier LOS limits may be calculated, not shown here.

[0133] The rate per day may then be calculated using all data, exclusive of outliers and low volume data as descr...

example 3

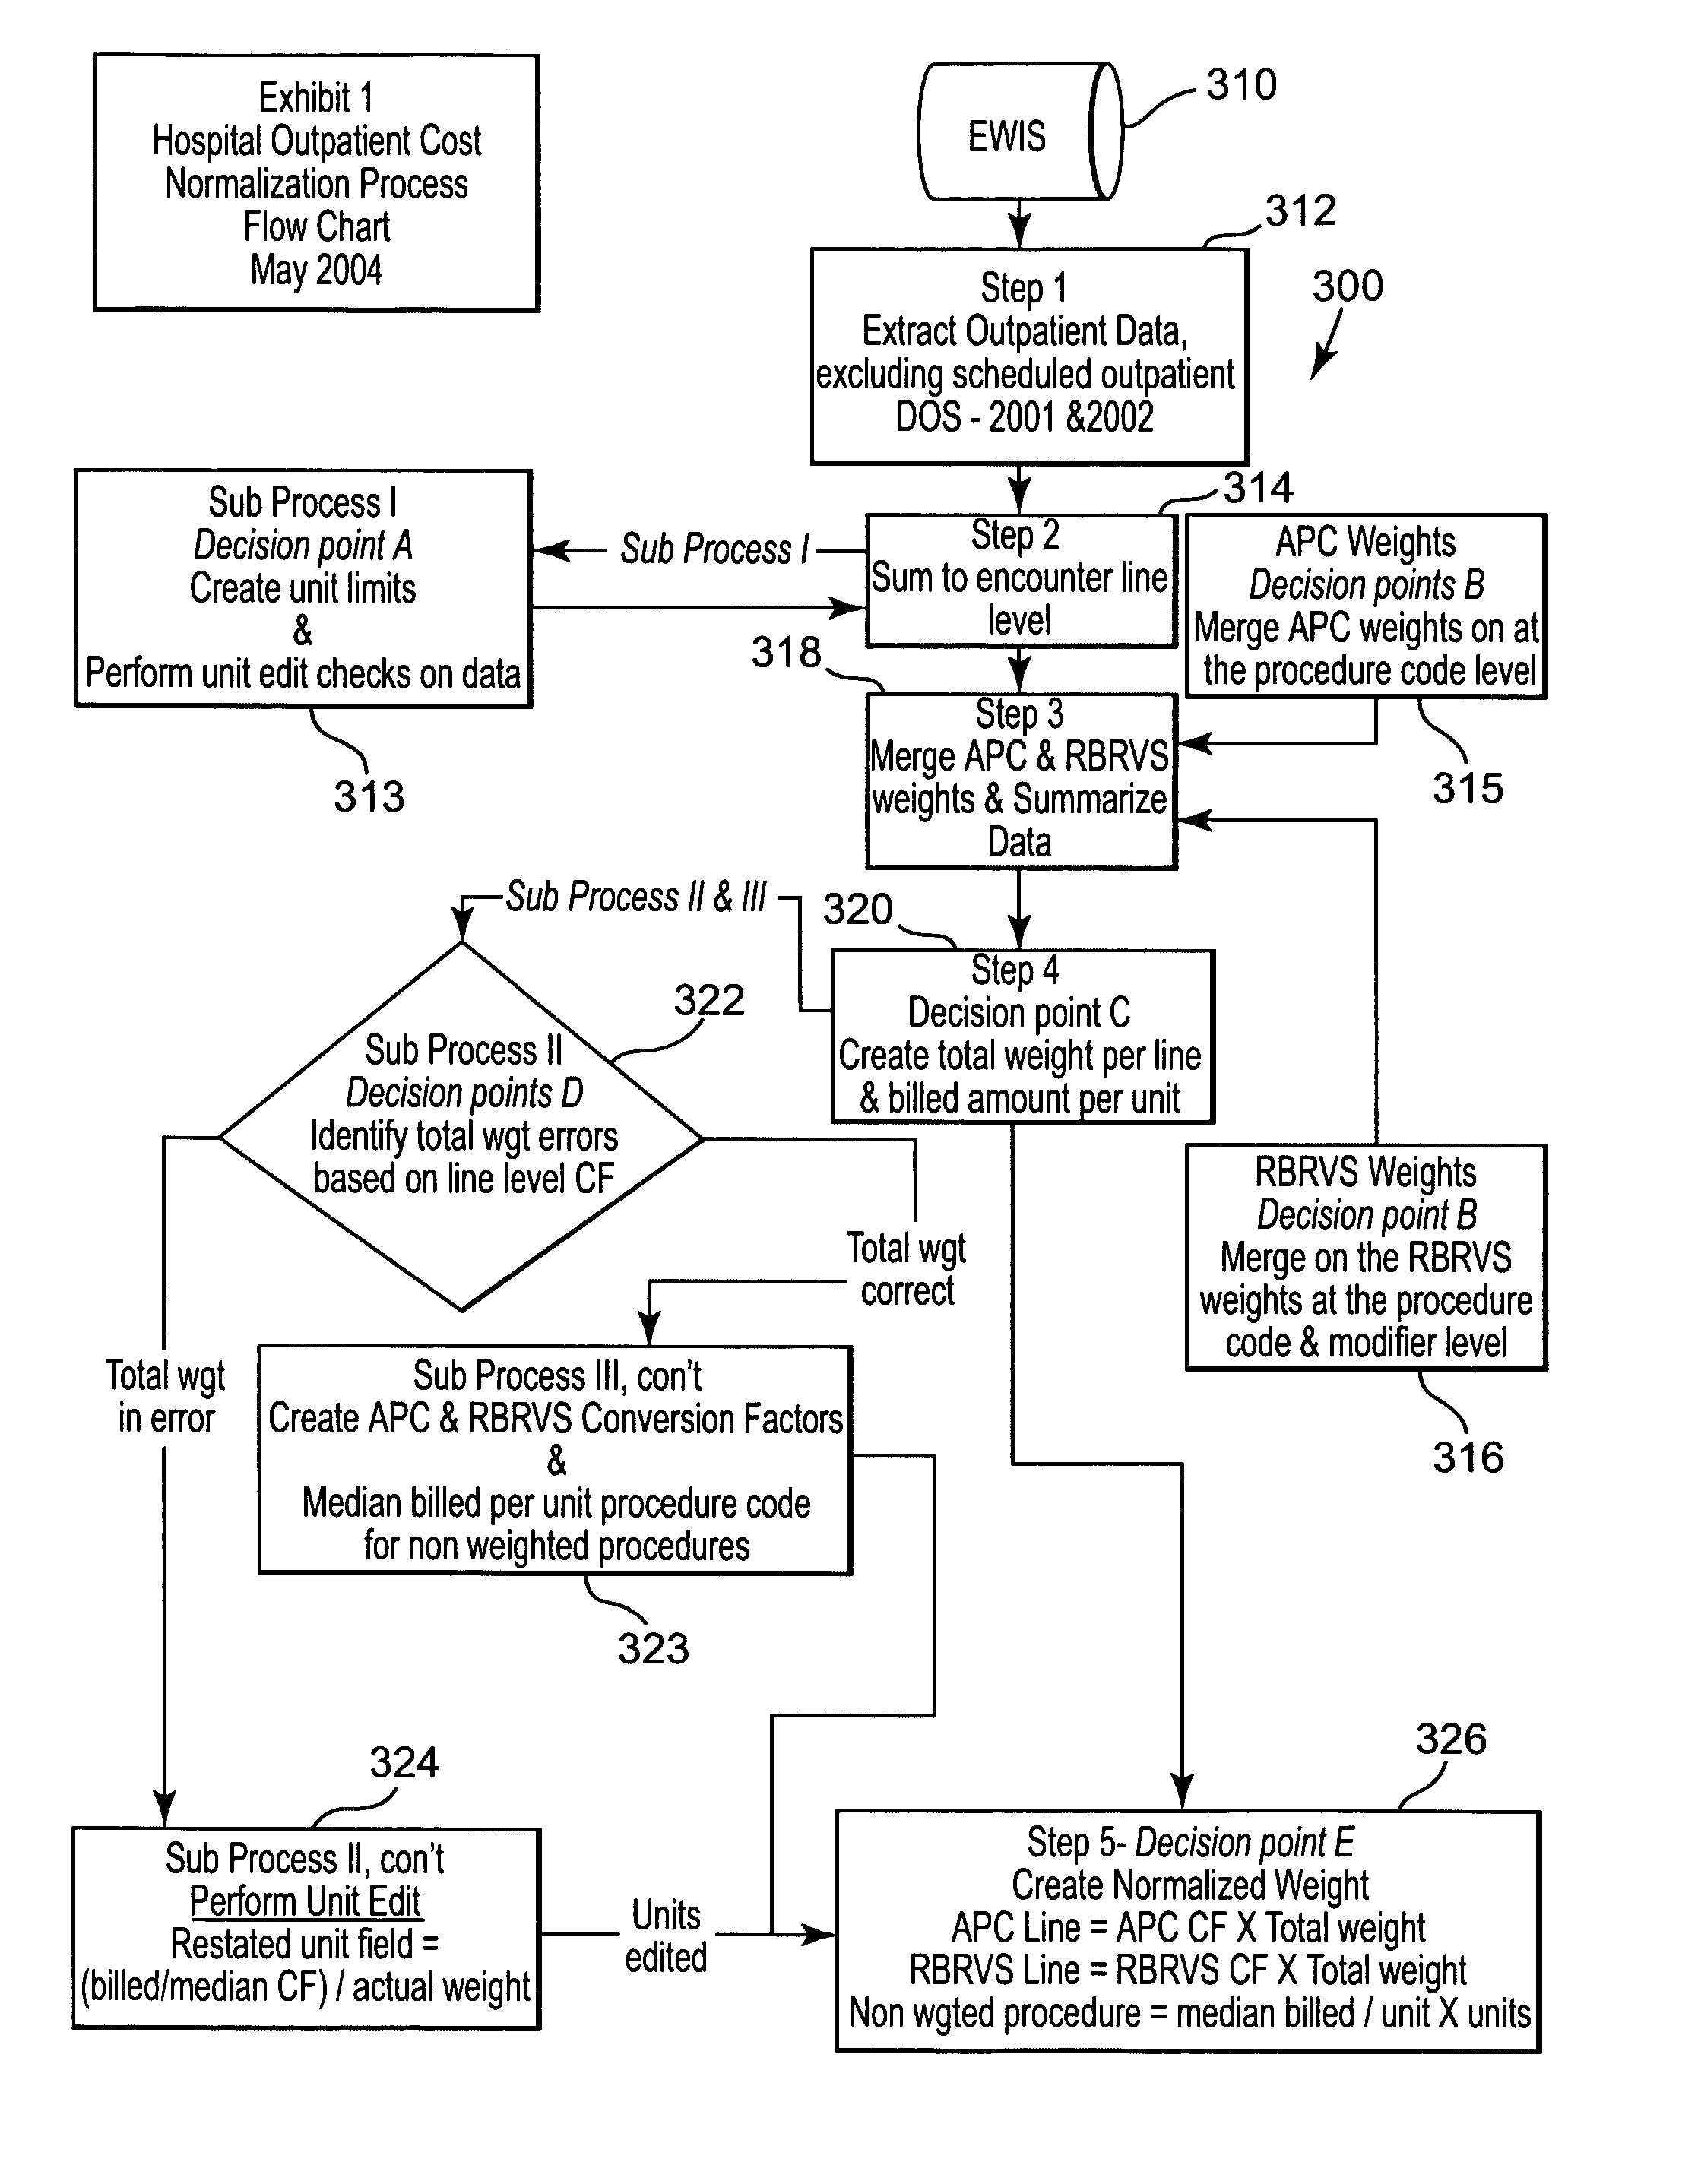
Hospital Outpatient Cost Normalization

[0136] This example corresponds with FIG. 4, reference numeral correspondence will be noted throughout the illustration.

[0137] First, outpatient data is extracted according to step 312 and summed to encounter line level (314) as follows:

Admit TypeEncounter #Line #FacilityCPT CODEMODIFIERUNITSBILLEDPaidHospital OP12435678501Facility AJ2550˜137.85—Hospital OP12435678502Facility AJ2270˜136.96—Hospital OP12435678503Facility AJ2765˜136.7324.17Hospital OP12435678504Facility AQ0081˜1608.50194.35Hospital OP12435678505Facility AG0001˜122.0020.07Hospital OP12435678506Facility A80048˜1287.0067.73Hospital OP12435678507Facility A85027˜1150.0060.20Hospital OP12435678508Facility A87186˜1136.0077.76Hospital OP12435678509Facility A87077˜141.00105.35Hospital OP124356785010Facility A87086˜1128.2885.29Hospital OP124356785011Facility A87491˜1128.00273.42Hospital OP124356785012Facility A87591˜1128.00273.42Hospital OP124356785013Facility A87088591119.0078.30Hospit...


PUM


Abstract

A method and computer program product is provided that, in various embodiments, may provide a measure of efficiency of resources used in medical treatment plan options. A normalized Relative Resource Value (RRV) may be obtained that measures the level of resources required to satisfy a “normal” case for a particular aspect of medical care. Applying this value against actual costs allows ranking and/or comparison of health care providers relative to one another on the basis of the price or resources applied or utilized. Moreover, applying the RRV against the quality of outcome allows comparison and ranking of providers on overall value. The invention may be applied to the components of medical care comprising, inter alia, acute inpatient, non-acute inpatient, outpatient, professional office-based care including scheduled outpatient, and pharmacy/prescriptions. The normalized RRV obtained under various embodiments of the invention may measure resource use for medical treatment plan options/resources independent of price. The RRV may be relative across, as well as within, each of the components of medical care. Thus, provider profiling generally as well as profiling across treatment plan options based on efficiency generally is within the scope of various embodiments of the invention. Moreover, providers may be compared based on efficiency for specific conditions, as well as across conditions, across treatment plan options and across components of care using various embodiments of the invention.

Description

[0001] A portion of the disclosure of this patent document contains material that is subject to copyright protection. The copyright owner has no objection to the facsimile reproduction by anyone of the patent document or the patent disclosure, as it appears in the Patent and Trademark Office patent file or records, but otherwise reserves all copyright rights whatsoever. RELATED APPLICATION(S) [0002] None. FIELD OF THE INVENTION [0003] This invention relates generally to measuring, ranking and / or comparing efficiency of the provision of medical resources and services. BACKGROUND OF THE PRESENT INVENTION [0004] One of many major challenges facing risk-bearing payer organizations in today's managed healthcare environment is to find a way to accurately measure resource use for medical procedures / treatment plan options and services independent of pricing. Such a measurement may create a relative value scale that is independent of price and that crosses inpatient, outpatient, professional...

Claims


Application Information

Patent Timeline
IPC IPC(8): G06Q10/00G06F17/30G16H40/20G16H70/40
CPCG06Q50/22G06Q50/24G16H40/20G16H70/40
Inventor LINDQUIST, TAMMIE J.POWER, ROBERT P.KITCHING, GARY J.COOPER, SUSAN L.HEIM, CHAD C.PASKACH, RICHARD R.
Owner GROUP HEALTH PLAN
Why Eureka
Try Eureka