
Method and computer-program product for detecting and quantifying protein spots

a protein spot and computer program technology, applied in image enhancement, instruments, image data processing, etc., can solve the problems of inability to reliably detect protein spots, methods are not robust enough, and the complexity of analyzing proteomics data is greater than that of genomics data

Inactive Publication Date: 2008-07-10
BOARD OF RGT THE UNIV OF TEXAS SYST
View PDF6 Cites 8 Cited by
  • Summary
  • Abstract
  • Description
  • Claims
  • Application Information

AI Technical Summary

Benefits of technology

[0007]The present invention is directed to a method and computer-program product for detecting and quantifying protein spots. It is more specifically

Problems solved by technology

However, the large number of amino acids and post-translational modifications make the complexity inherent in analyzing proteomics data greater than for genomics data.
As 2DE-based proteomic studies have become more complex, one of the major challenges has been to develop efficient and effective methods for detecting, matching, and quantifying spots on large numbers of gel images.
Second, spots detected on individual gel images are matched to a master list of spots on a chosen reference gel image, requiring specification of vertical and horizontal tolerances since spots on different gel images are rarely perfectly aligned with one another.
Unfortunately, these methods lack robustness.
Errors are frequent and especially problematic for studies involving large numbers of gels.
Detection errors include merging two spots into one, splitting a single spot into two, not detecting a spot, and mistaking artifacts for spots.
Also, automatically detected spot boundaries can be inaccurate, increasing the variability of spot volume calculations.
Matching errors occur when spots on different gel images are matched together but do not correspond to the same protein.
These errors are pervasive and can obscure the identification of differential protein expression.
Almeida, et al. list mismatched spots as one of the major sources of variability in 2DE, and Cutler, et al. identify the subjective nature of the editing required to correct these errors as a major problem.
Extensive hand editing is needed to correct these various errors and can be very time-consuming, taking 1 to 4 hours per gel image.
Taken together, these factors limit throughput and bring the objectivity and reproducibility of results into question.
A number of ad hoc strategies have been employed, but all have weaknesses and bias quantifications.

Method used


Image

  • Method and computer-program product for detecting and quantifying protein spots
  • Method and computer-program product for detecting and quantifying protein spots
  • Method and computer-program product for detecting and quantifying protein spots

Examples


Embodiment Construction

[0020]In the following paragraphs, the present invention will be described in detail by way of example with reference to the attached drawings. Throughout this description, the preferred embodiment and examples shown should be considered as exemplars, rather than as limitations on the present invention. As used herein, the “present invention” refers to any one of the embodiments of the invention described herein, and any equivalents. Furthermore, reference to various feature(s) of the “present invention” throughout this document does not mean that all claimed embodiments or methods must include the referenced feature(s).

[0021]The present invention is directed to a method and a computer program product for detecting and quantifying protein spots. The invention was made with government support under RO1 DA015146 and P30 DA018310 awarded by The National Institutes of Health. The government has certain rights in the invention. It is more specifically directed to detecting and quantifyin...


PUM


Abstract

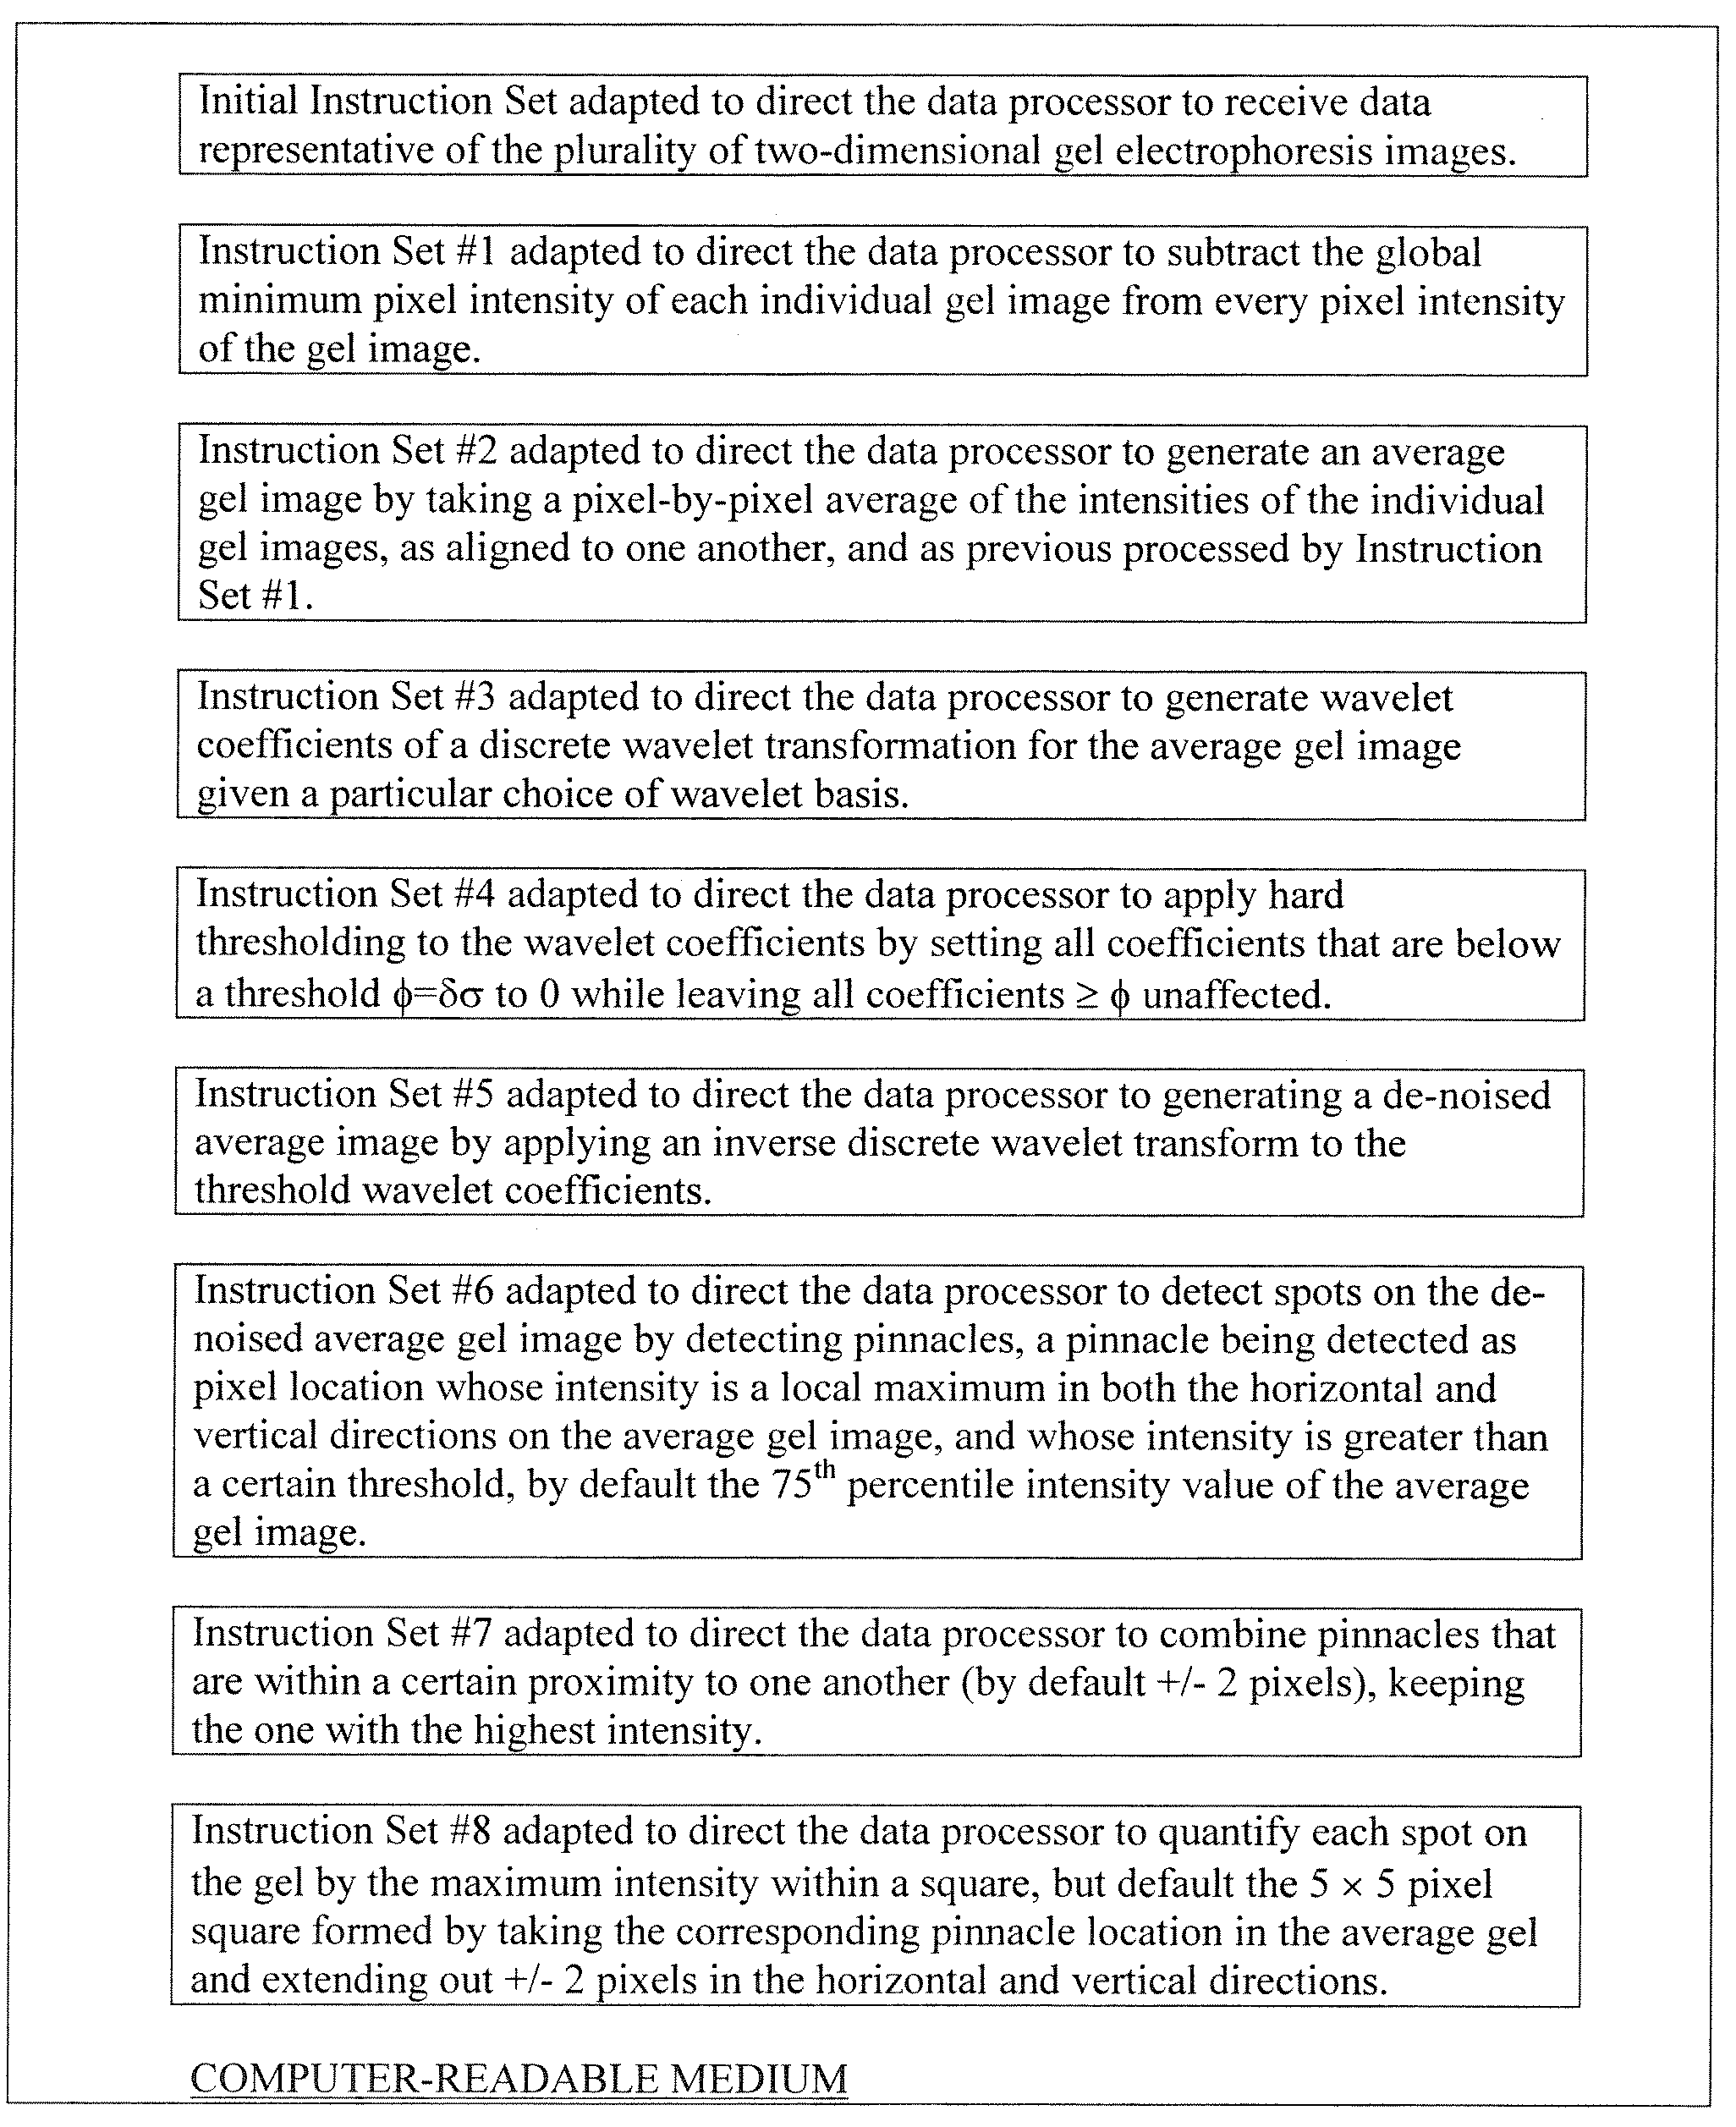
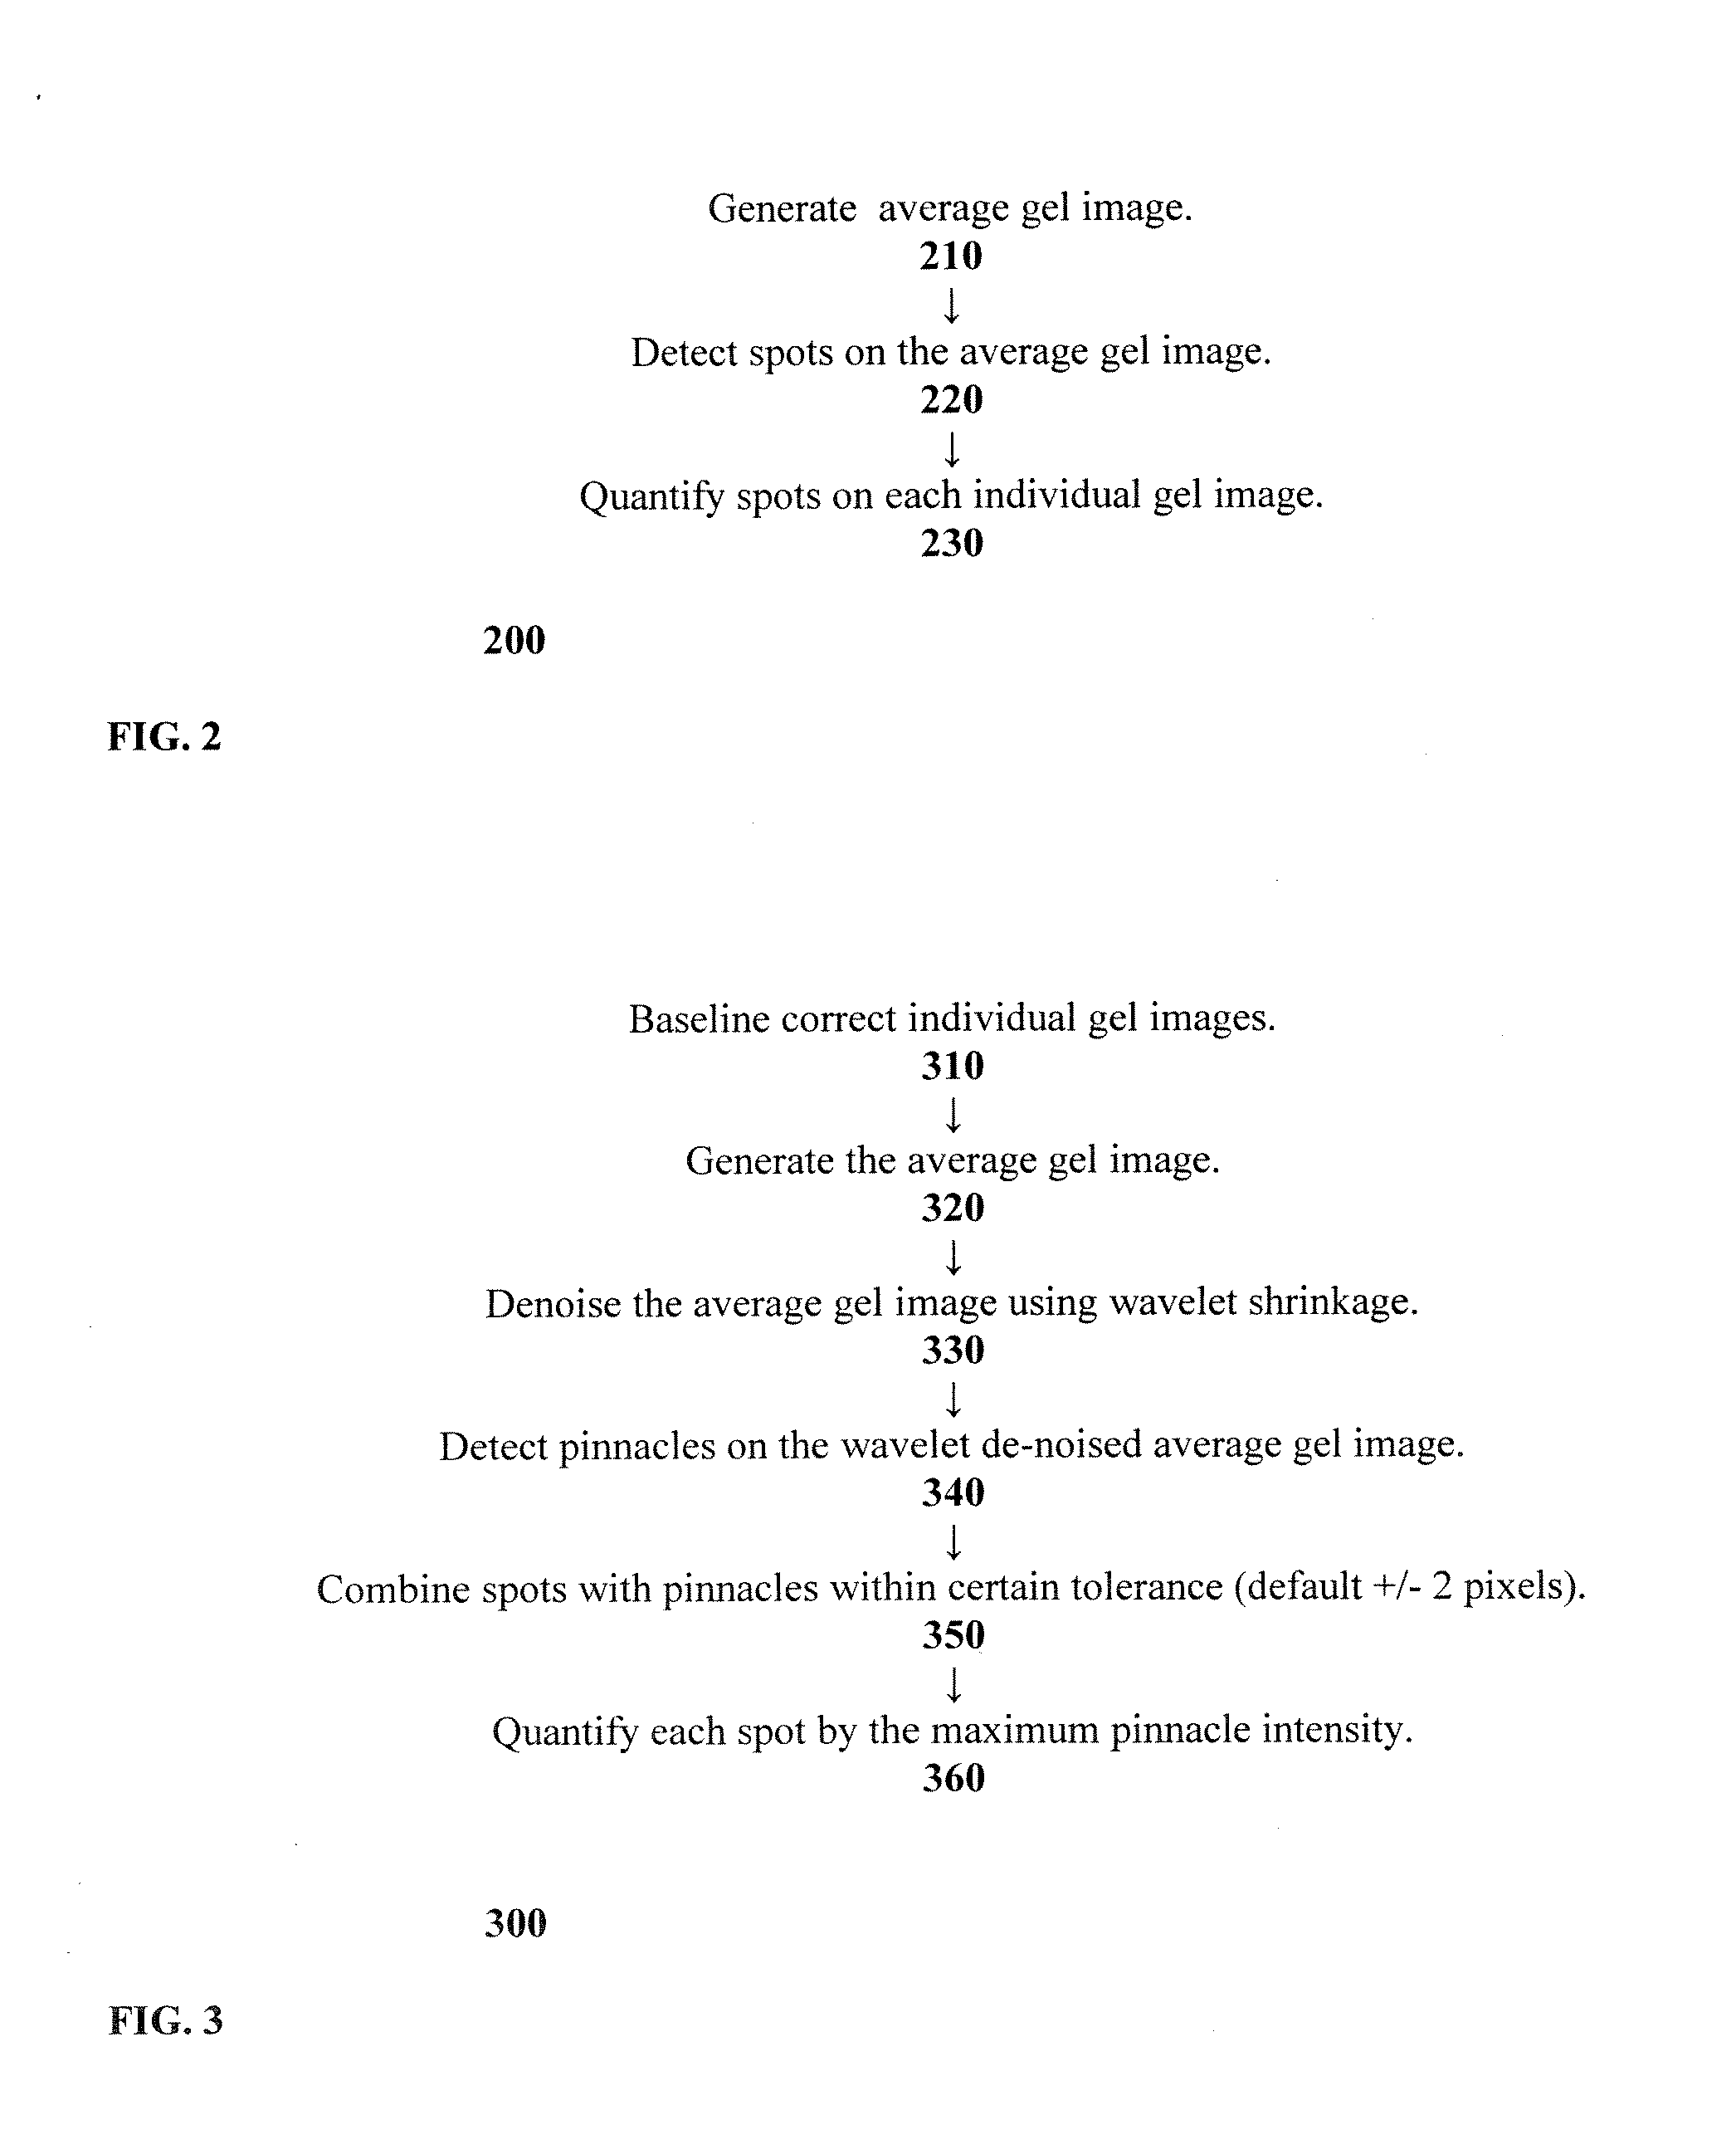
The present inventions is directed to a method and computer program product for detecting and quantifying protein spots, including: generating an average gel image by taking a pixel-by-pixel average of the intensities of a plurality of aligned gel images; detecting spots on the average gel image using pinnacle detection; and quantifying spots on individual gels using the maximum intensity within fixed neighborhoods surrounding pinnacle locations found in the average gel image.

Description

REFERENCE TO RELATED APPLICATIONS[0001]This application claims priority to U.S. Provisional Patent Application No. 60 / 884,141, filed Jan. 9, 2007, the content of which is incorporated herein by reference in its entirety.FIELD OF THE INVENTION [0002]The present invention is generally directed to a method and computer program product for detecting and quantifying protein spots, and more particularly to detecting and quantifying such spots in 2-dimensional gel electrophoresis data or other 2-dimensional proteomic technologies.BACKGROUND OF THE INVENTION [0003]Proteomics is capable of generating new hypotheses about the mechanisms underlying physiological changes. The perceived advantage of proteomics over gene-based global profiling approaches is that proteins are the most common effector molecules in cells. Changes in gene expression may not be reflected by changes in protein expression. See, Anderson, L. & Seilhammer, J. A. A comparison of selected mRNA and protein abundances in huma...

Claims


Application Information

Patent Timeline
IPC IPC(8): G06K9/00
CPCG01N27/44721G06T2207/30072G06T7/0012G01N27/44773
Inventor MORRIS, JEFFREY S.GUTSTEIN, HOWARD
Owner BOARD OF RGT THE UNIV OF TEXAS SYST
Learn More