

Generating synthetic workloads to measure power utilization in a computer system
a computer system and workload technology, applied in the field of computer system testing, can solve the problems of increasing electricity costs, increasing electricity costs, and electricity costs that are likely to exceed both capital costs and operating costs
Active Publication Date: 2008-09-18
ORACLE INT CORP
View PDF1 Cites 30 Cited by
- Summary
- Abstract
- Description
- Claims
- Application Information
AI Technical Summary
Problems solved by technology
As these servers become increasingly more powerful, they consume more power, which can greatly increase electricity costs.
In fact, as power consumption continues to increase, electricity costs are likely to exceed both capital costs and operating costs to become the largest component of the total cost of ownership (TCO) of a data center.
Responding to such queries from customers is not easy.
However, duplicating a customer's exact workload on one or more servers in a laboratory is most often not possible.
First, there are security concerns that would prevent most business customers from allowing a vendor to port financial, health-care, or business-proprietary databases to a vendor's lab.
Secondly, it is a huge undertaking to duplicate a customer's software systems (e.g., database, enterprise computing software, or nuclear simulation) on a vendor's machines in a laboratory for purposes of assessing energy utilization.
Method used
View moreImage
Smart ImageViewing Examples

Examples
examples
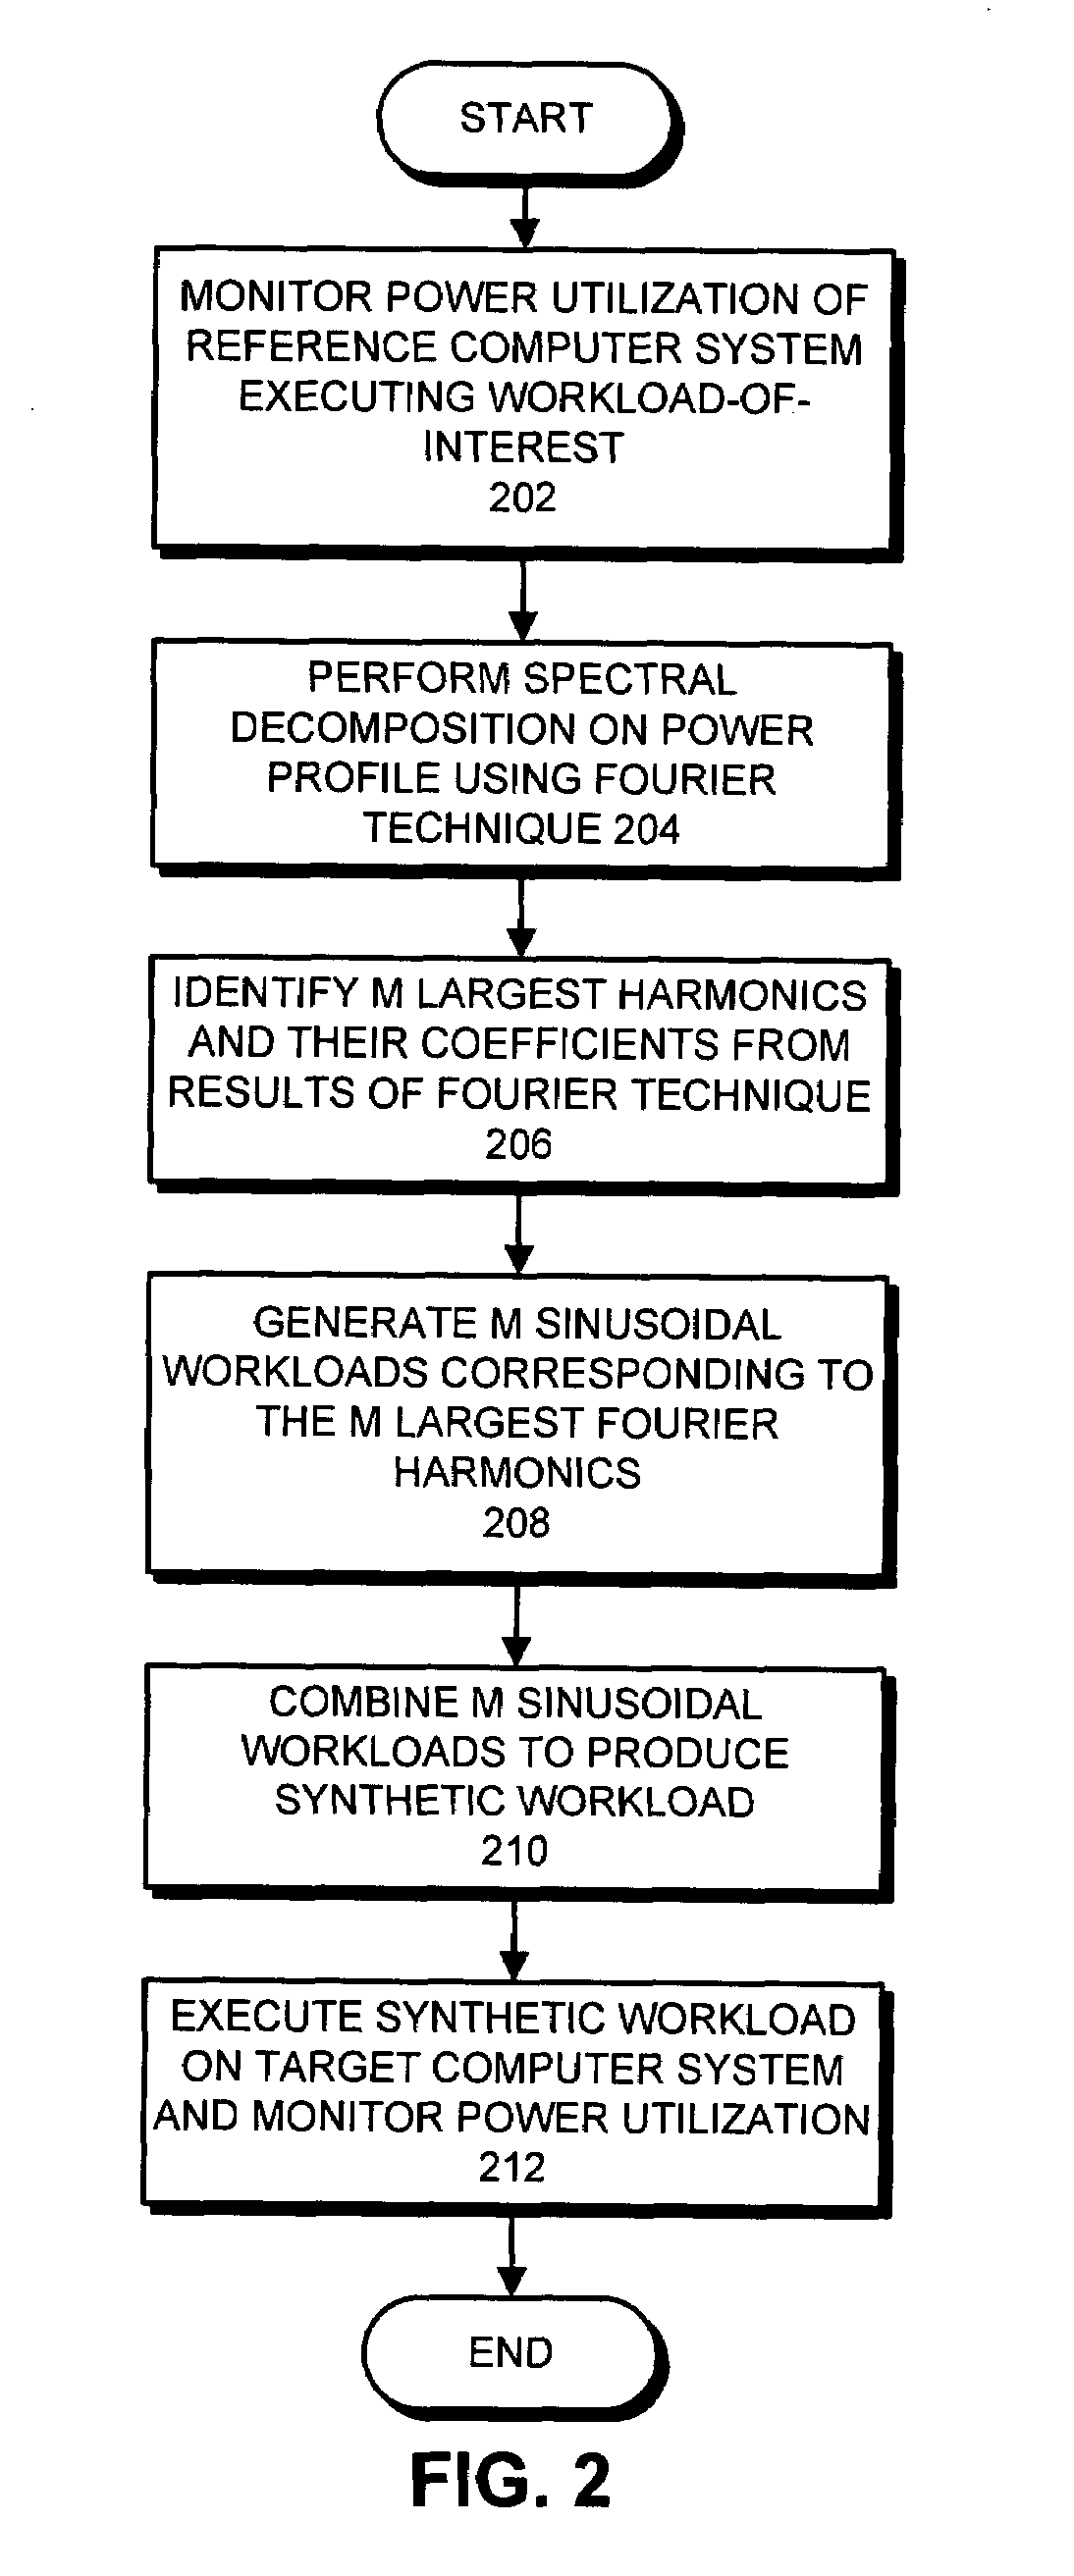
[0036]The charts which appear in FIGS. 3-6 demonstrate the marginal improvement in accuracy obtained by varying the number of modes M in the Fourier decomposition. More specifically, FIG. 3 illustrates how a power signal is reconstructed using 20 frequencies. Similarly, FIGS. 4 and 5 illustrate how power signals are reconstructed using 40 frequencies. Finally, FIG. 6 illustrates how a power signal is reconstructed using 80 frequencies in accordance with an embodiment of the present invention. Note that as M is increased, the “residual function” (i.e. difference between the original customer workload and the synthesized Lab-machine workload) becomes smaller.
Login to View More PUM
 Abstract
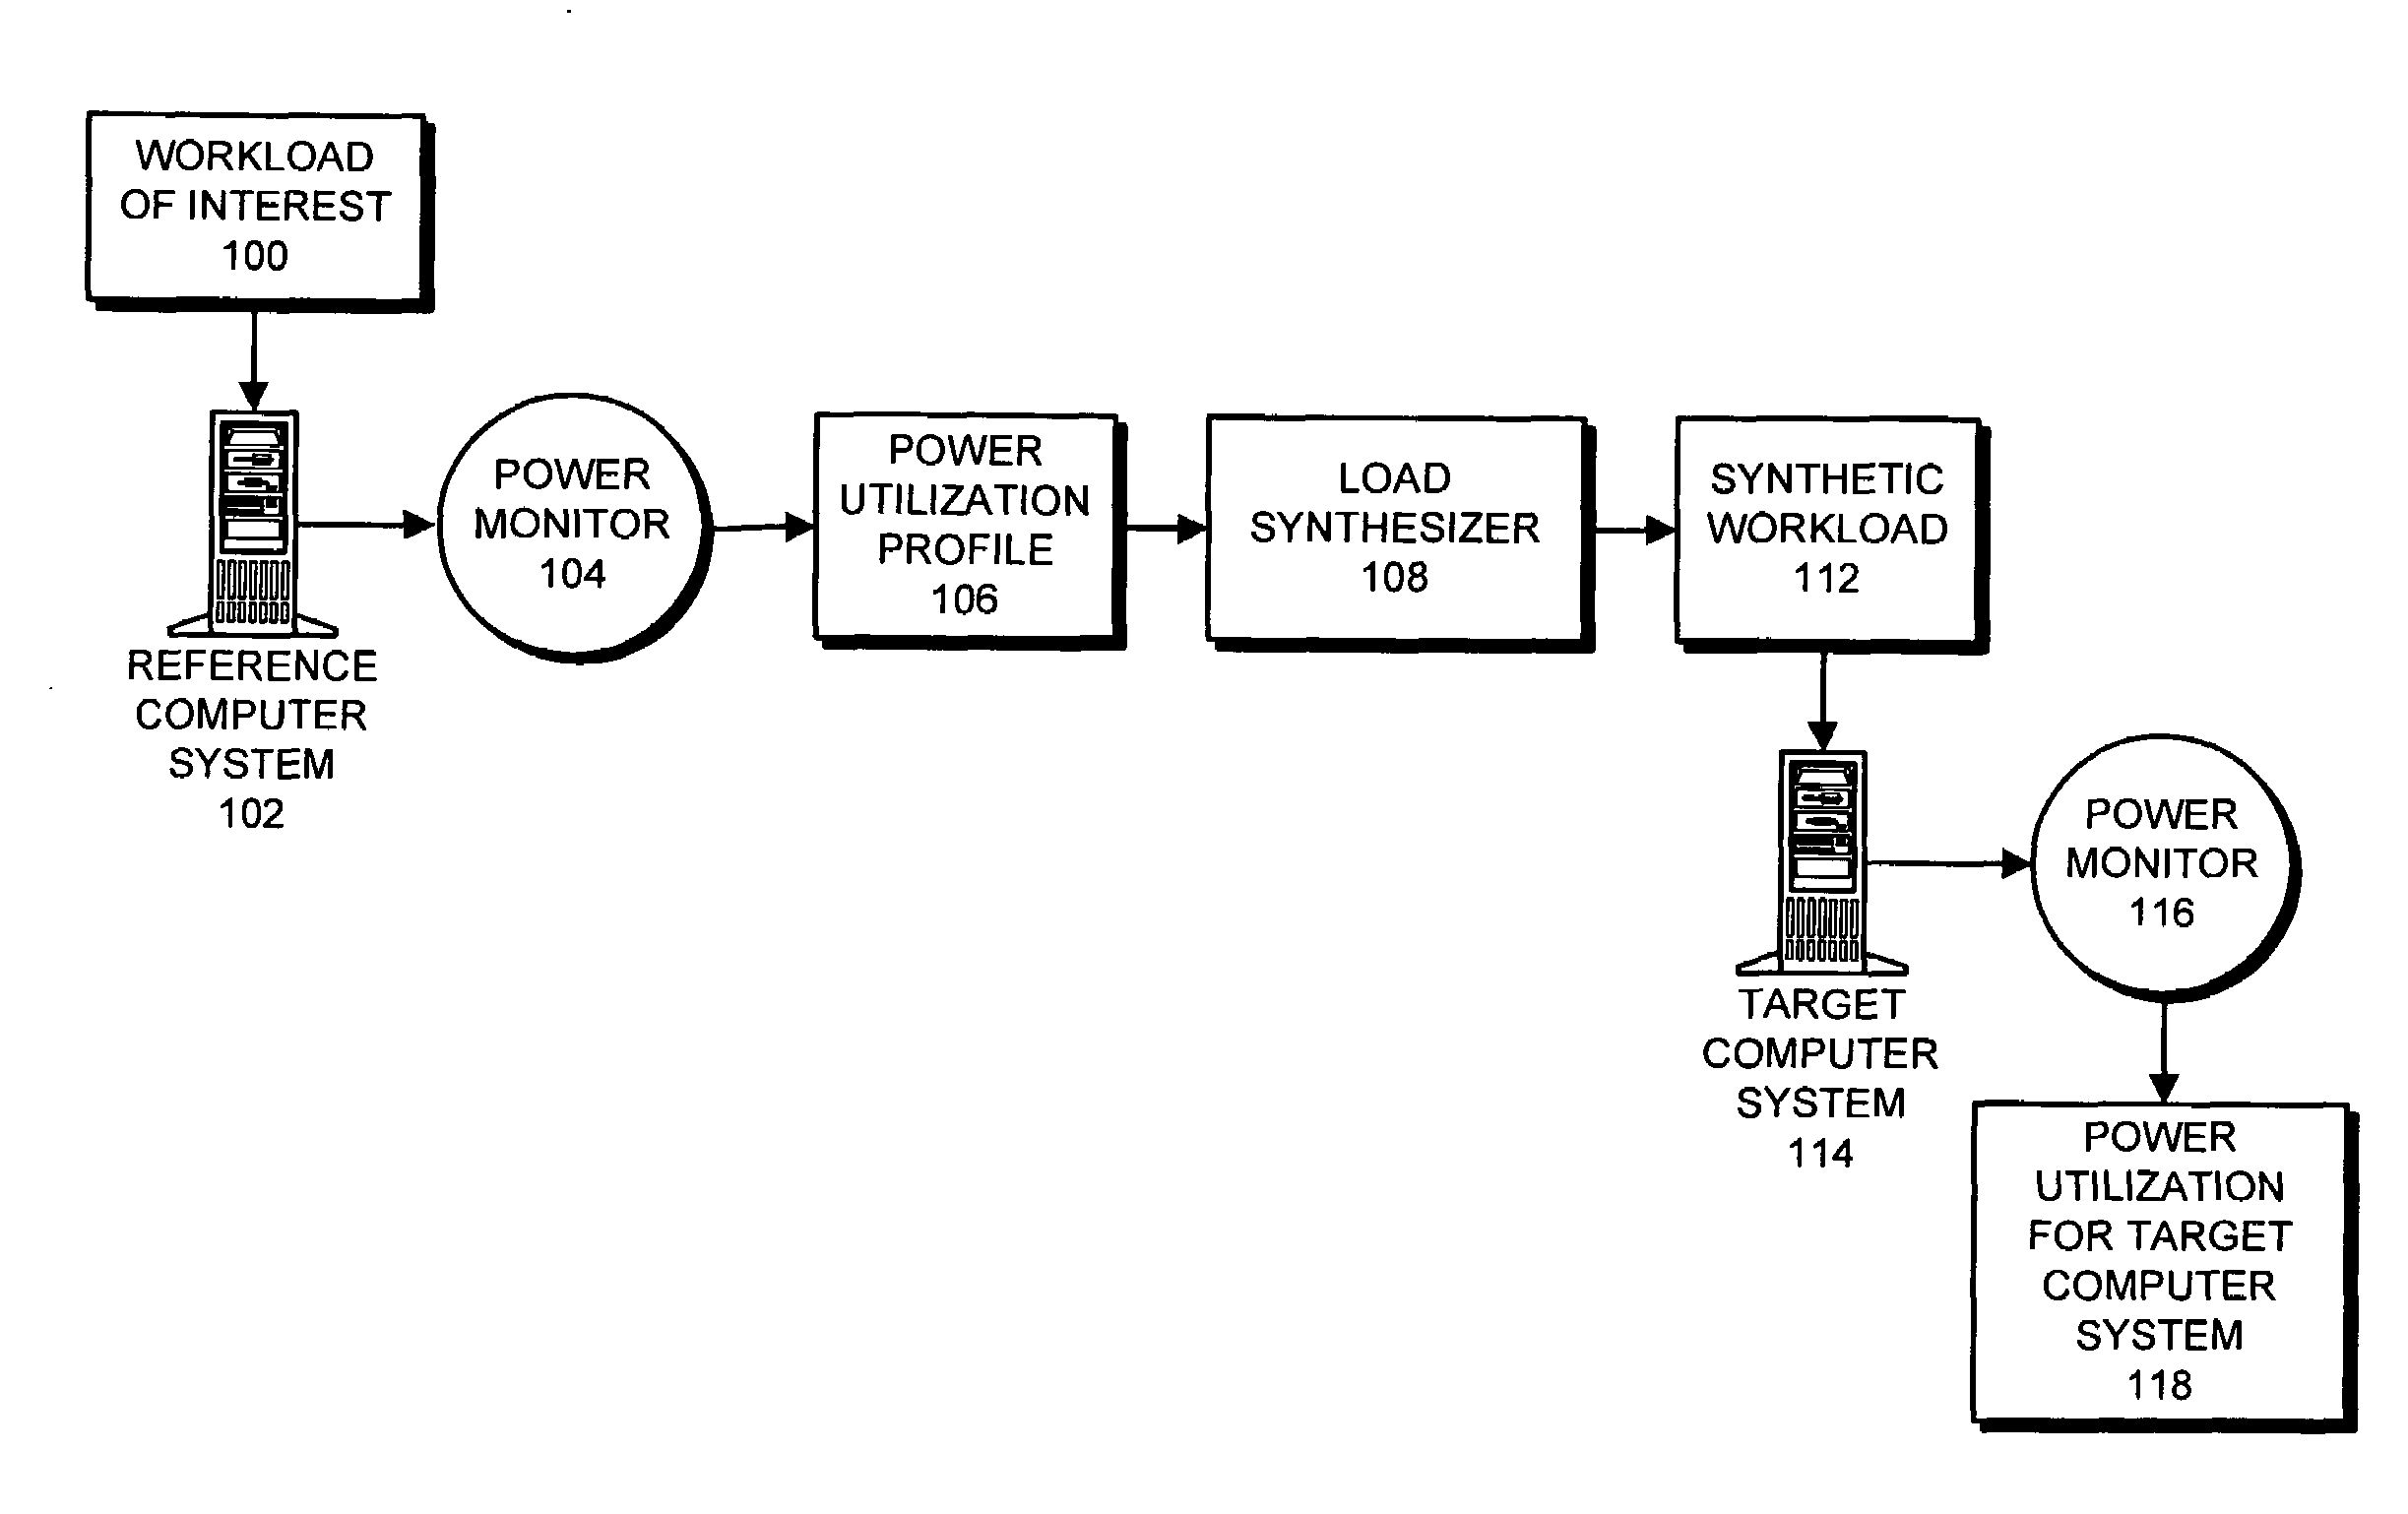
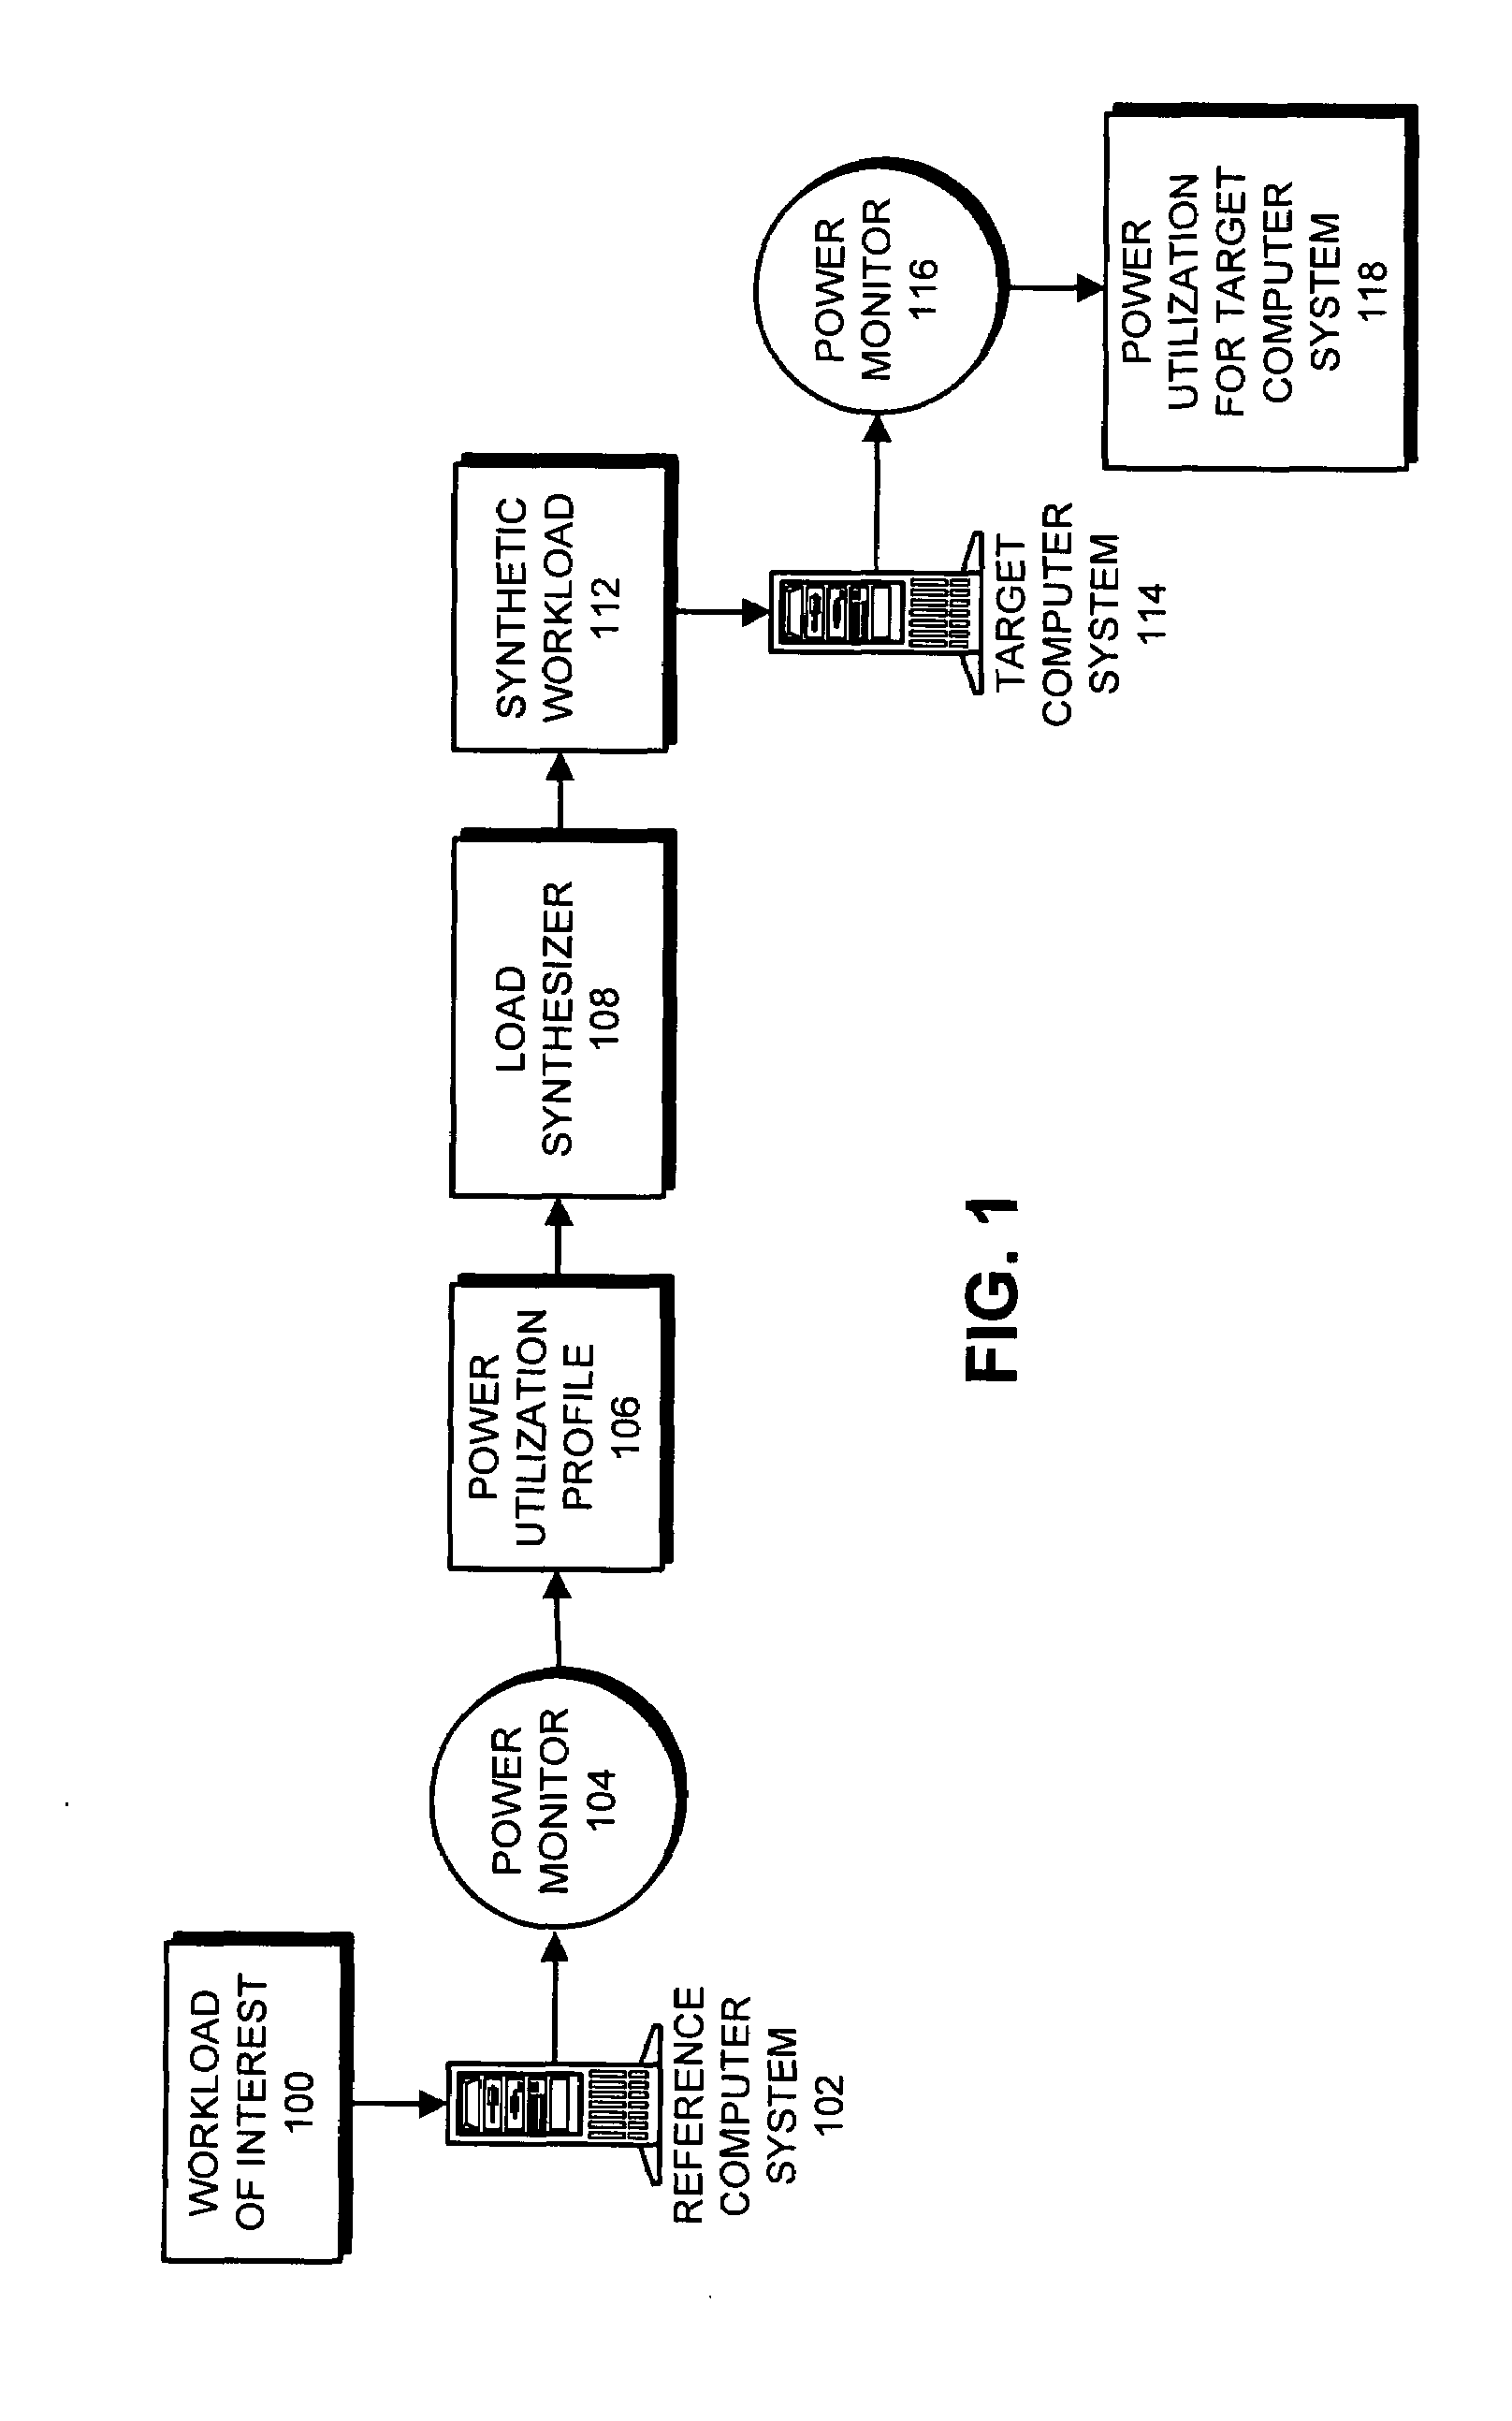
One embodiment of the present invention provides a system that generates a synthetic workload to test power utilization in a computer system. During operation, the system monitors power utilization of a reference computer system while the reference computer system executes a workload-of interest, wherein the monitoring process produces a power profile. Next, the system determines characteristics of the workload-of-interest from the power profile. Finally, the system uses the determined characteristics to construct the synthetic workload, wherein the synthetic workload has similar power utilization to the workload-of-interest.
Description
BACKGROUND[0001]1. Field of the Invention[0002]The present invention generally relates to techniques for testing computer systems. More specifically, the present invention relates to techniques for synthesizing dynamic workloads to test power utilization in computer systems.[0003]2. Related Art[0004]Large organizations often maintain datacenters containing dozens or even hundreds of servers that provide various computational services. As these servers become increasingly more powerful, they consume more power, which can greatly increase electricity costs. In fact, as power consumption continues to increase, electricity costs are likely to exceed both capital costs and operating costs to become the largest component of the total cost of ownership (TCO) of a data center.[0005]Hence, the total wattage, and the integrated wattage needed to complete a given computational workload are becoming key factors in determining what servers to purchase. To this end, customers are beginning to ask...
Claims
Login to View More Application Information
Patent Timeline
 Patent Type & AuthorityApplications(United States)
IPC IPC(8): G06F9/45G06F11/30
CPCG01R21/133Y02B60/165G06F11/3414G06F11/30Y02D10/00
InventorGROSS, KENNY C.DHANEKULA, RAMAKRISHNA C.VAIDYANATHAN, KALYANARAMAN
OwnerORACLE INT CORP