
Method of Displaying Molecule Function Network

a function network and molecule technology, applied in the field of biochemical information processing, can solve the problems of not disclosing a method of displaying a molecule function network flexibly as a graphic, and cannot display a molecule function network containing information on the functions of molecule molecules and bioevents

Inactive Publication Date: 2008-11-13
INST OF MEDICINAL MOLECULAR DESIGN
View PDF4 Cites 7 Cited by
  • Summary
  • Abstract
  • Description
  • Claims
  • Application Information

AI Technical Summary

Benefits of technology

[0006]An object of the present invention is to provide a method and a system for processing and displaying a molecule function network including the information on bio-events flexibly by using a computer. To be more specific, the object of the present invention is to provide a means that enables a user to examine easily a relation between information on bio-events and a molecule network with a graphic display by generating a molecule function network of an arbitrary range according to a direction by the user.
[0007]There are cases where bio-events have relations with each other. Providing a means that enables a user to examine such relations easily is also an object of the present invention. Furthermore, providing a means that enables a user to examine easily not only a molecule function network consisting of biomolecules, but also a molecule function network containing drug molecules and extrinsic molecules, and biomolecules of other species is also an object of the present invention.
[0008]One of the objects of the present invention is to provide methods and graphical user interfaces which enable a user to search information retrieval servers for items related to the biomolecule and / or bio-event in the molecule function network easily.

Problems solved by technology

However, these methods cannot display a molecule function network containing information on the molecule functions and information on the bio-events flexibly.
Although the specifications of PCT / JP01 / 07830 and PCT / JP03 / 02847 indicate the methods for generating and processing a molecule function network as a data structure, they do not disclose a method of displaying a molecule function network flexibly as a graphic.

Method used


Image

  • Method of Displaying Molecule Function Network
  • Method of Displaying Molecule Function Network
  • Method of Displaying Molecule Function Network

Examples


example 1

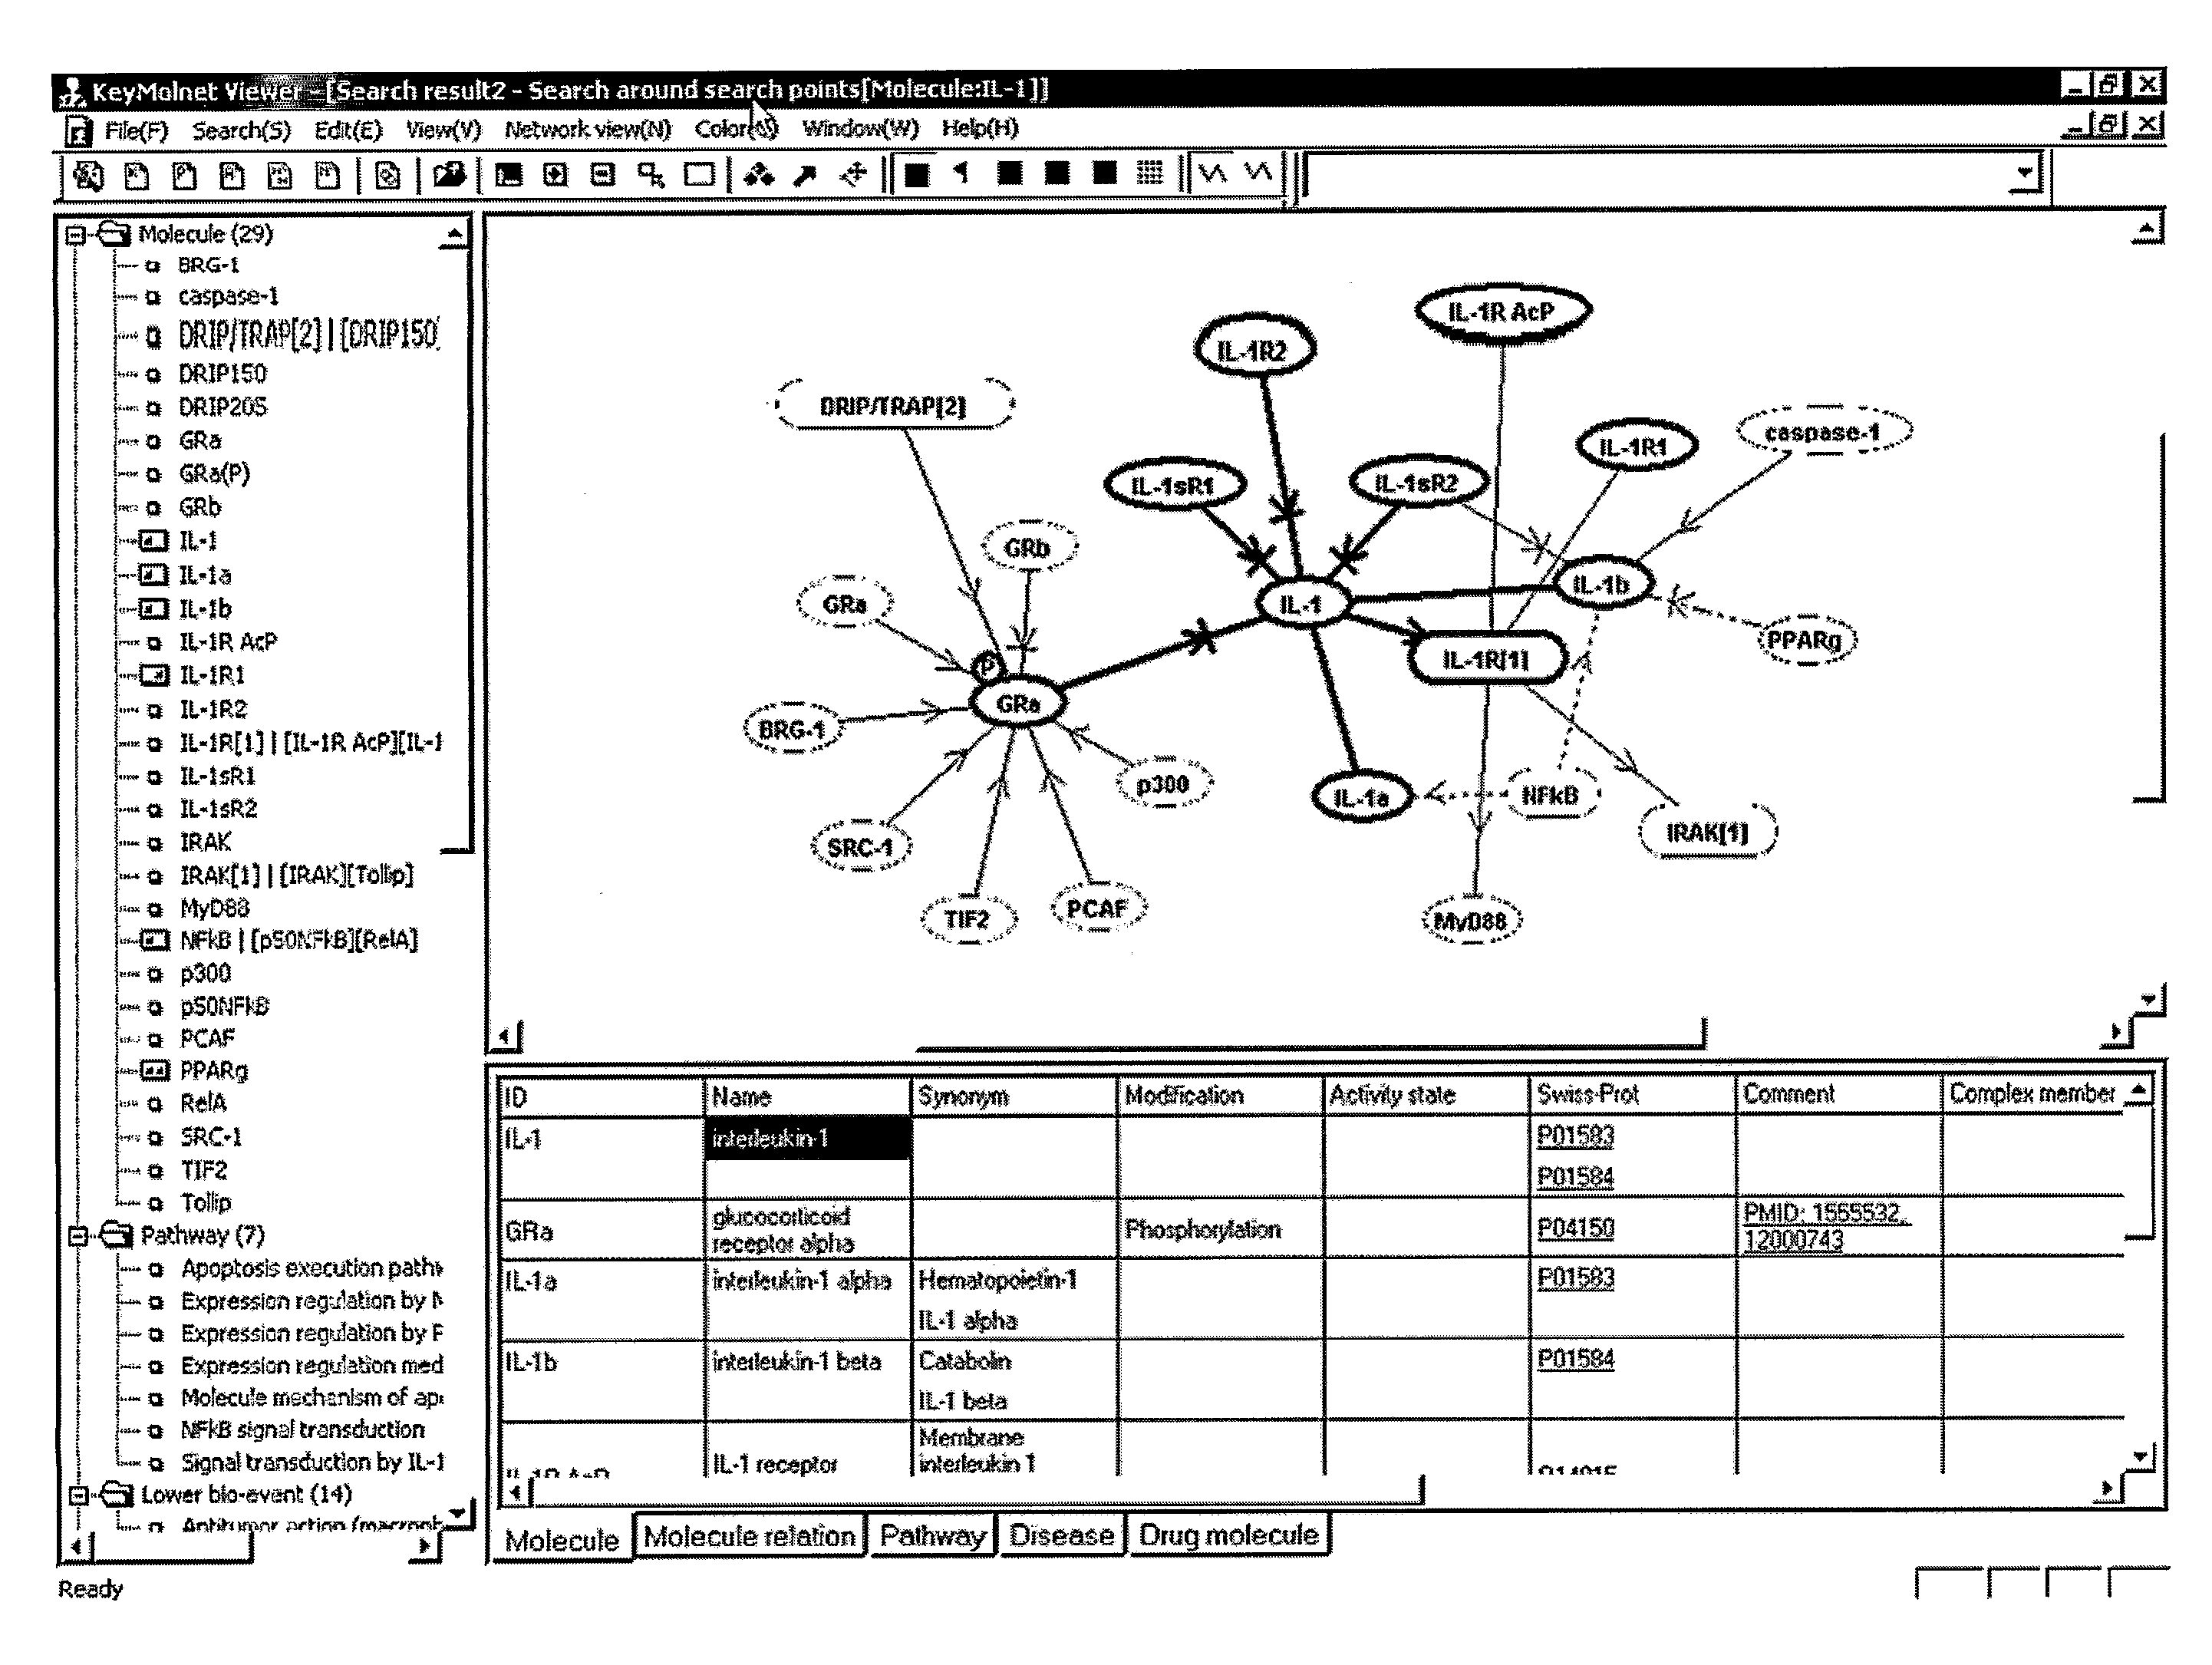
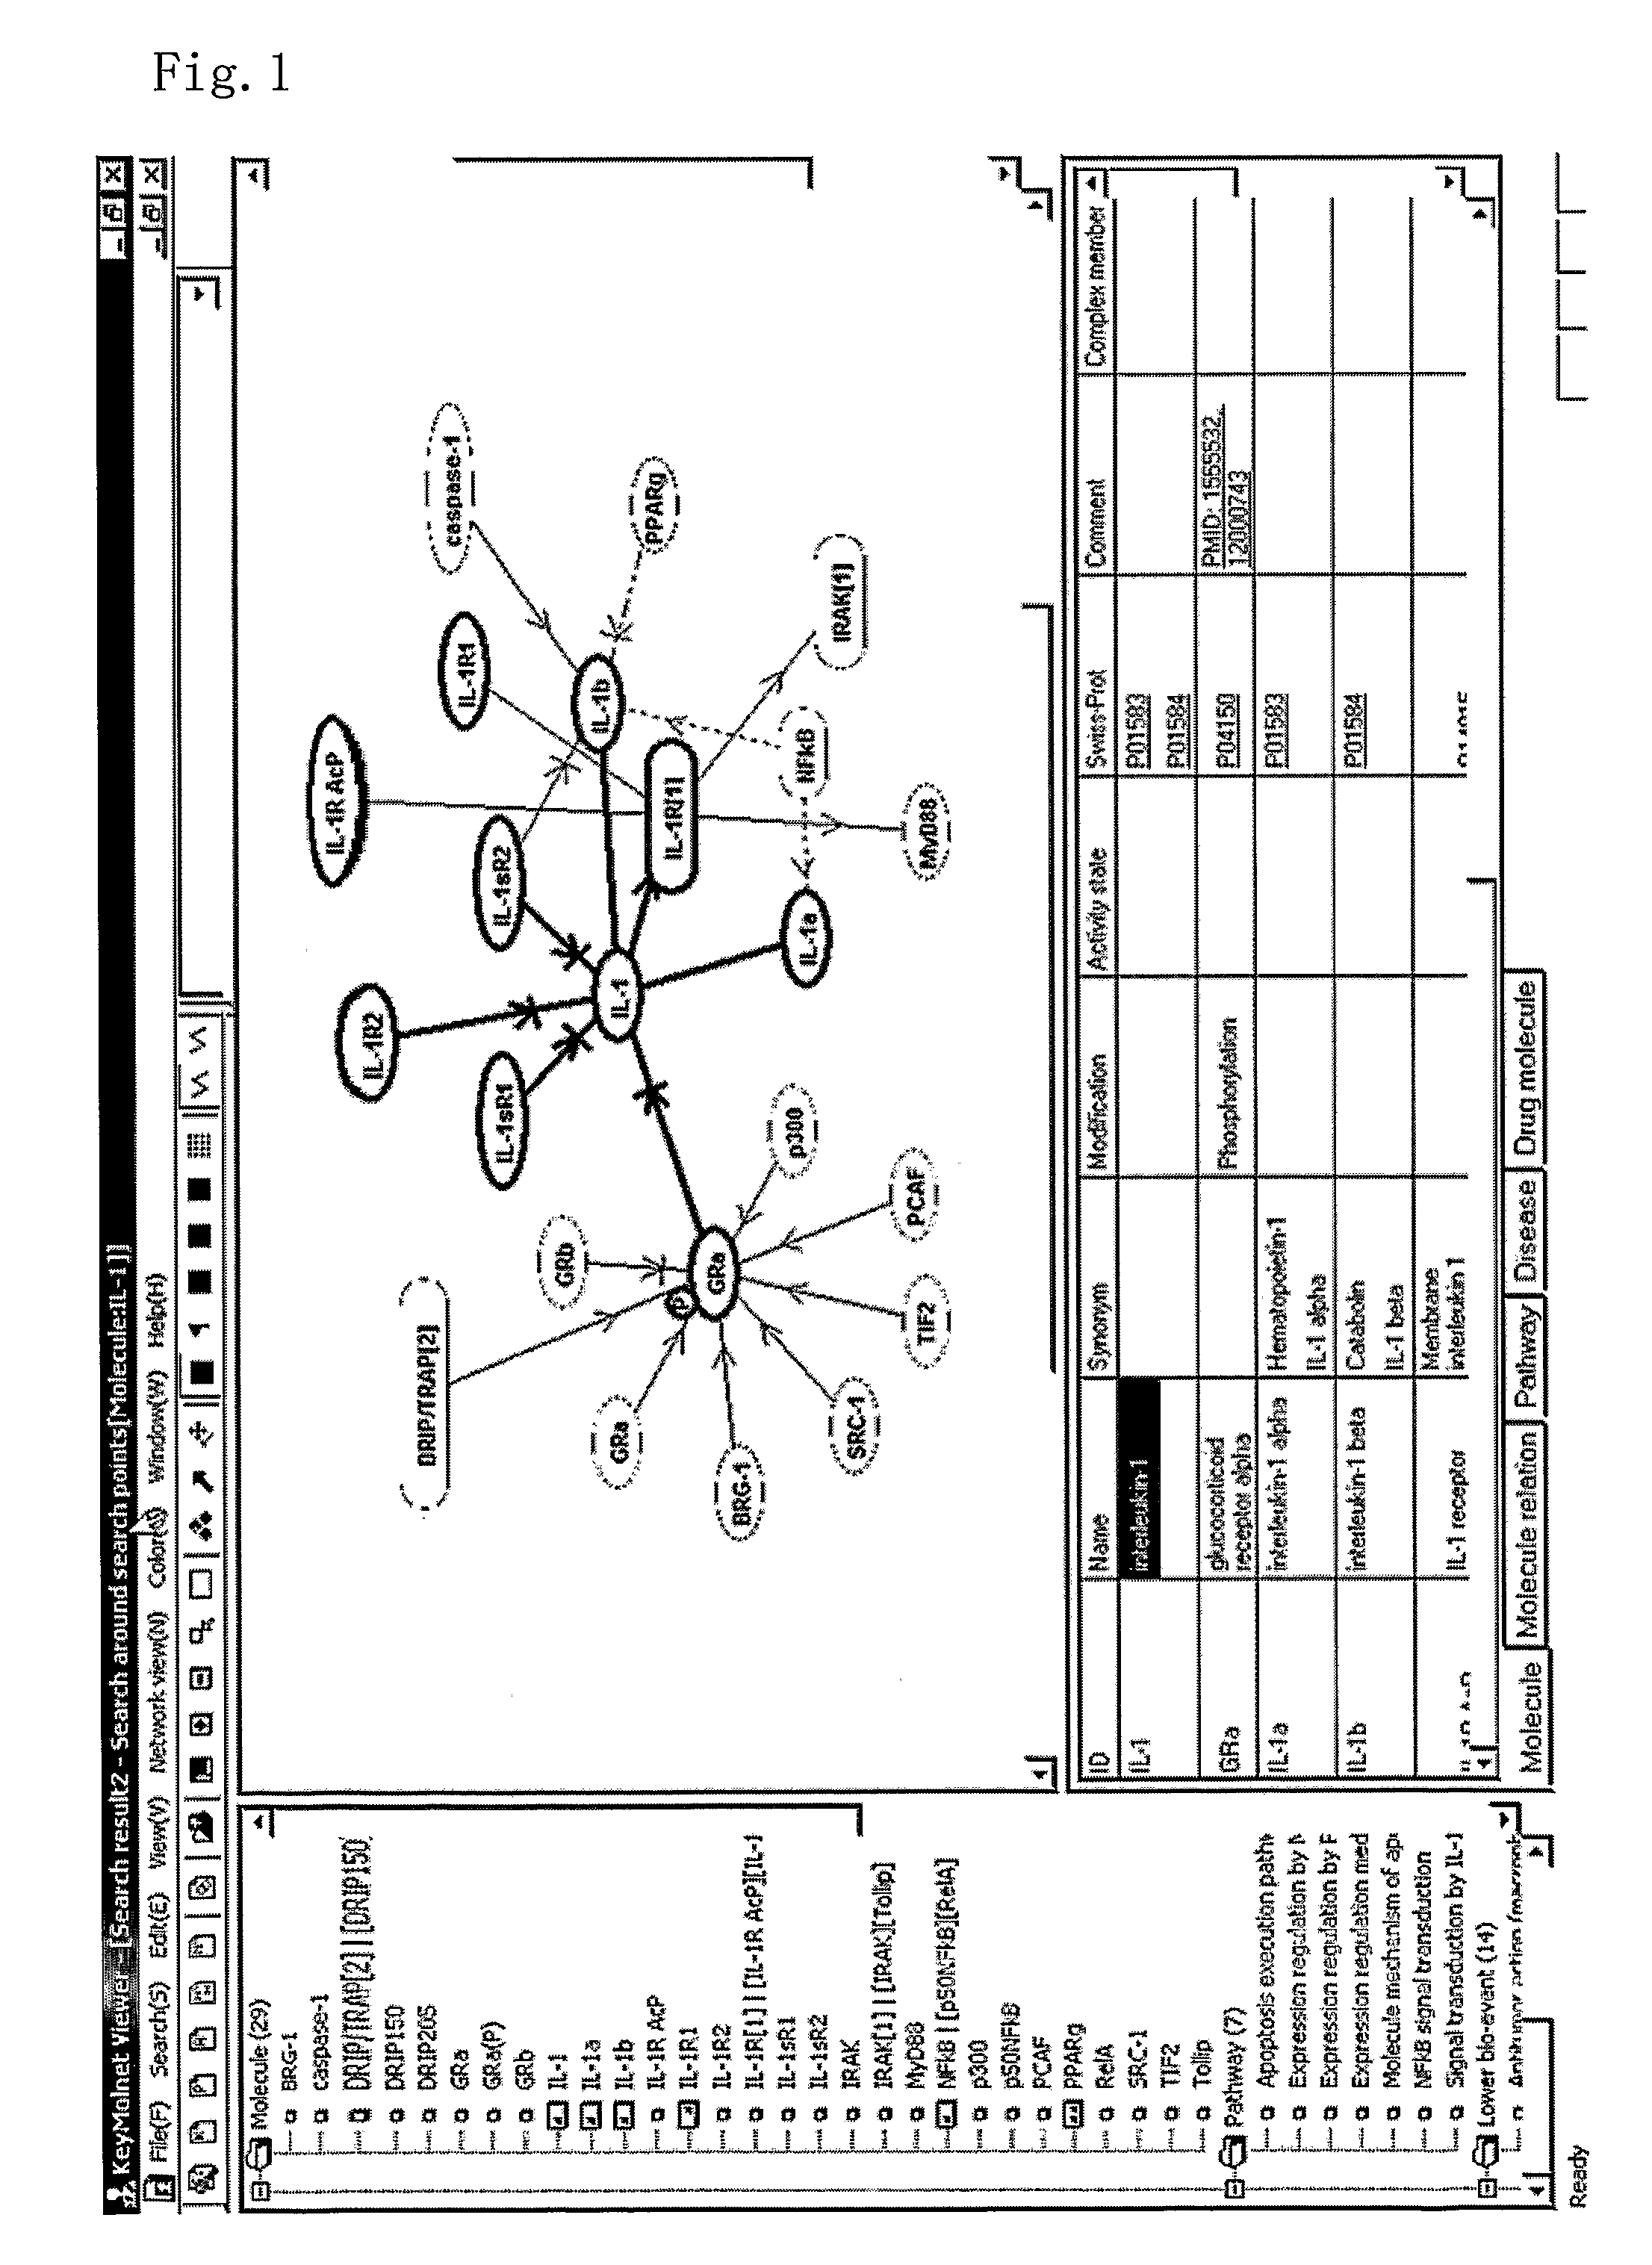
[0156]In FIG. 1, an example of displaying molecule items in the molecule network window and in the information window interlinked with each other. First, the system generates a molecule function network with an appropriate range according to the designation by a user. In the molecule network window, a molecule network is displayed according to the above-mentioned methods. When the user clicks an arbitrary apex (corresponding to a molecule) or an edge (corresponding to a relation between molecules) in the molecule network window, the system searches the molecule information database using the corresponding molecule(s) as a query, and the obtained molecule information is displayed in the information window. In FIG. 1, the molecule information is displayed in the information window at bottom-right of the screen by grouping the molecule information into different columns for respective categories so that the user can view the information easily. With this display method, the user can ea...

example 2

[0161]FIG. 6 shows an example of displaying molecule-pair items in the molecule network window and in the information window interlinked with each other. First, the system generates a molecule network with an appropriate range according to the designation by a user. In the molecule network window, a molecule network is displayed according to the above-mentioned methods. When the user clicks an arbitrary edge (corresponding to a relation between molecules) in the molecule network window, the system searches a molecule pair consisting of molecules of the both ends of the edge from the molecule-linkage database, and displays information on the obtained molecule pair in the information window.

[0162]When the user clicks an arbitrary molecule in the molecule network window, it is preferable that the system searches a molecule pair containing the clicked molecule at either end from the molecule-linkage database, and displays information on the obtained molecule pair in the information wind...

example 3

[0166]FIG. 7 shows an example of displaying items of the pathological events in the molecule network window and in the information window interlinked with each other. In the display of the molecule network at upper-right, the key molecules that change quantitatively or qualitatively in diseases are displayed with black-and-white reversed (molecules such as IL-1, NFkB, and PPARg) based on the information on key molecules in the pathology-linkage database.

[0167]When the user clicks IL-1, which is one of the key molecules, on the molecule network display, the system highlights a disease (“rheumatoid arthritis” which is underlined) related to the key molecule (that is, IL-1) in the summary information window on the left based on the information in the pathology-linkage database. At the same time, the system extracts information on the disease from the pathology-linkage database and displays items in the detailed information window at bottom-right. Here, all information related to the di...


PUM


Abstract

A graphical user interface that generates a molecule function network with an arbitrary range according to the designation by a user and displays the said molecule function network graphically; a graphical user interface with a molecule network window which displays a molecule network included in the molecule function network and an information window which displays one or more information items selected form a group comprising molecules, molecule pairs and bio-events included in the said molecule function network, which is characterized by that items in the molecule network window and in the information window related with each other are operated interlinked with each other. A molecule function network with information on bio-events including pathological events can be processed and displayed flexibly using a computer.

Description

TECHNICAL FIELD[0001]The present invention belongs to a field of biological information processing, and particularly relates to a graphical interface, a program, a device, and a media for displaying and operating information related to a biomolecule and its functions, and information related to a phenomenon in an organism and a disease.BACKGROUND ART[0002]In an organism, various molecules such as amino acids, peptides, lipids, carbohydrates, and small molecules exist along with biomolecules such as nucleic acids and proteins. These biomolecules function by making specific relations such as binding, competition, interaction, and enzyme reaction with other molecules in an organism. Molecules taken from the outside of an organism such as drug molecules or nutrients also participate in or influence functions of the organism by making specific relations with the biomolecules. Such intermolecular relations in an organism can be represented as a graph wherein molecules are shown as apexes ...

Claims


Application Information

Patent Timeline
Patent Type & Authority Applications(United States)
IPC IPC(8): G06F17/30G16B5/00G16B50/10
CPCG06F19/12G06F19/26G06F19/28G16B5/00G16B45/00G16B50/00G16B50/10
Inventor ITAI, AKIKOTOMIOKA, NOBUOSHIGETAKA, MAKOTOFUKUDA, MIKIOZEKI, YOHEI
Owner INST OF MEDICINAL MOLECULAR DESIGN
Learn More