
System and Methods for Determination of Analyte Concentration Using Time Resolved Amperometry

a technology of time-resolved amperometry and analyte concentration, applied in the field of diagnostic testing systems, can solve the problems of inaccuracy of glucose reading, inability to detect and analyze the signal, and adverse effects of electrochemical biosensors

Active Publication Date: 2009-04-23
TRIVIDIA HEALTH
View PDF14 Cites 24 Cited by
  • Summary
  • Abstract
  • Description
  • Claims
  • Application Information

AI Technical Summary

Benefits of technology

[0003]The present disclosure relates to a biosensor system for measuring an analyte in a bodily fluid, such as blood. The system includes a process and system for improved determination of analyte concentration over a wide range of analyte concentrations.
[0005]The use of such electrochemical sensors to detect analytes in bodily fluids, such as blood or blood derived products, tears, urine, and saliva, has become important, and in some cases, vital to maintain the health of certain individuals. In the health care field, people such as diabetics, for example, must monitor a particular constituent within their bodily fluids. A number of systems are capable of testing a body fluid, such as, blood, urine, or saliva, to conveniently monitor the level of a particular fluid constituent, such as, cholesterol, proteins, and glucose. Patients suffering from diabetes, a disorder of the pancreas where insufficient insulin production prevents the proper digestion of sugar, have a need to carefully monitor their blood glucose levels on a daily basis. Routine testing and controlling blood glucose for people with diabetes can reduce their risk of serious damage to the eyes, nerves, and kidneys.
[0008]Variations in a volume of red blood cells within blood can cause variations in glucose readings measured with disposable electrochemical test strips. Typically, a negative bias (i.e., lower calculated analyte concentration) is observed at high hematocrits, while a positive bias (i.e., higher calculated analyte concentration) is observed at low hematocrits. At high hematocrits, for example, the red blood cells may impede the reaction of enzymes and electrochemical mediators, reduce the rate of chemistry dissolution since there less plasma volume to solvate the chemical reactants, and slow diffusion of the mediator. These factors can result in a lower than expected glucose reading as less current is produced during the electrochemical process. Conversely, at low hematocrits, less red blood cells may affect the electrochemical reaction than expected, and a higher measured current can result. In addition, the blood sample resistance is also hematocrit dependent, which can affect voltage and / or current measurements.
[0009]Several strategies have been used to reduce or avoid hematocrit based variations on blood glucose. For example, test strips have been designed to incorporate meshes to remove red blood cells from the samples, or have included various compounds or formulations designed to increase the viscosity of red blood cell and attenuate the affect of low hematocrit on concentration determinations. Other test strips have included lysis agents and systems configured to determine hemoglobin concentration in an attempt to correct hematocrit. Further, biosensors have been configured to measure hematocrit by measuring optical variations after irradiating the blood sample with light, or measuring hematocrit based on a function of sample chamber fill time. These methods have the disadvantages of increasing the cost and complexity of test strips and may undesirably increase the time required to determine an accurate glucose measurement.
[0010]In addition, alternating current (AC) impedance methods have also been developed to measure electrochemical signals at frequencies independent of a hematocrit effect. Such methods suffer from the increased cost and complexity of advanced meters required for signal filtering and analysis.
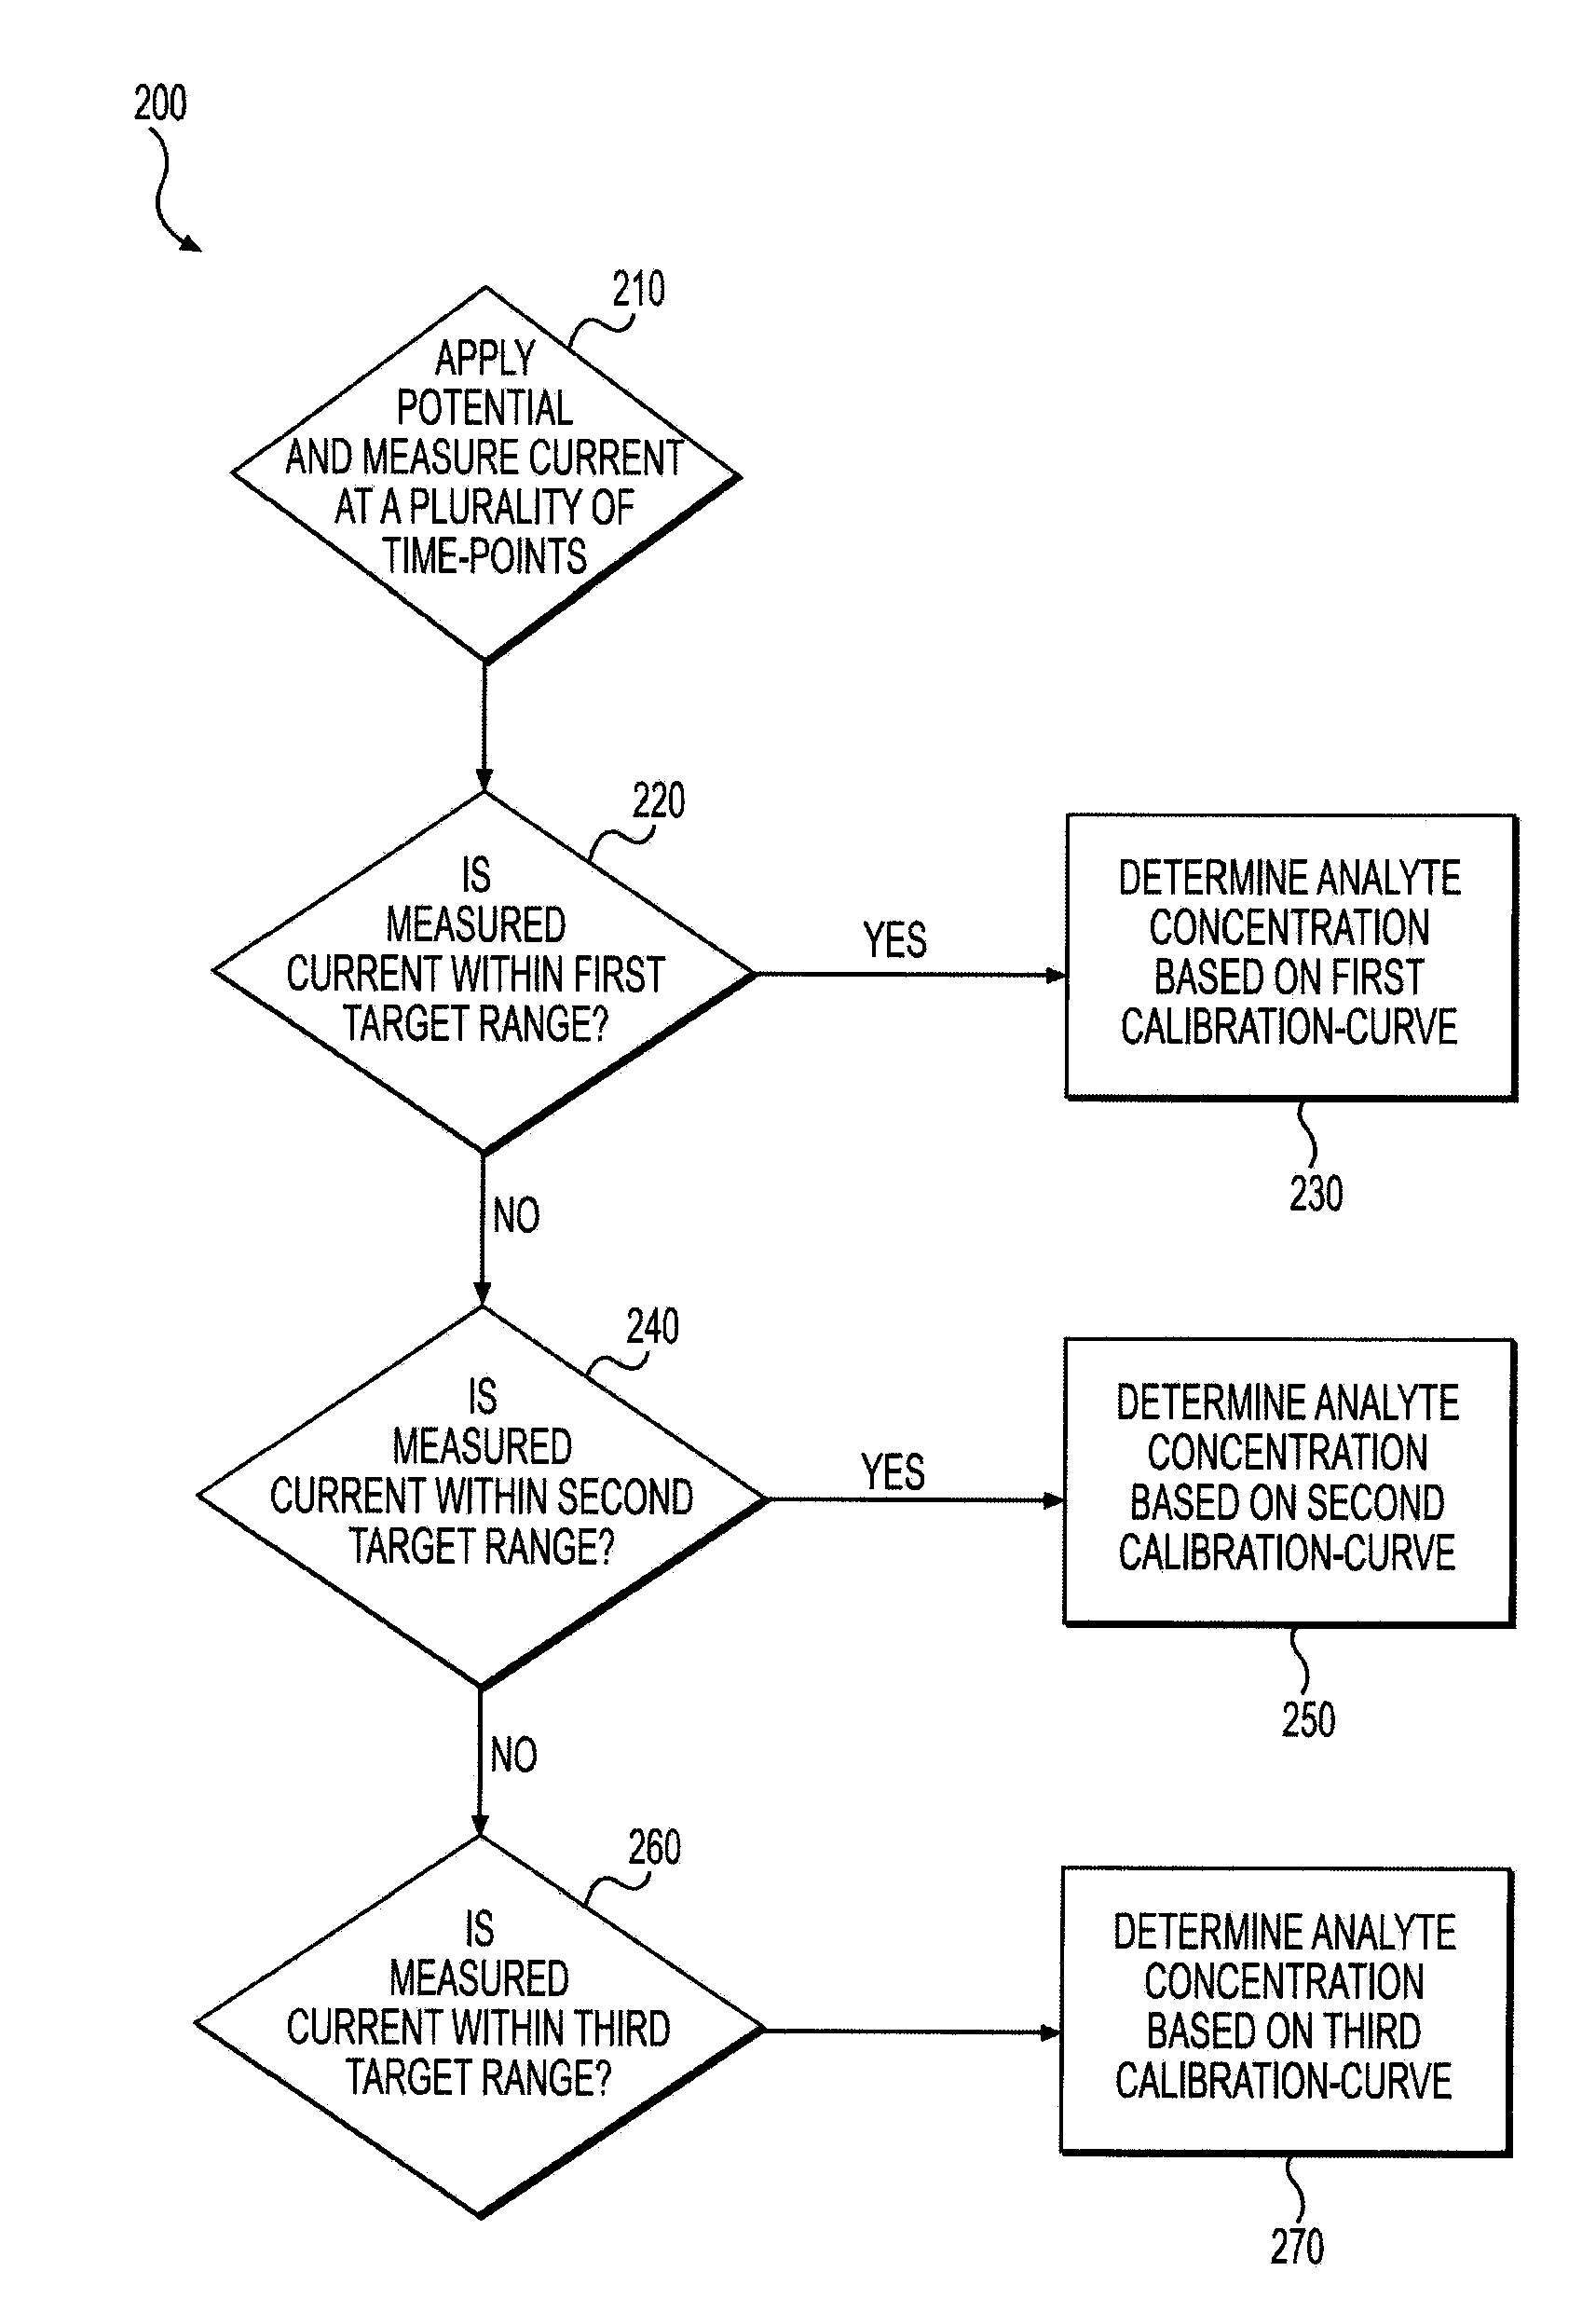
[0012]Some embodiments of this invention are directed to methods and systems for determining a concentration of an analyte using one or more current decay curves. Other embodiments of this invention use two or more time segments from the current decay curves. Current decay curves can represent a gradual decrease in measured current response following application of a potential excitation to a biosensor containing a fluid sample. Fluid samples containing similar analyte concentrations but different sample matrix (e.g. different hematocrit values) can produce different current decay curves. However, these current decay curves were found to converge to a common value over time under certain conditions. Generally, fluid samples containing low analyte concentrations can converge faster than fluid samples containing high analyte concentrations. Based on this convergence behavior, an analyte concentration can be more accurately determined by dynamically selecting an appropriate time segment and a calibration curve associated with the selected time segment.

Problems solved by technology

In some instances, electrochemical biosensors may be adversely affected by the presence of certain blood components that may undesirably affect the measurement and lead to inaccuracies in the detected signal.
This inaccuracy may result in an inaccurate glucose reading, leaving the patient unaware of a potentially dangerous blood sugar level, for example.
As one example, the particular blood hematocrit level (i.e. the percentage of the amount of blood that is occupied by red blood cells) can erroneously affect a resulting analyte concentration measurement.
At high hematocrits, for example, the red blood cells may impede the reaction of enzymes and electrochemical mediators, reduce the rate of chemistry dissolution since there less plasma volume to solvate the chemical reactants, and slow diffusion of the mediator.
These methods have the disadvantages of increasing the cost and complexity of test strips and may undesirably increase the time required to determine an accurate glucose measurement.
Such methods suffer from the increased cost and complexity of advanced meters required for signal filtering and analysis.

Method used


Image

  • System and Methods for Determination of Analyte Concentration Using Time Resolved Amperometry
  • System and Methods for Determination of Analyte Concentration Using Time Resolved Amperometry
  • System and Methods for Determination of Analyte Concentration Using Time Resolved Amperometry

Examples


Embodiment Construction

[0001]This application claims priority to U.S. Provisional Patent Application No. 60 / 952,076, filed Jul. 26, 2007, which is incorporated herein by reference in its entirety

FIELD OF THE INVENTION

[0002]The present invention relates to the field of diagnostic testing systems for determining the concentration of an analyte in a solution and, more particularly, to systems and methods for measuring an analyte concentration using time resolved amperometry.

BACKGROUND OF THE INVENTION

[0003]The present disclosure relates to a biosensor system for measuring an analyte in a bodily fluid, such as blood. The system includes a process and system for improved determination of analyte concentration over a wide range of analyte concentrations.

[0004]Electrochemical sensors have long been used to detect or measure the presence of substances in fluid samples. Electrochemical sensors include a reagent mixture containing at least an electron transfer agent (also referred to as an “electron mediator”) and ...


PUM

PropertyMeasurementUnit
timeaaaaaaaaaa
timeaaaaaaaaaa
timeaaaaaaaaaa

Abstract

This invention is a method for determining a concentration of an analyte. The steps include applying a potential excitation to a fluid sample containing an analyte, and measuring a current associated with the potential excitation at a plurality of time-points. The method also includes calculating an analyte concentration based on the measured current and a calibration curve, wherein the calibration curve is selected from a plurality of calibration curves and each calibration curve is associated with a time-segment selected from a plurality of time-segments.

Description

DESCRIPTION OF THE INVENTION[0001]This application claims priority to U.S. Provisional Patent Application No. 60 / 952,076, filed Jul. 26, 2007, which is incorporated herein by reference in its entiretyFIELD OF THE INVENTION[0002]The present invention relates to the field of diagnostic testing systems for determining the concentration of an analyte in a solution and, more particularly, to systems and methods for measuring an analyte concentration using time resolved amperometry.BACKGROUND OF THE INVENTION[0003]The present disclosure relates to a biosensor system for measuring an analyte in a bodily fluid, such as blood. The system includes a process and system for improved determination of analyte concentration over a wide range of analyte concentrations.[0004]Electrochemical sensors have long been used to detect or measure the presence of substances in fluid samples. Electrochemical sensors include a reagent mixture containing at least an electron transfer agent (also referred to as ...

Claims


Application Information

Patent Timeline
Patent Type & Authority Applications(United States)
IPC IPC(8): C12Q1/32G01N27/26C12Q1/54
CPCG01N27/3273
Inventor DENG, DAVID
Owner TRIVIDIA HEALTH
Learn More