Estimation of process control parameters over predefined travel segments

a technology of process control and parameter estimation, applied in the field of process control networks, can solve the problems that the individual control devices of one or more process control devices cannot be tuned out of the control loop, the system experiences “instability”, and the poor control loop performance may still be caused, so as to facilitate visual and statistical comparison

Active Publication Date: 2009-09-03
FISHER CONTROLS INT LLC
View PDF20 Cites 56 Cited by
  • Summary
  • Abstract
  • Description
  • Claims
  • Application Information

AI Technical Summary

Benefits of technology

[0012]A method of estimating a process control parameter of a device over a segment of travel of a moveable component of the device allows an operator or engineer to determine whether the moveable part operates improperly in one or more sections within the full range of operation of the moveable part. In particular, the method obtains measurements of a signal inside a process control loop, stores the measured signal as signal data, partitions the signal data into several sections corresponding to various segments of travel or operation, and performs an analysis on some or all of the sections of the signal data to determine parameter estimates for one or more segments. In one aspect, the sections of data correspond to non-overlapping segments of equal size to facilitate visual and statistical comparison between segments. In another aspect, the signal data may be partitioned into segments according to a specified percentage of travel, to a desired number of segments, or to a predefined amount of data contained in an individual segment.

Problems solved by technology

While a process control system generally uses these feedback signals, along with other signals, as inputs to a highly tuned, centralized control algorithm that effects overall control of a process, it has been discovered that poor control loop performance may still be caused by poor operating conditions of the individual control devices connected within the control loop including, for example, instabilities within the process control loop.
A system experiences “instability” when it cannot reach an equilibrium point during operation.
In many cases, problems associated with one or more of the individual process control devices cannot be tuned out of the control loop by the process control system and, as a result, the poorly performing control loops are placed in manual or are detuned to the point where they are effectively in manual control.
If the system settles down, they know that it is a tuning problem, not a hardware problem.
If the output of the controller is a triangle wave and the process variable is a square wave, they will often conclude that the control valve is sticking.
These ad-hoc procedures are used by many plant operators, but include several limitations.
For example, the first procedure requires the operator to put the system into manual control, which may not be allowed, especially on runaway processes.
The second procedure is good for identifying limit cycles induced by the process control loop but is not capable of tracking down instabilities in the servo loop.
Moreover, correlation between a command signal and a process variable is not always straightforward due to complications such as integrating process dynamics, nonlinear process dynamics, cross-coupled process dynamics, and process disturbances.
Instabilities in the servo loop can be particularly difficult to discern because plant personnel do not have access to the internal state variables of a control valve.
Additional problems arise when instabilities are influenced by the process fluid, as is the case with negative gradients.
One of the problems that may be monitored is the detection of instabilities in a process loop or a control device.
In the past, it was not easy to determine the source or cause of an instability within a process control loop without having a technician review and diagnose the system, which could be time consuming and costly.
Alternatively, operators have had to wait until a process is halted or is undergoing a scheduled shut-down to test the individual process control devices within the process which might be the source of instability.
Each of these options is time consuming, expensive, and only provides intermittent determination of instabilities in a system.
Still further, none of these methods is particularly suited to determine the source or cause of instability while the process is operating on-line, i.e., without disturbing or shutting the process down.
However, the method discussed in the U.S. Pat. No. 6,466,893 is limited to determining an average value of a process control parameter over an entire range covered by the available data.
As one of ordinary skill in the art will recognize, high friction in a particular section may indicate that the valve is “sticking” and responding poorly to the control signal or unable to provide proper shutoff.
Unfortunately, the average friction value effectively masks aberrant friction values of the potentially problematic sections.
Thus, the average value may simply fail to reflect that one or more segments is faulty.
Moreover, even when the average value properly indicates that a problem exists, this value alone cannot point to the specific segment of travel or range of operation that may require attention.
For example, based on an unsatisfactory average value of friction of a sliding stem valve, one may decide that an entire component of the valve (or even the entire valve) may need to be replaced.

Method used


Image

  • Estimation of process control parameters over predefined travel segments
  • Estimation of process control parameters over predefined travel segments
  • Estimation of process control parameters over predefined travel segments

Examples


Embodiment Construction

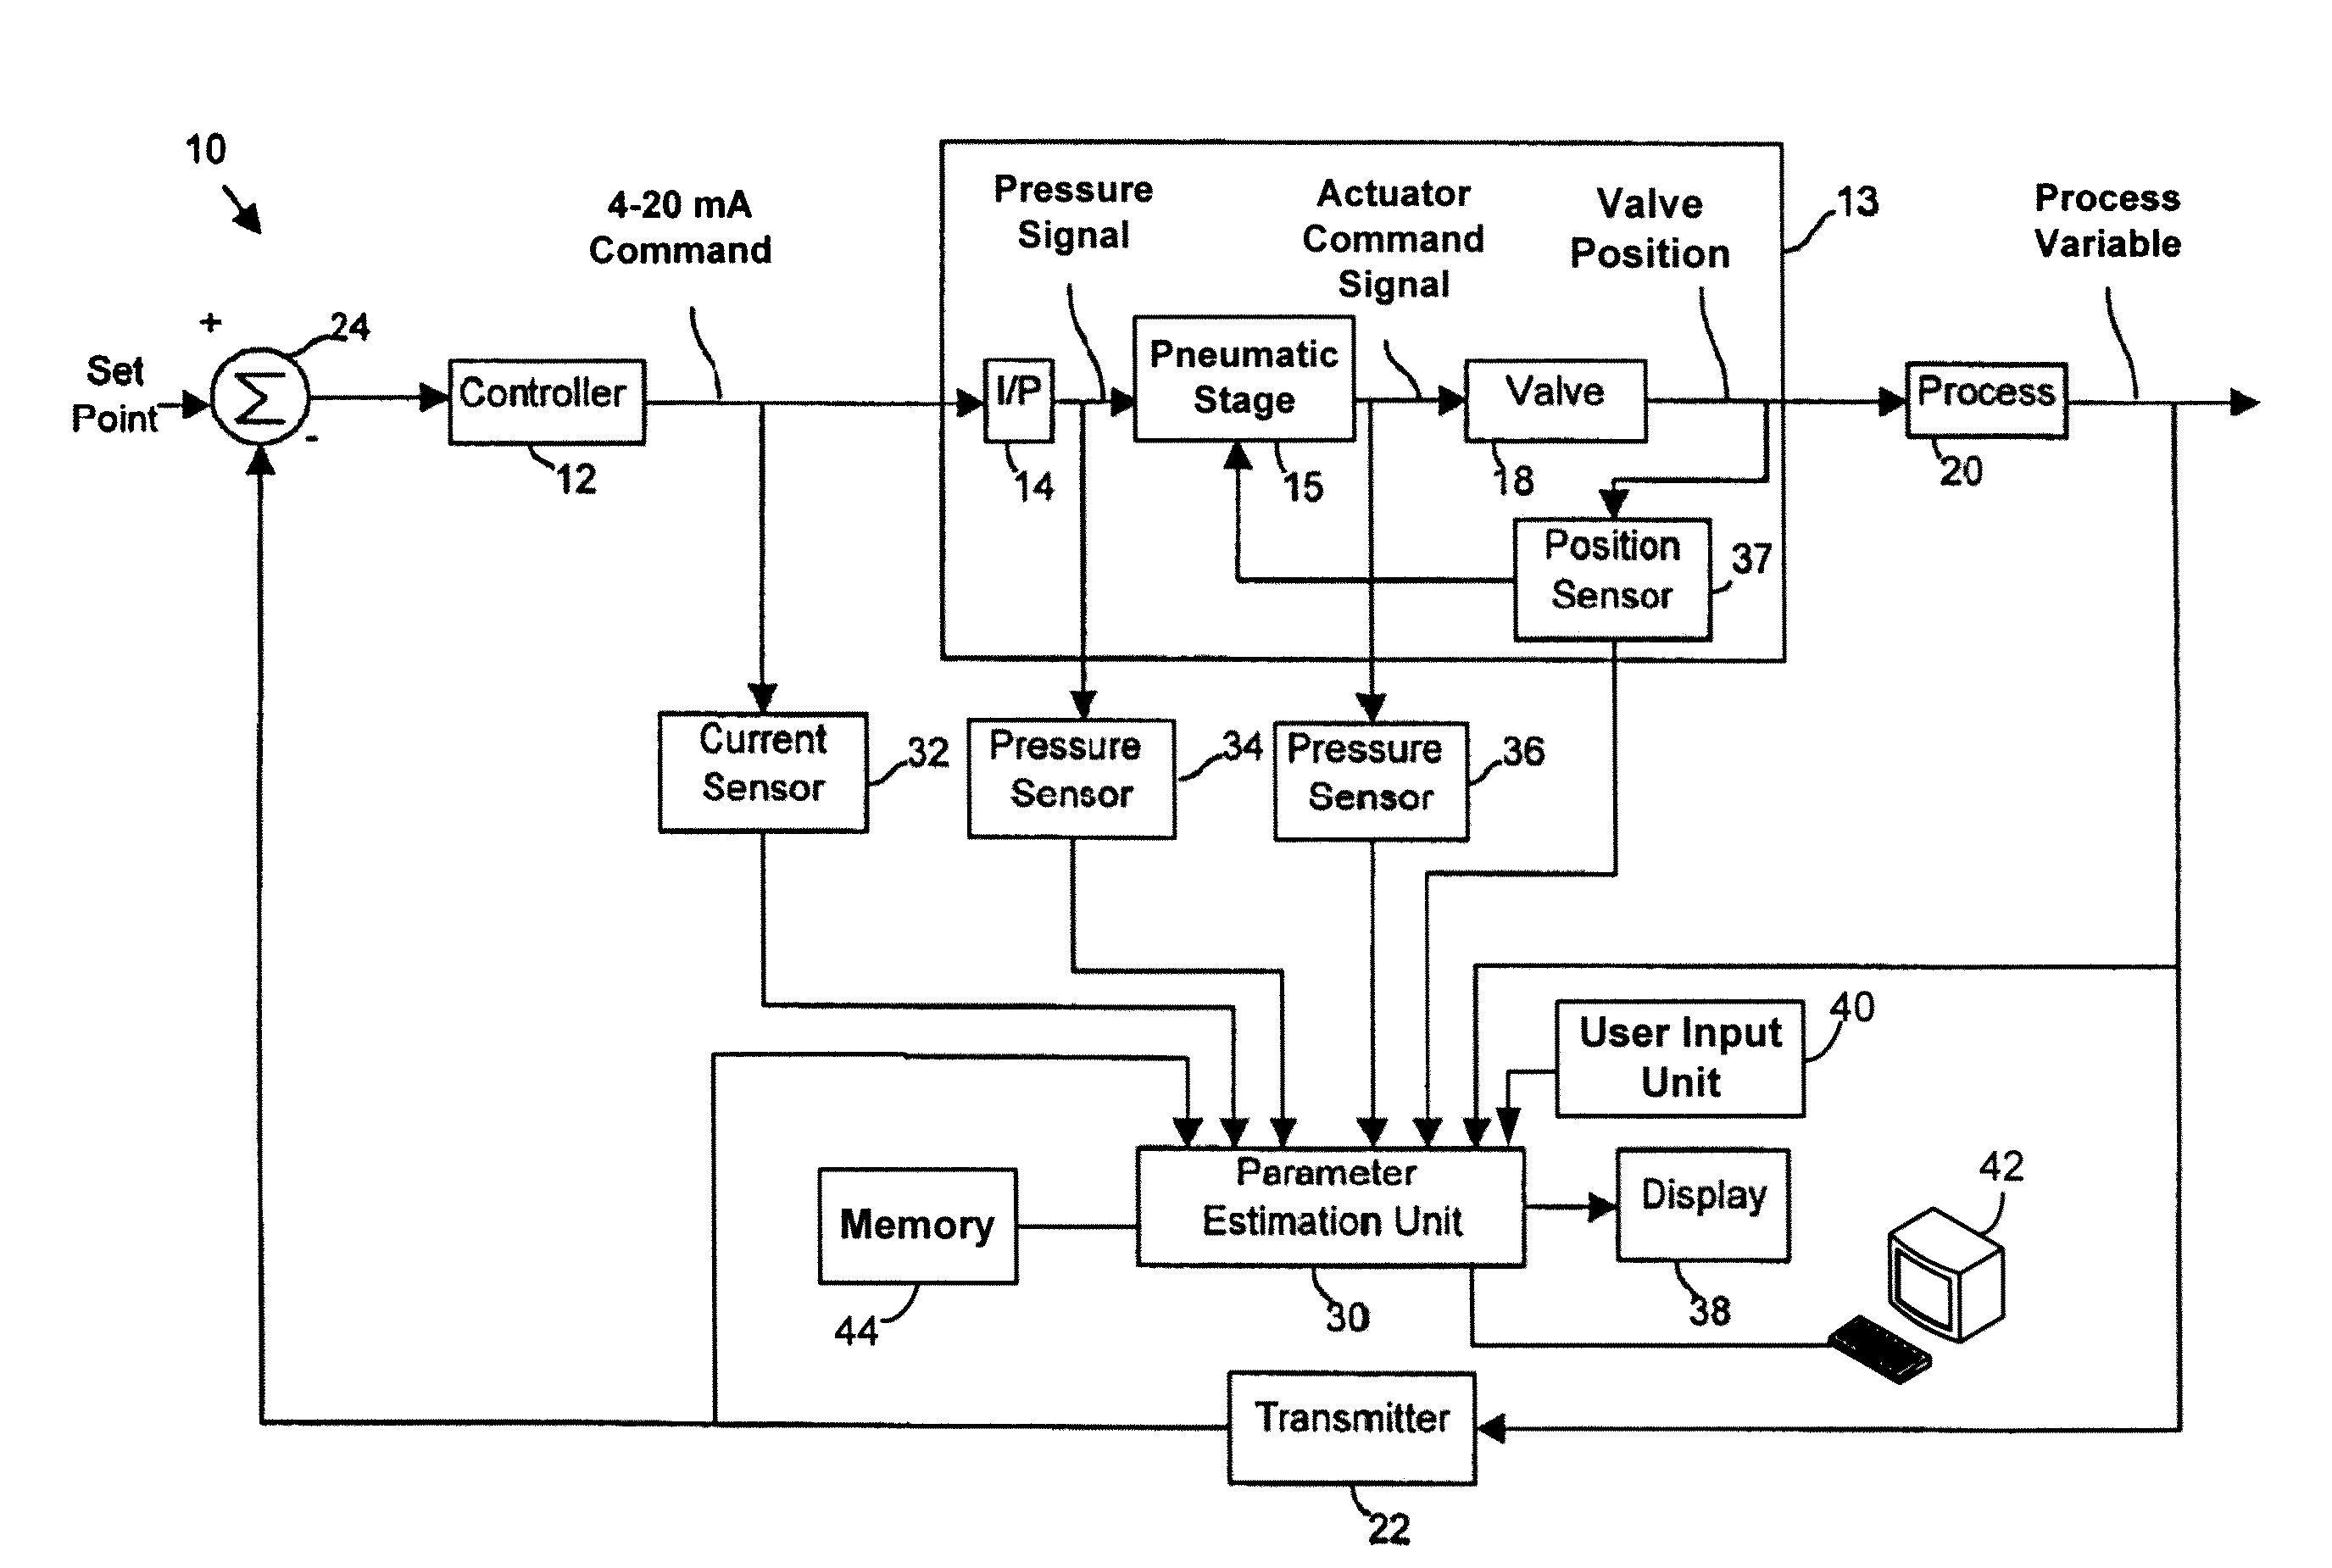
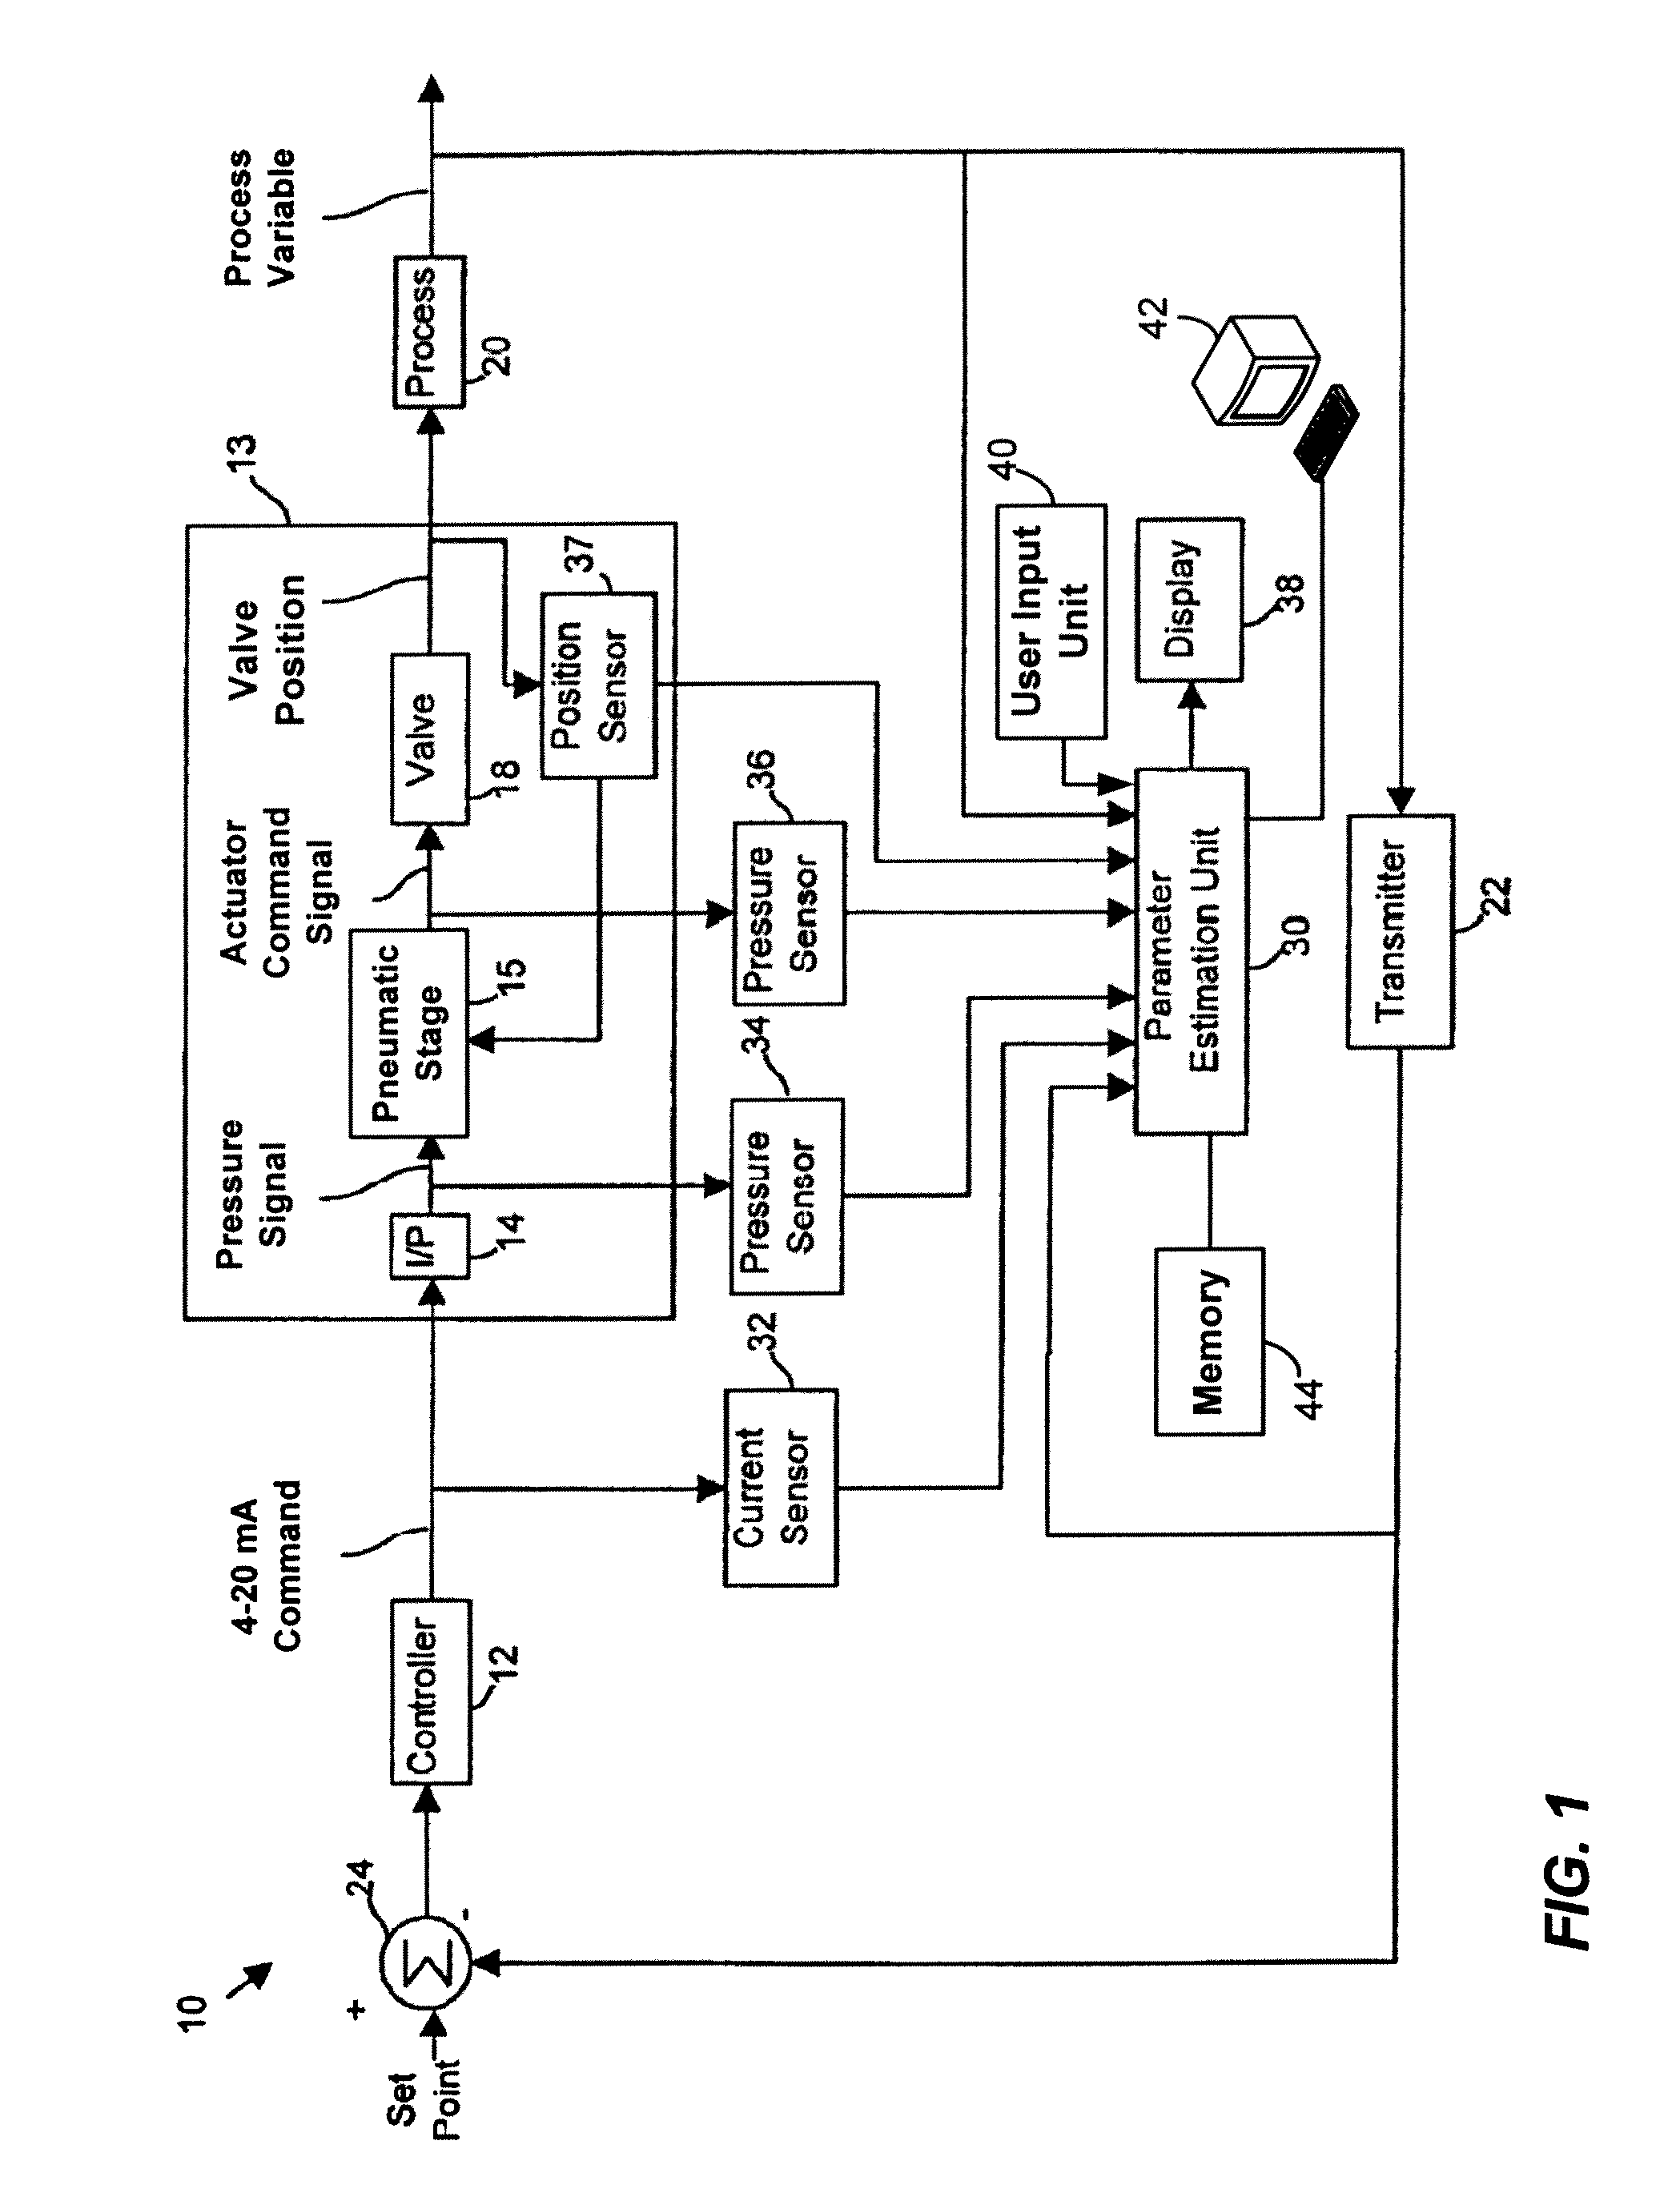
[0027]Referring to FIG. 1, a single-input, single-output process control loop 10 is illustrated as including a process control system 12 that sends, for example, a 4 to 20 mA command signal to a process control device 13 such as a control valve assembly. The process control device 13 is illustrated as including a current-to-pressure transducer (I / P) 14 that (typically) sends a 3 to 15 psig pressure signal to a valve pneumatic stage 15 such as a pneumatic positioner and actuator or a pneumatic relay and / or an actuator which, in turn, pneumatically controls a valve 18 with a pressure signal (air). Operation of the valve 18 controls the articulation of a movable valve member disposed therein (not shown) which, in turn, controls a process variable within a process 20. As is standard, a transmitter 22 measures the process variable of the process 20 and transmits an indication of the measured process variable to a summing junction 24. The summing junction 24 compares the measured value of...


PUM


Abstract

A method of determining a segment-specific estimate of a parameter associated with a process control loop includes receiving signal data corresponding to a signal from a process control loop, storing the signal data, partitioning the stored signal data into a plurality of data segments and performing a statistical analysis on a first one of the plurality of data segments selected from the plurality of data segments to generate a first segment-specific parameter estimate.

Description

FIELD OF THE INVENTION[0001]The present invention relates generally to process control networks and, more particularly, to a method of statistically determining an estimate of a process control loop parameter over a predetermined segment of travel or operation.DESCRIPTION OF THE RELATED ART[0002]Large scale commercial manufacturing and refining processes typically use a process controller system to control the operation of one or more process control devices such as valves, based on feedback from one or more sensors, such as position, flow, temperature or other types of sensors. Each set of such process control devices, valves, and sensor devices form what is generally referred to as a process control loop. Furthermore, each valve or other device may, in turn, include an inner loop wherein, for example, a valve positioner controls a valve actuator to move a control element, such as a valve plug, in response to a control signal and obtains feedback from a sensor, such as a position s...

Claims


Application Information

Patent Timeline
Patent Type & Authority Applications(United States)
IPC IPC(8): G06F17/00
CPCG05B23/0235F16K37/0083F16K37/0091G05B2219/24077
Inventor LATWESEN, ANNETTE L.
Owner FISHER CONTROLS INT LLC
Why Eureka
Try Eureka