Network failure detection method and network failure detection system

a network failure and detection method technology, applied in the field of network failure detection methods and network failure detection systems, can solve the problems of not being able to grasp, hardly offering any definite clue enough, etc., and achieve the effect of reducing the time necessary, enhancing the severity of anomalies of each column, and facilitating estimation

Inactive Publication Date: 2009-10-22
TOHOKU UNIV
View PDF1 Cites 45 Cited by
  • Summary
  • Abstract
  • Description
  • Claims
  • Application Information

AI Technical Summary

Benefits of technology

[0035]According to the aspect of the invention as described in claim 7 or 18, for a matrix constituted of the occurrence probabilities of correlation coefficients, the total number of elements whose values are equal to or less than a threshold is counted, or the total number of elements for each column or for each row whose occurrence probabilities are equal to or less than a threshold is counted, and the severity of an anomaly of interest is quantitatively determined based on the count, and this calculation method enhances the severity of anomaly of each column or each row. Thus, the inventive method or system allows the readier identification of the cause of an anomaly as compared with the conventional method or system.
[0036]According to the aspect of the invention as described in claims 8 and 9, or claim 19 and 20, plural probability distribution vectors representing a similar anomaly are gathered, and unified into a single profile, and then the similarity of the probability distribution vector of an incident of interest to that profile is evaluated. Thus, it is possible to readily estimate the cause of an anomaly, which will reduce the time necessary for the research to be undertaken for the search.
[0037]According to the aspect of the invention as described in claim 10 or 21, when matrices A and B both constituted of the occurrence probabilities of correlation coefficients are compared, the number of elements whose values are equal to or less than a threshold is counted for each of the matrices, the number of A-B combinations is calculated where the number of subthreshold elements is the same, and the similarity of matrices A and B is quantitatively determined based on the calculation result. This makes it possible to readily estimate the cause of an anomaly, which will reduce the time necessary for the research to be undertaken for the search.
[0038]According to the aspect of the invention as described in claim 11 or 22, it becomes possible to readily grasp the change of the overall state of a network only by taking a cursory look at relevant pictures, which is realized by visualizing the change of the operation state of a network via the change of colors displayed in relevant pictures. This makes it possible to take a proper measure promptly whenever an anomaly occurs. Each time an anomaly or intrusion occurs, pictures representing the anomaly or intrusion are stored and accumulated into a database. Thus, it will be possible, if there occurs an anomaly, to readily grasp the contemporary state of a network at large by taking a cursory look at relevant pictures. This will help to increase the efficiency of network management.

Problems solved by technology

Since the method disclosed in the Japanese Patent Application No. 2005-323007 evaluates the severity of an anomaly by determining correlation coefficients between different feature values, and comparing a histogram derived therefrom with the occurrence probability profile of the corresponding normal histogram, the method will not be able to grasp the overall state of traffics at large, even though it can detect individual anomalies, and thus the method can hardly offer any definite clue sufficiently promptly as to what has happened over the network at a time when the anomaly happens.

Method used


Image

  • Network failure detection method and network failure detection system
  • Network failure detection method and network failure detection system
  • Network failure detection method and network failure detection system

Examples


verification experiment 1

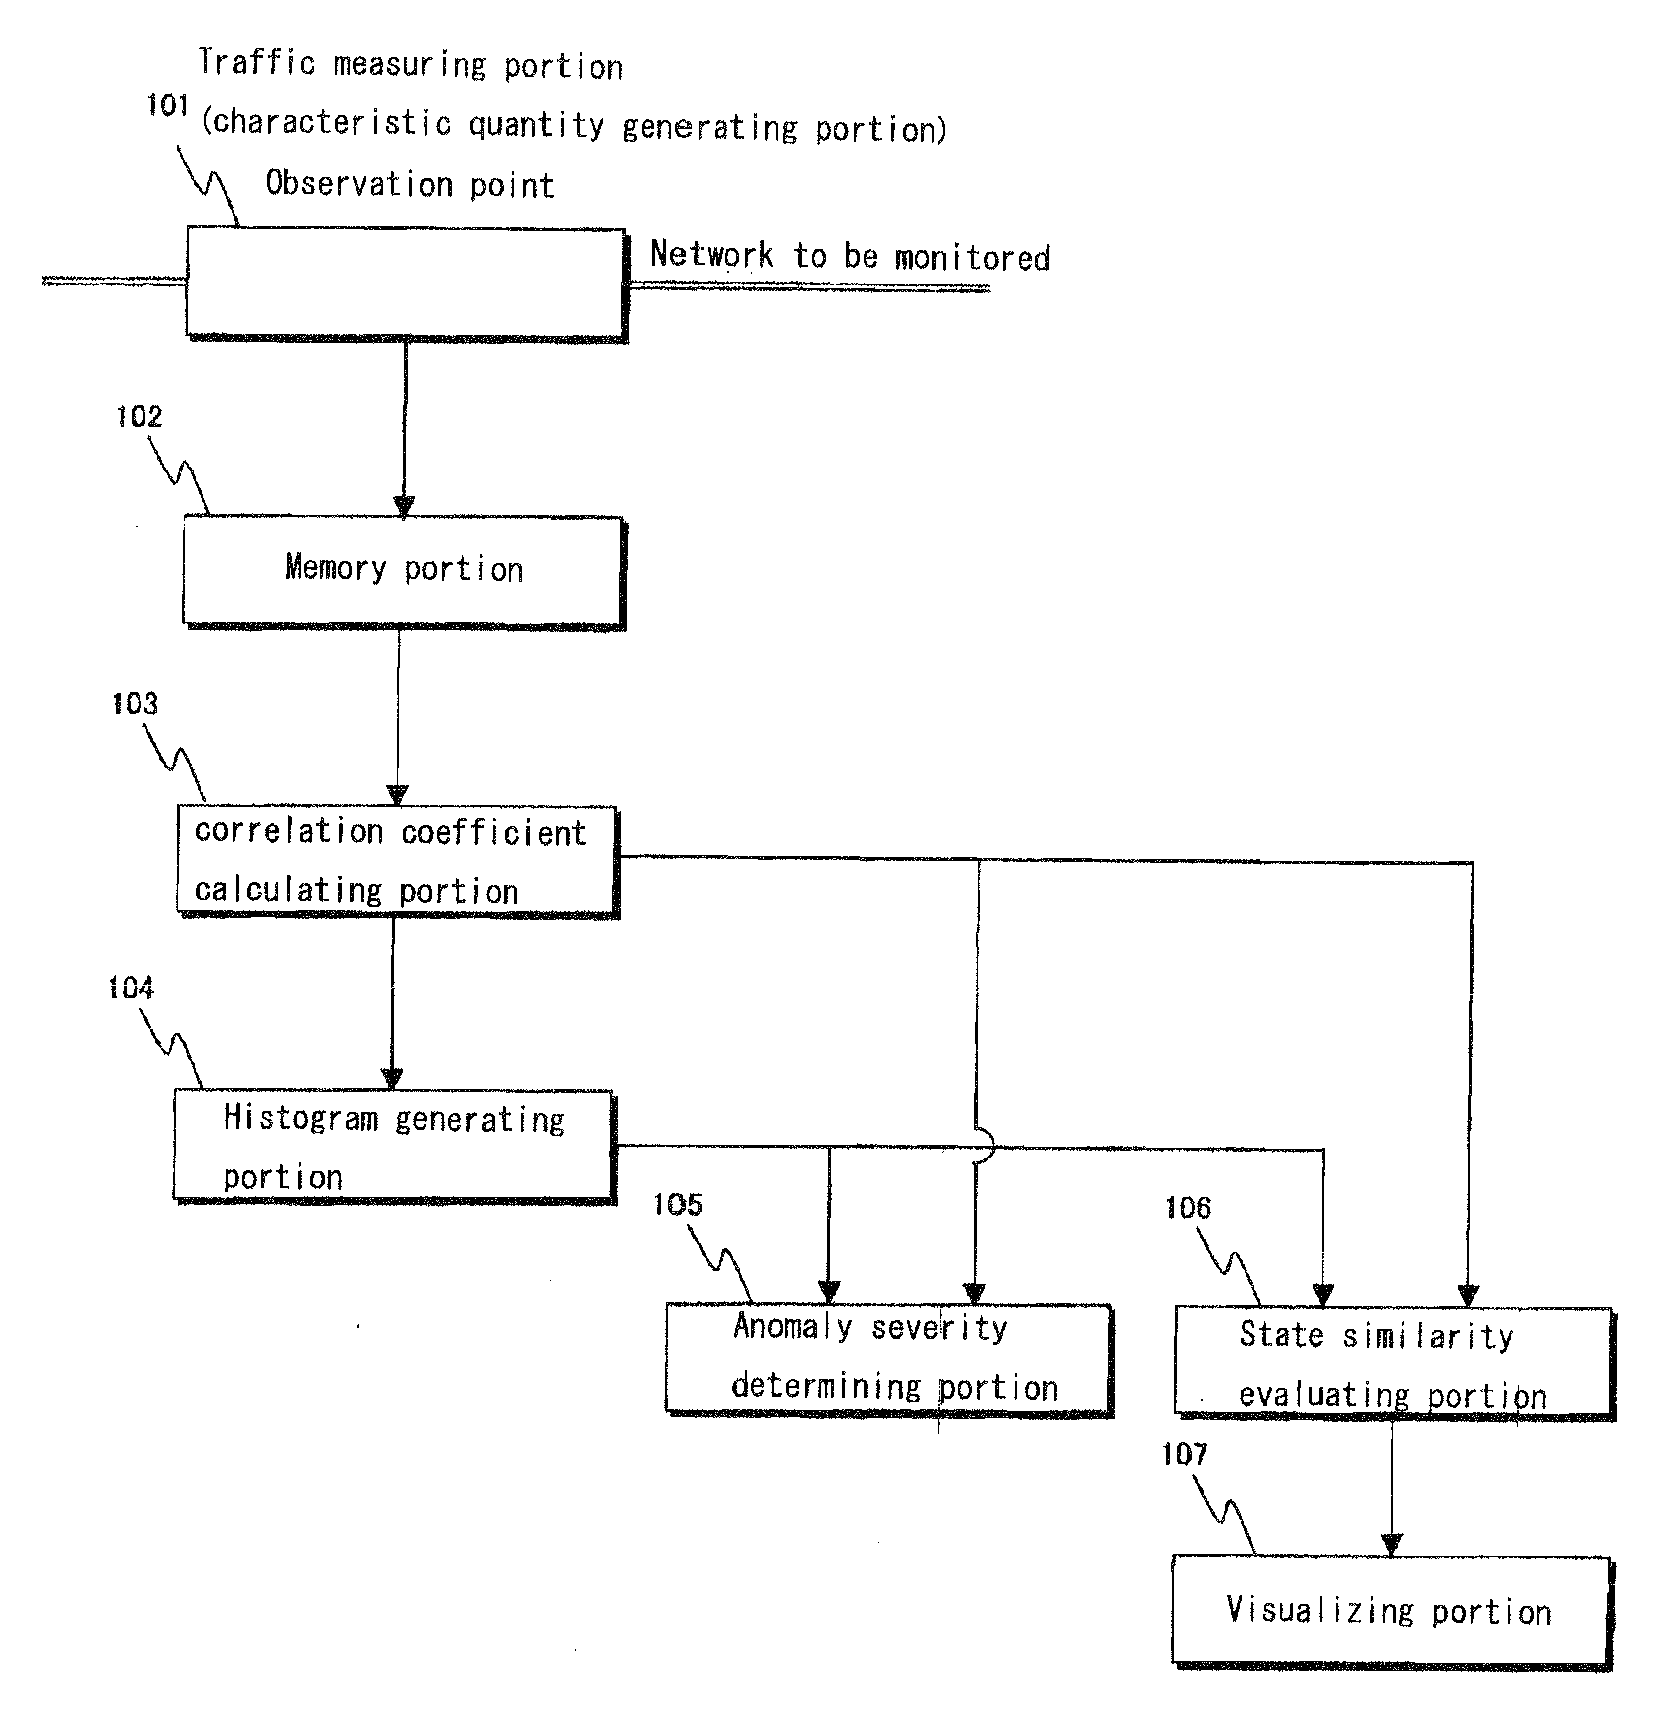
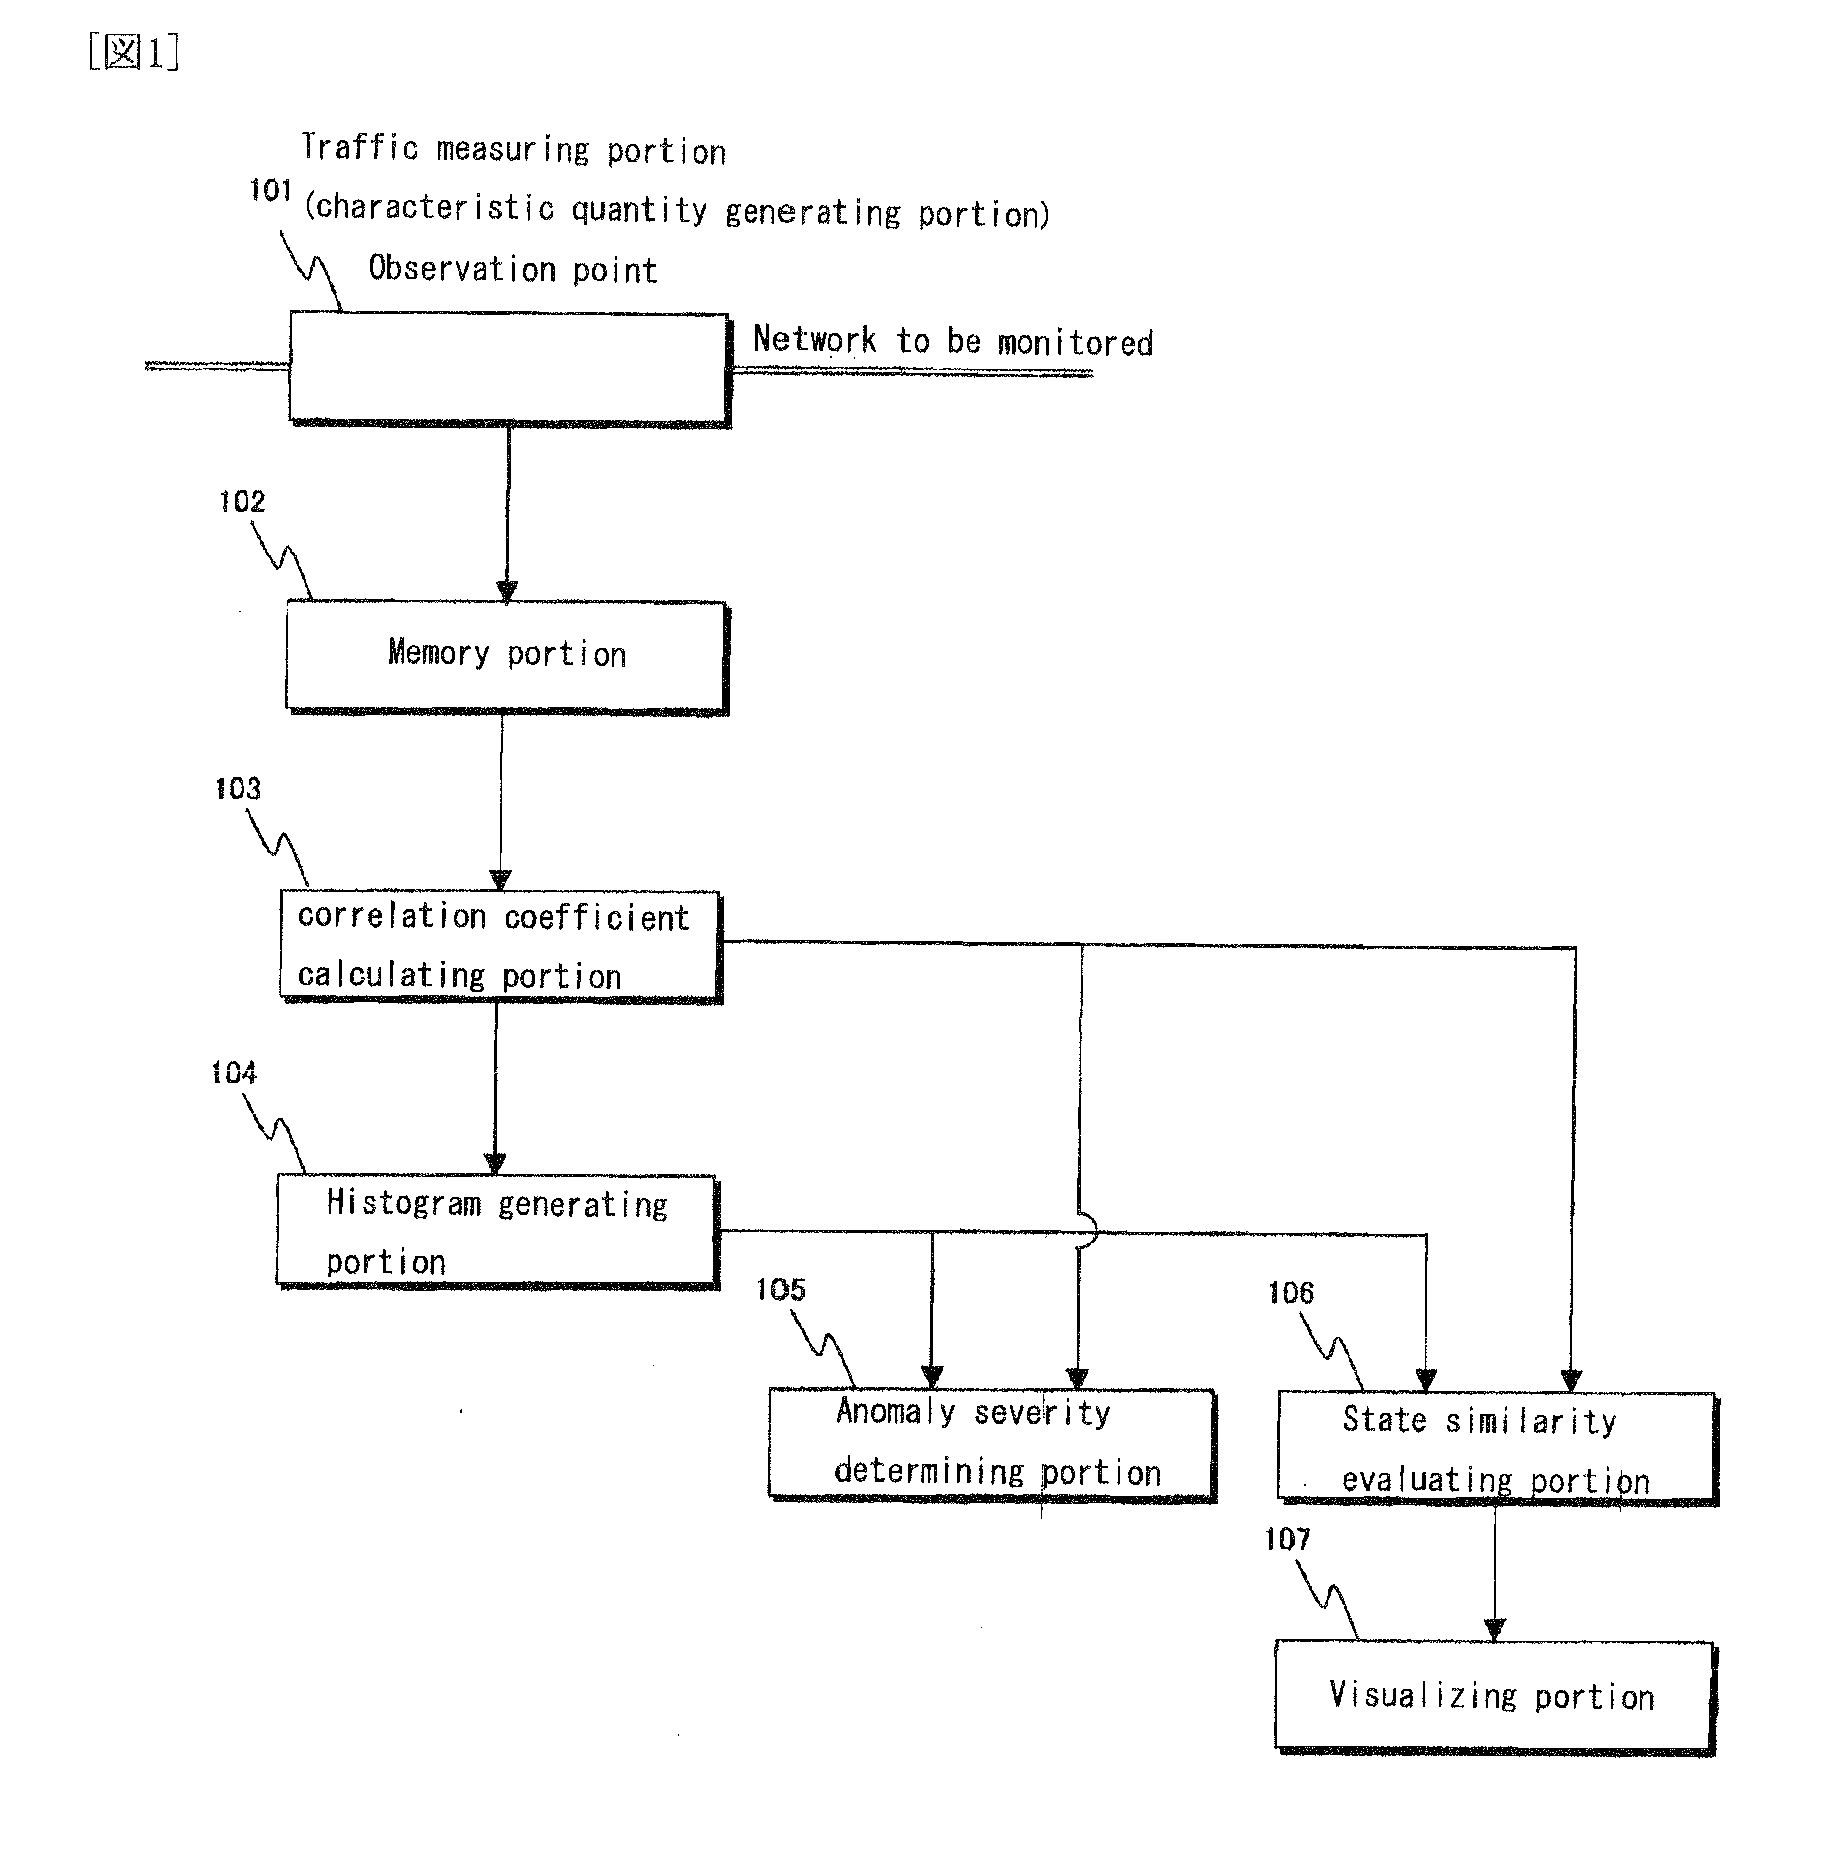
[0101]Next, an experiment will be described to verify how the anomaly severity determining portion 105 of FIG. 1 works in the treatment of traffic flowing through a network in operation.

[0102]First, the first method for evaluating the state of a network for detecting an anomaly as mentioned above will be described. The network used in this experiment is a LAN where about 50 hosts are connected in a configuration as shown in FIG. 8.

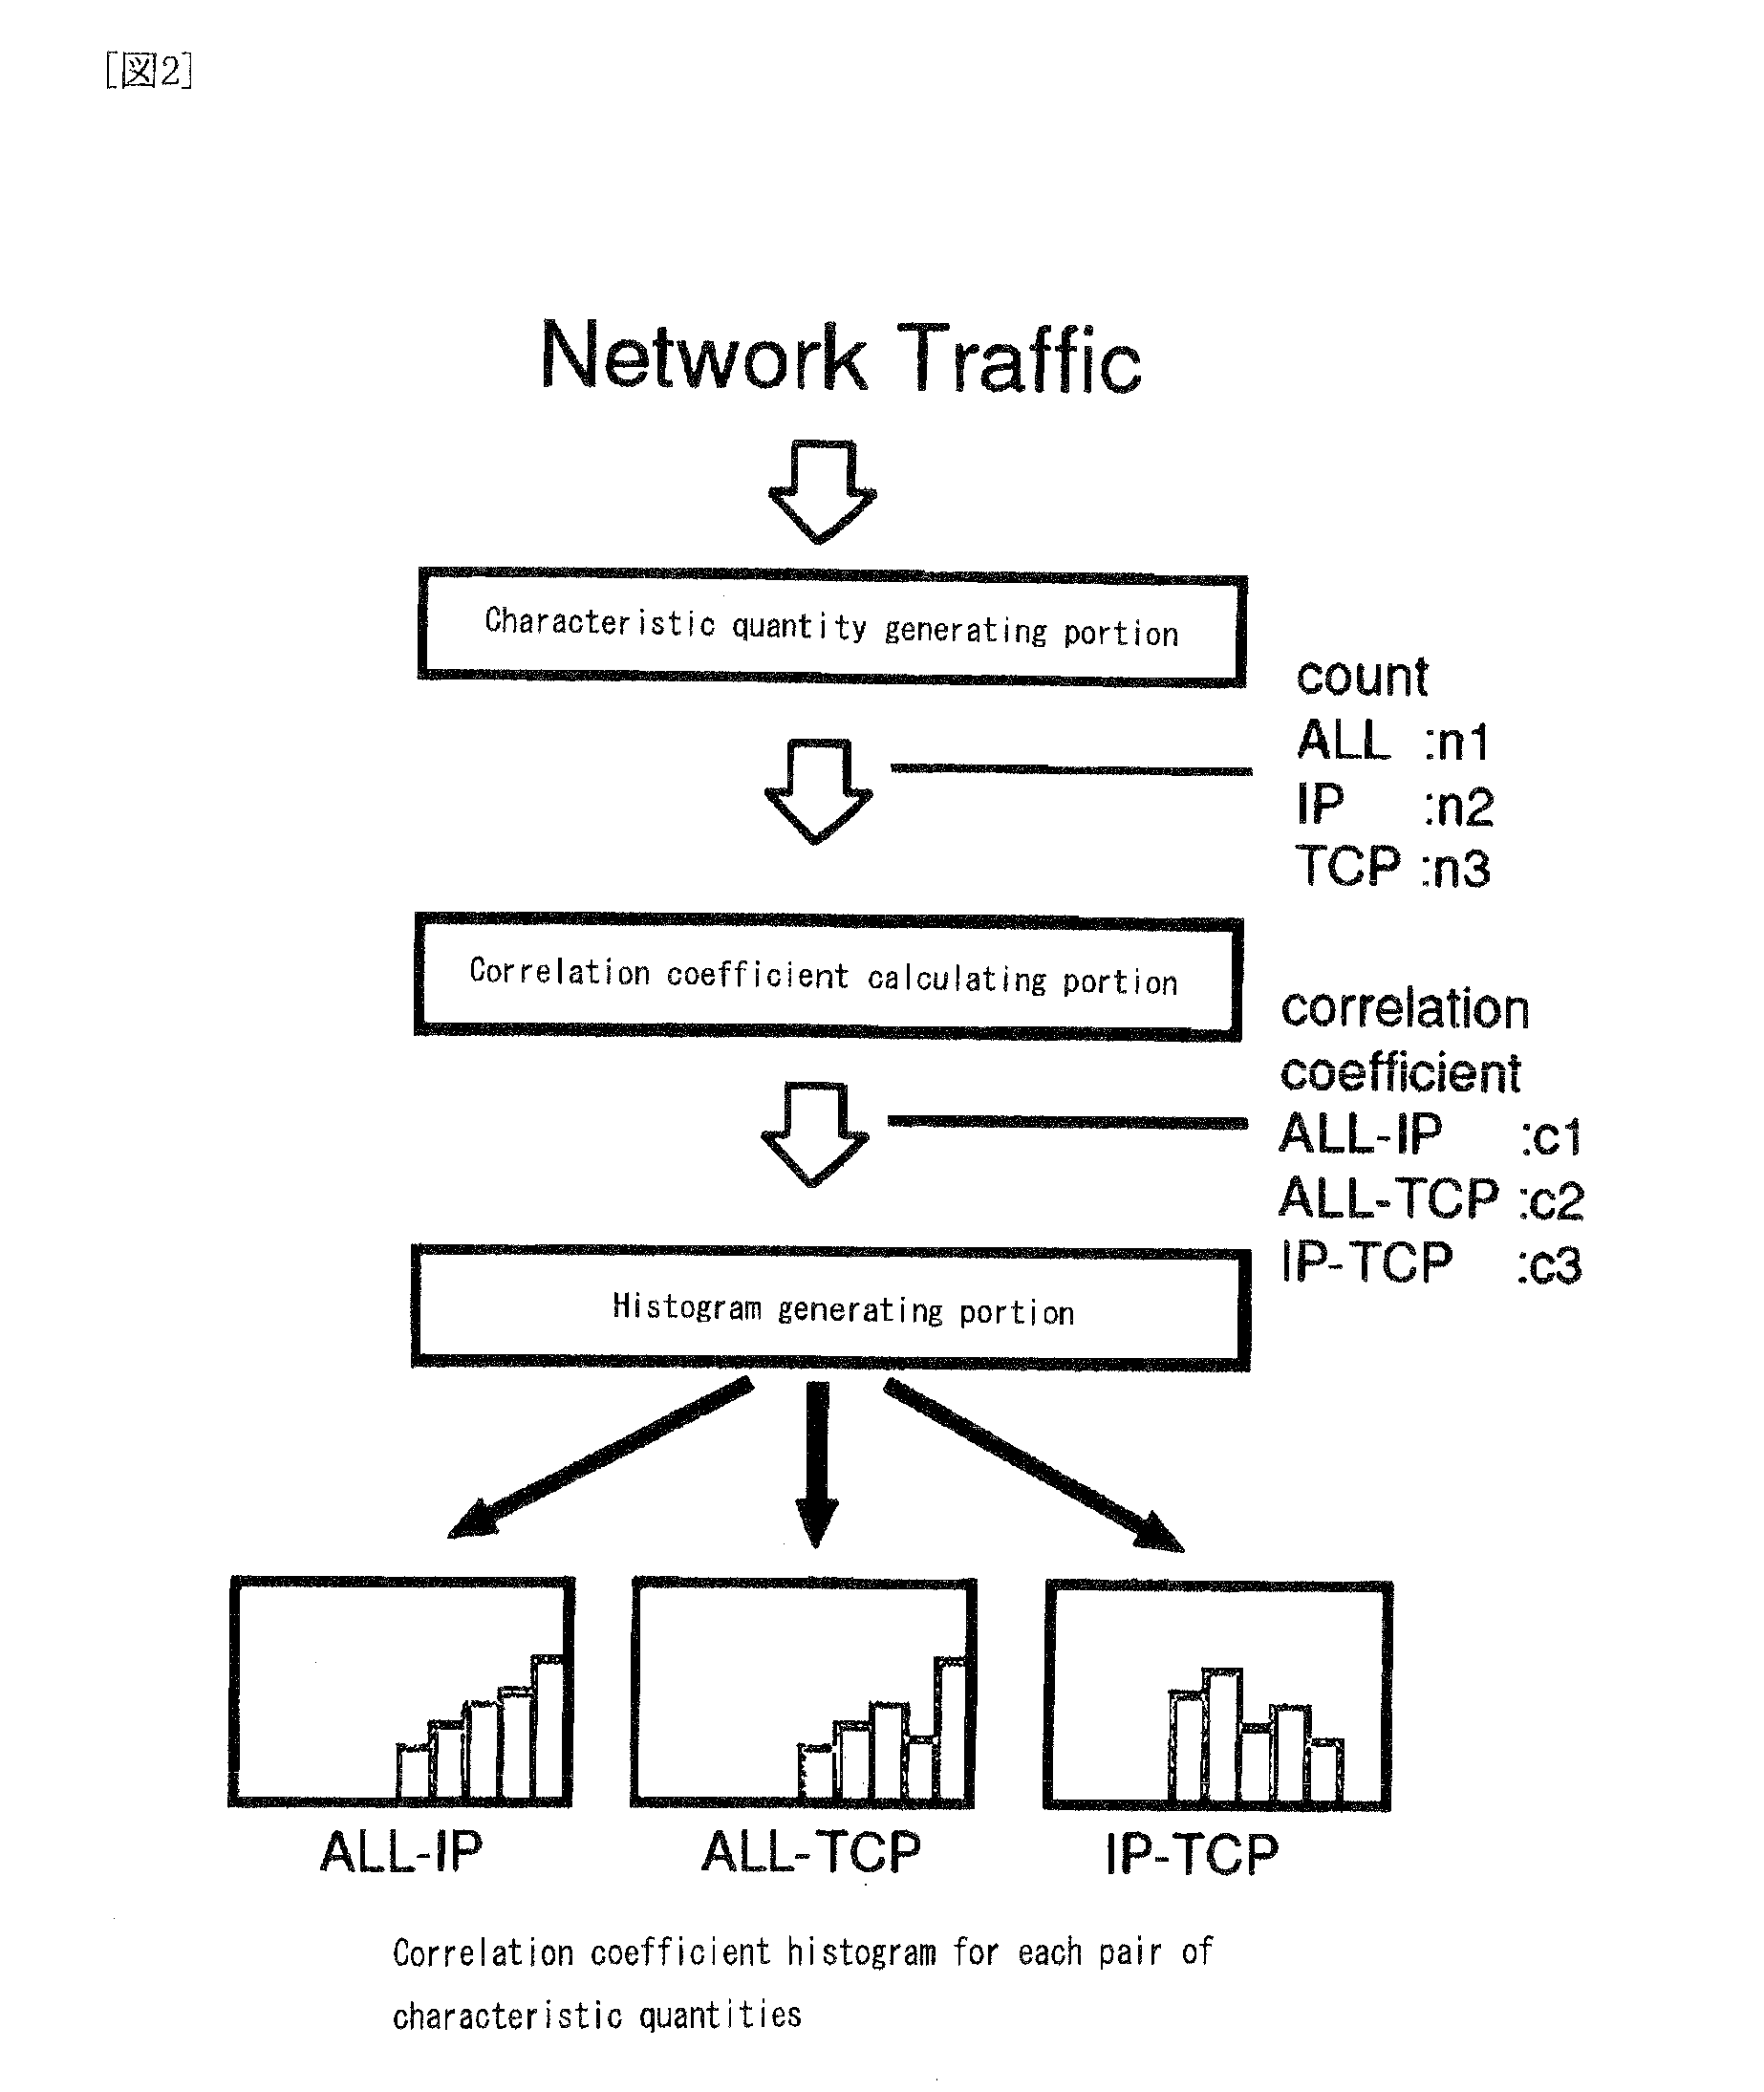
[0103]For the calculation of correlation coefficient, each time slot has a width of 10 seconds; the sliding window has a width corresponding to 30 time slots; and the sliding distance is equal to 5 slots. The experiment was started at a certain day of May, 2005, and a group of histograms were generated daily. The correlation coefficient histogram stands on classes having a width of 0.1. The traffic was divided according to the types described below, and packets within each time slot were counted divided by the types of traffic. The threshold required when ...

example 1

Large Scale Scan

[0125]In certain windows, scanning was found to occur at a specific port of all the hosts, and scanning was also found to occur at various ports of some hosts. For the windows in question, correlation coefficients of a considerable number of combinations exhibited anomalous values, and particularly the majority of the combinations with a high anomalous score include one of the following three feature values: TCP IN / dst:144-1023, TCP IN / dst:1024-2999, TCP IN / SYN

[0126]For example, the combination: TCP IN / SYN and TCP IN / dst:144-1023

rarely shows a strong correlation during the normal operation state of a network. However, as shown in the correlation coefficient histogram shown in FIG. 11, the correlation coefficients observed during the windows in question have a value as high as 0.98. In view of this, a survey was performed on the traffic observed during those windows with a special attention paid to the two feature values, and it was found that large scale scanning d...

example 2

Login attempts to SSH (TCP22)

[0127]For other windows involved, login attempts to SSH (port No. 22) were observed for all the hosts. For example, the combination: TCP IN / SYN-TCP OUT / SYN

which has normally a strong correlation exhibited only a weak positive correlation. Furthermore, the combination: TCP IN / dst:SSH-TCP IN / SYN

which normally rejects the calculation of correlation coefficients exhibited a strong positive correlation with, however, the occurrence probability being very small (FIG. 12).


PUM


Abstract

A system provides definitions of network states, and identifies a cause for the anomaly upon detection. A traffic measuring portion (characteristic quantity generating portion) counts the number of packets/time slot classified by traffic type with respect to network traffic, generating a characteristic quantity; a memory portion stores information about the characteristic quantity; a portion calculates correlation coefficients between each pair of characteristic quantities classified by traffic type; a portion generates a histogram from correlation coefficients; a portion for determining the severity of an anomaly based on the histogram; a portion evaluates the similarity of an anomaly of interest to a reference anomaly using the occurrence probabilities of correlation coefficients; and a portion assigns a color to each pixel according to its occurrence probability value, generating an n×n picture. Visualization of network state is achieved using probability distribution vectors derived from correlation coefficients obtained from each characteristic quantities pair.

Description

TECHNICAL FIELD[0001]The present invention relates to a technique for detecting an unauthorized access to a network, which interferes with the security of the network.BACKGROUND ART[0002]In the current internet communication, techniques used by attackers for intrusion and denial of services (DoS) become very exquisite, and new types of worms and viruses appear one after another incessantly, and those rogue programs abuse the available band to put the network communication into disorder or elicit the leakage of information, to pose a big problem in the security of the internet.[0003]In view of this situation, attention has been directed recently to an anomaly-sensitive intrusion detection system (IDS), a system that is tuned for specifically detecting a new type of attack to a network. According to the rationale of this anomaly-sensitive IDS, the normal operation state of a network is defined in advance, and the IDS checks the current state of the network, compares the current state ...

Claims


Application Information

Patent Timeline
Patent Type & Authority Applications(United States)
IPC IPC(8): G06F11/00G06F11/30G06F17/10G06F7/60H04L12/70G06F13/00
CPCH04L63/1458H04L63/1425
Inventor WAIZUMI, YUJITSUNODA, HIROSHINEMOTO, YOSHIAKI
Owner TOHOKU UNIV
Why Eureka
Try Eureka