
System and method for measuring constituent concentration

a technology of constituent concentration and system, applied in the field of system and method for measuring constituent concentration, can solve the problems of inflicting pain on patients, raising possible infections for others,

Inactive Publication Date: 2009-11-05
MITSUBISHI ELECTRIC CORP +1
View PDF5 Cites 59 Cited by
  • Summary
  • Abstract
  • Description
  • Claims
  • Application Information

AI Technical Summary

Benefits of technology

The present invention provides a non-invasive system and method for accurately measuring the concentration of a desired constituent of a specimen, such as glucose concentration in blood. The system measures the reflection coefficient or complex permittivity of electromagnetic waves at two or more frequencies, which are affected by the concentrations of various constituents in the specimen. By measuring the reflection coefficient and complex permittivity at different frequencies, the system can accurately determine the concentration of the desired constituent. This non-invasive approach is particularly useful for early diagnosis and prevention of diabetes, a disease that affects millions of people worldwide.

Problems solved by technology

However, this blood test inflicts much pain on the patient and raises possible risks of infections to the others unless the needle is safely disposed.

Method used


Image

  • System and method for measuring constituent concentration
  • System and method for measuring constituent concentration
  • System and method for measuring constituent concentration

Examples


embodiment 1

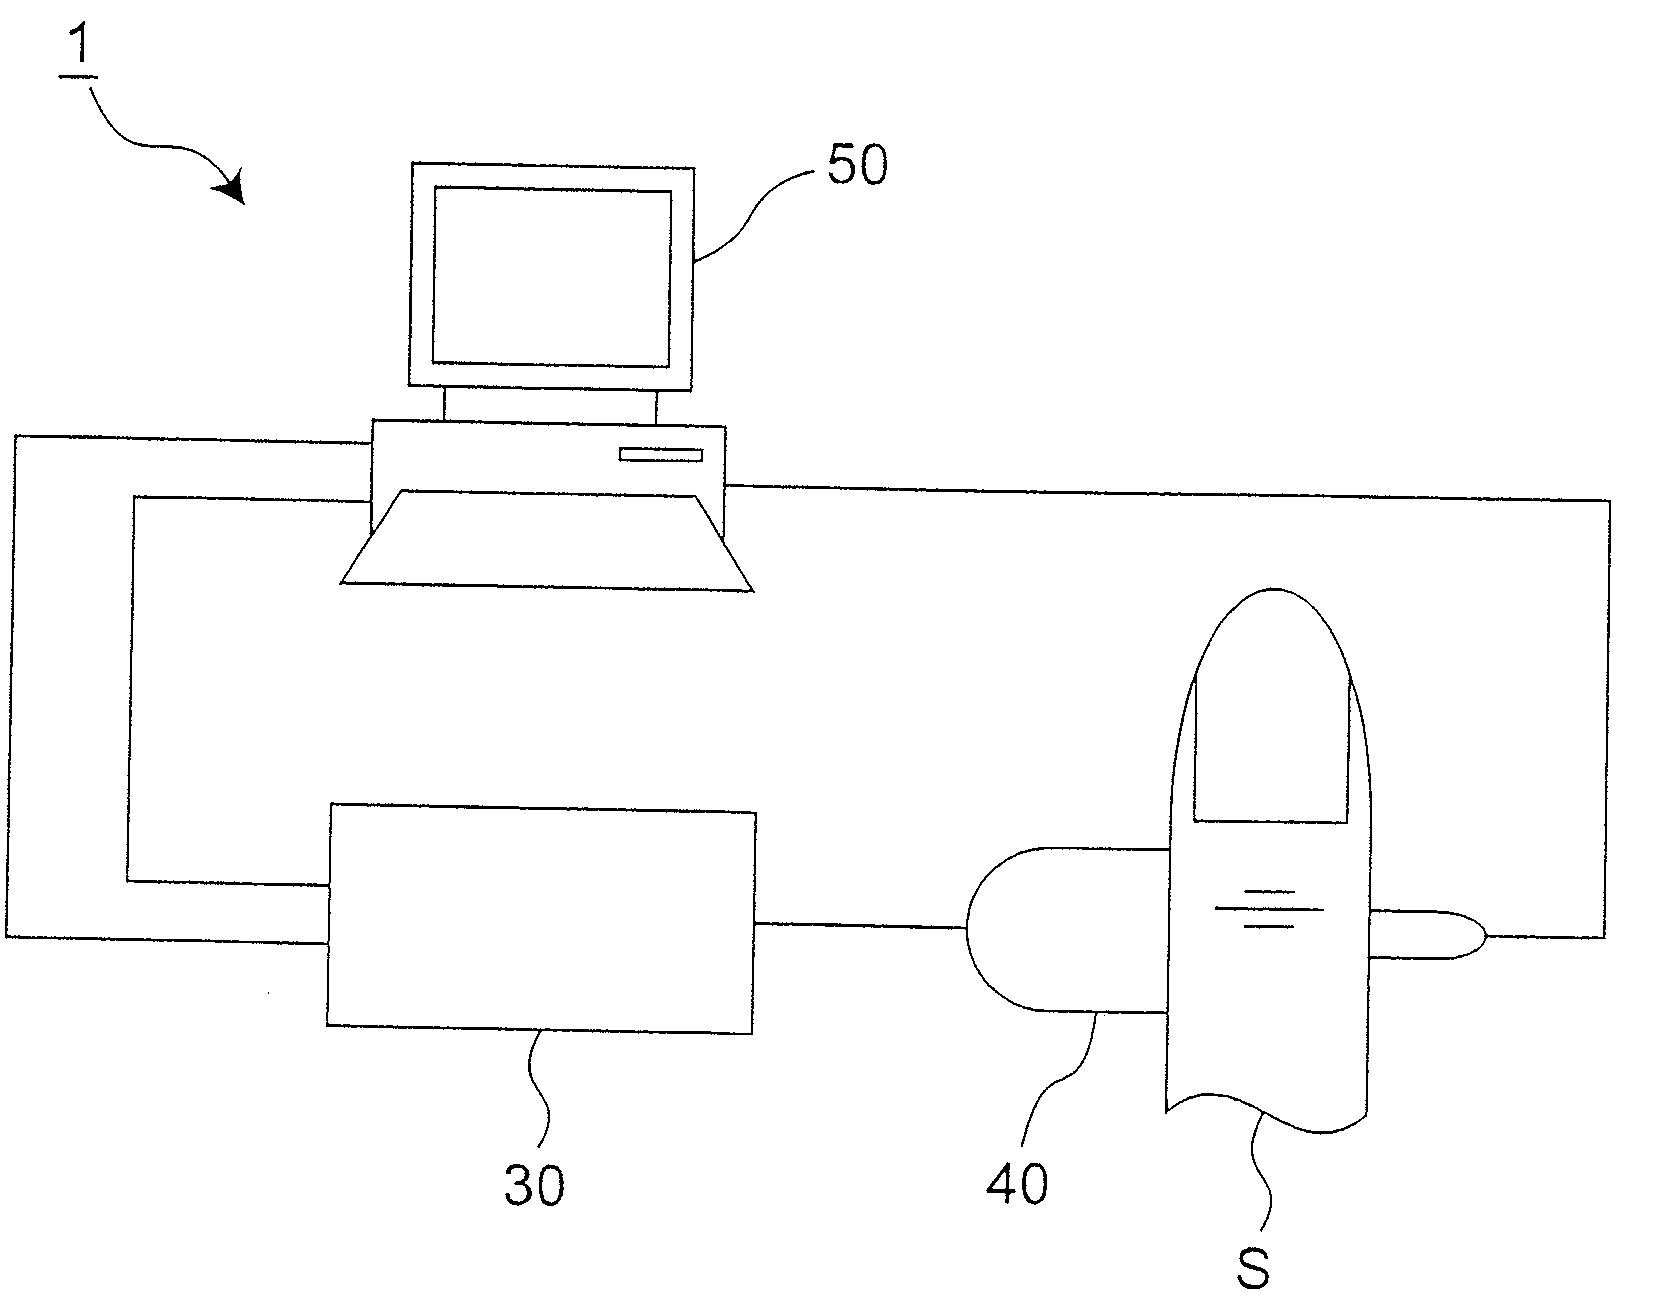
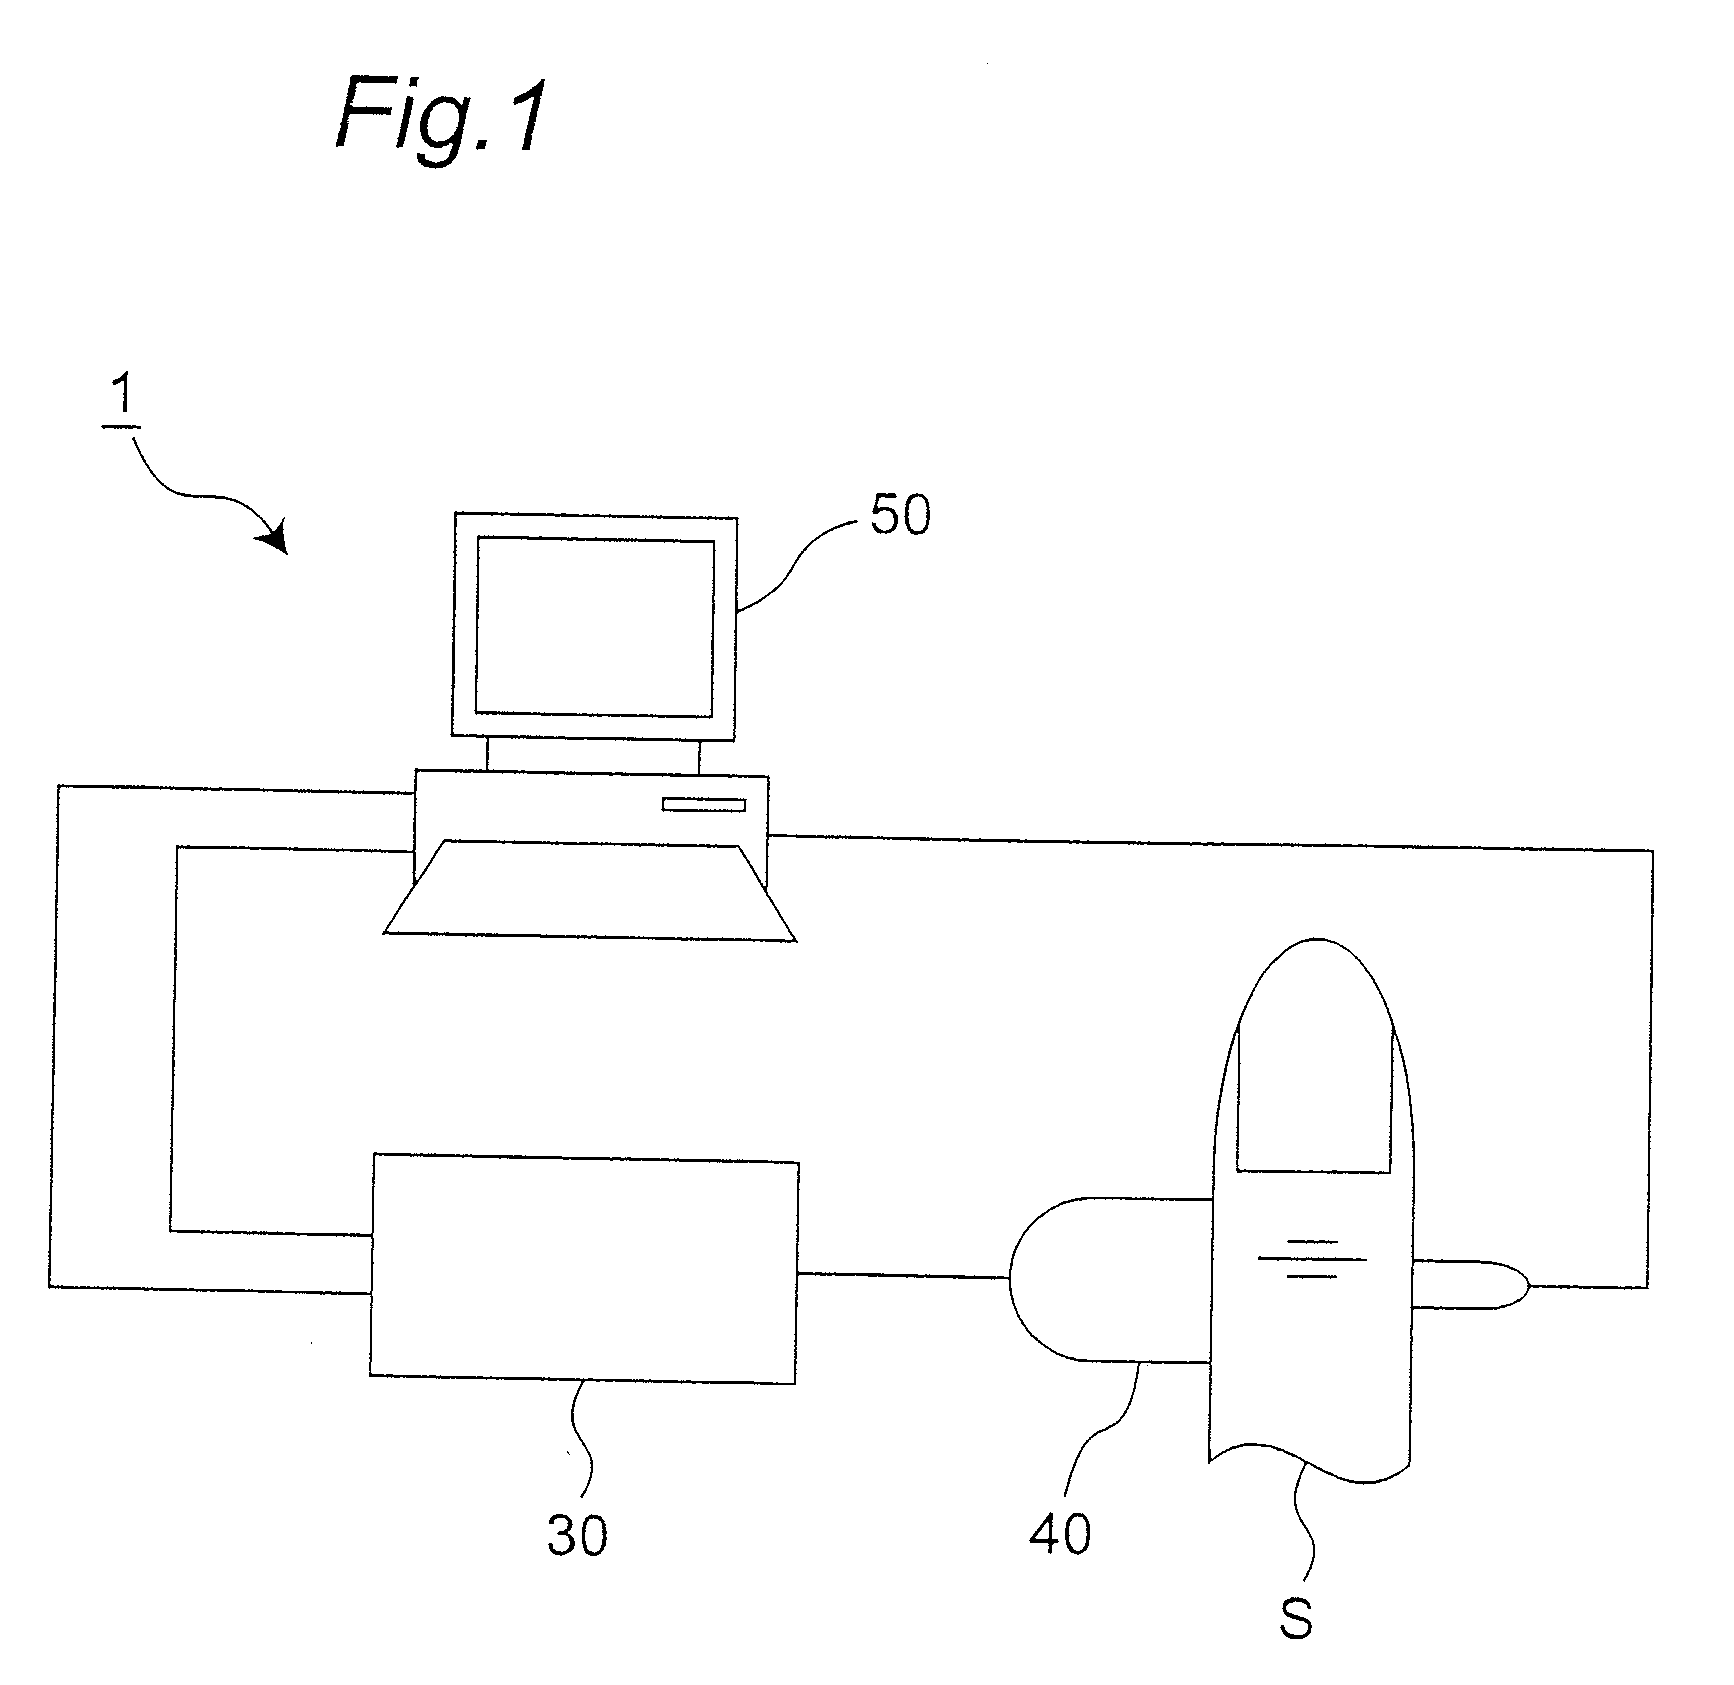
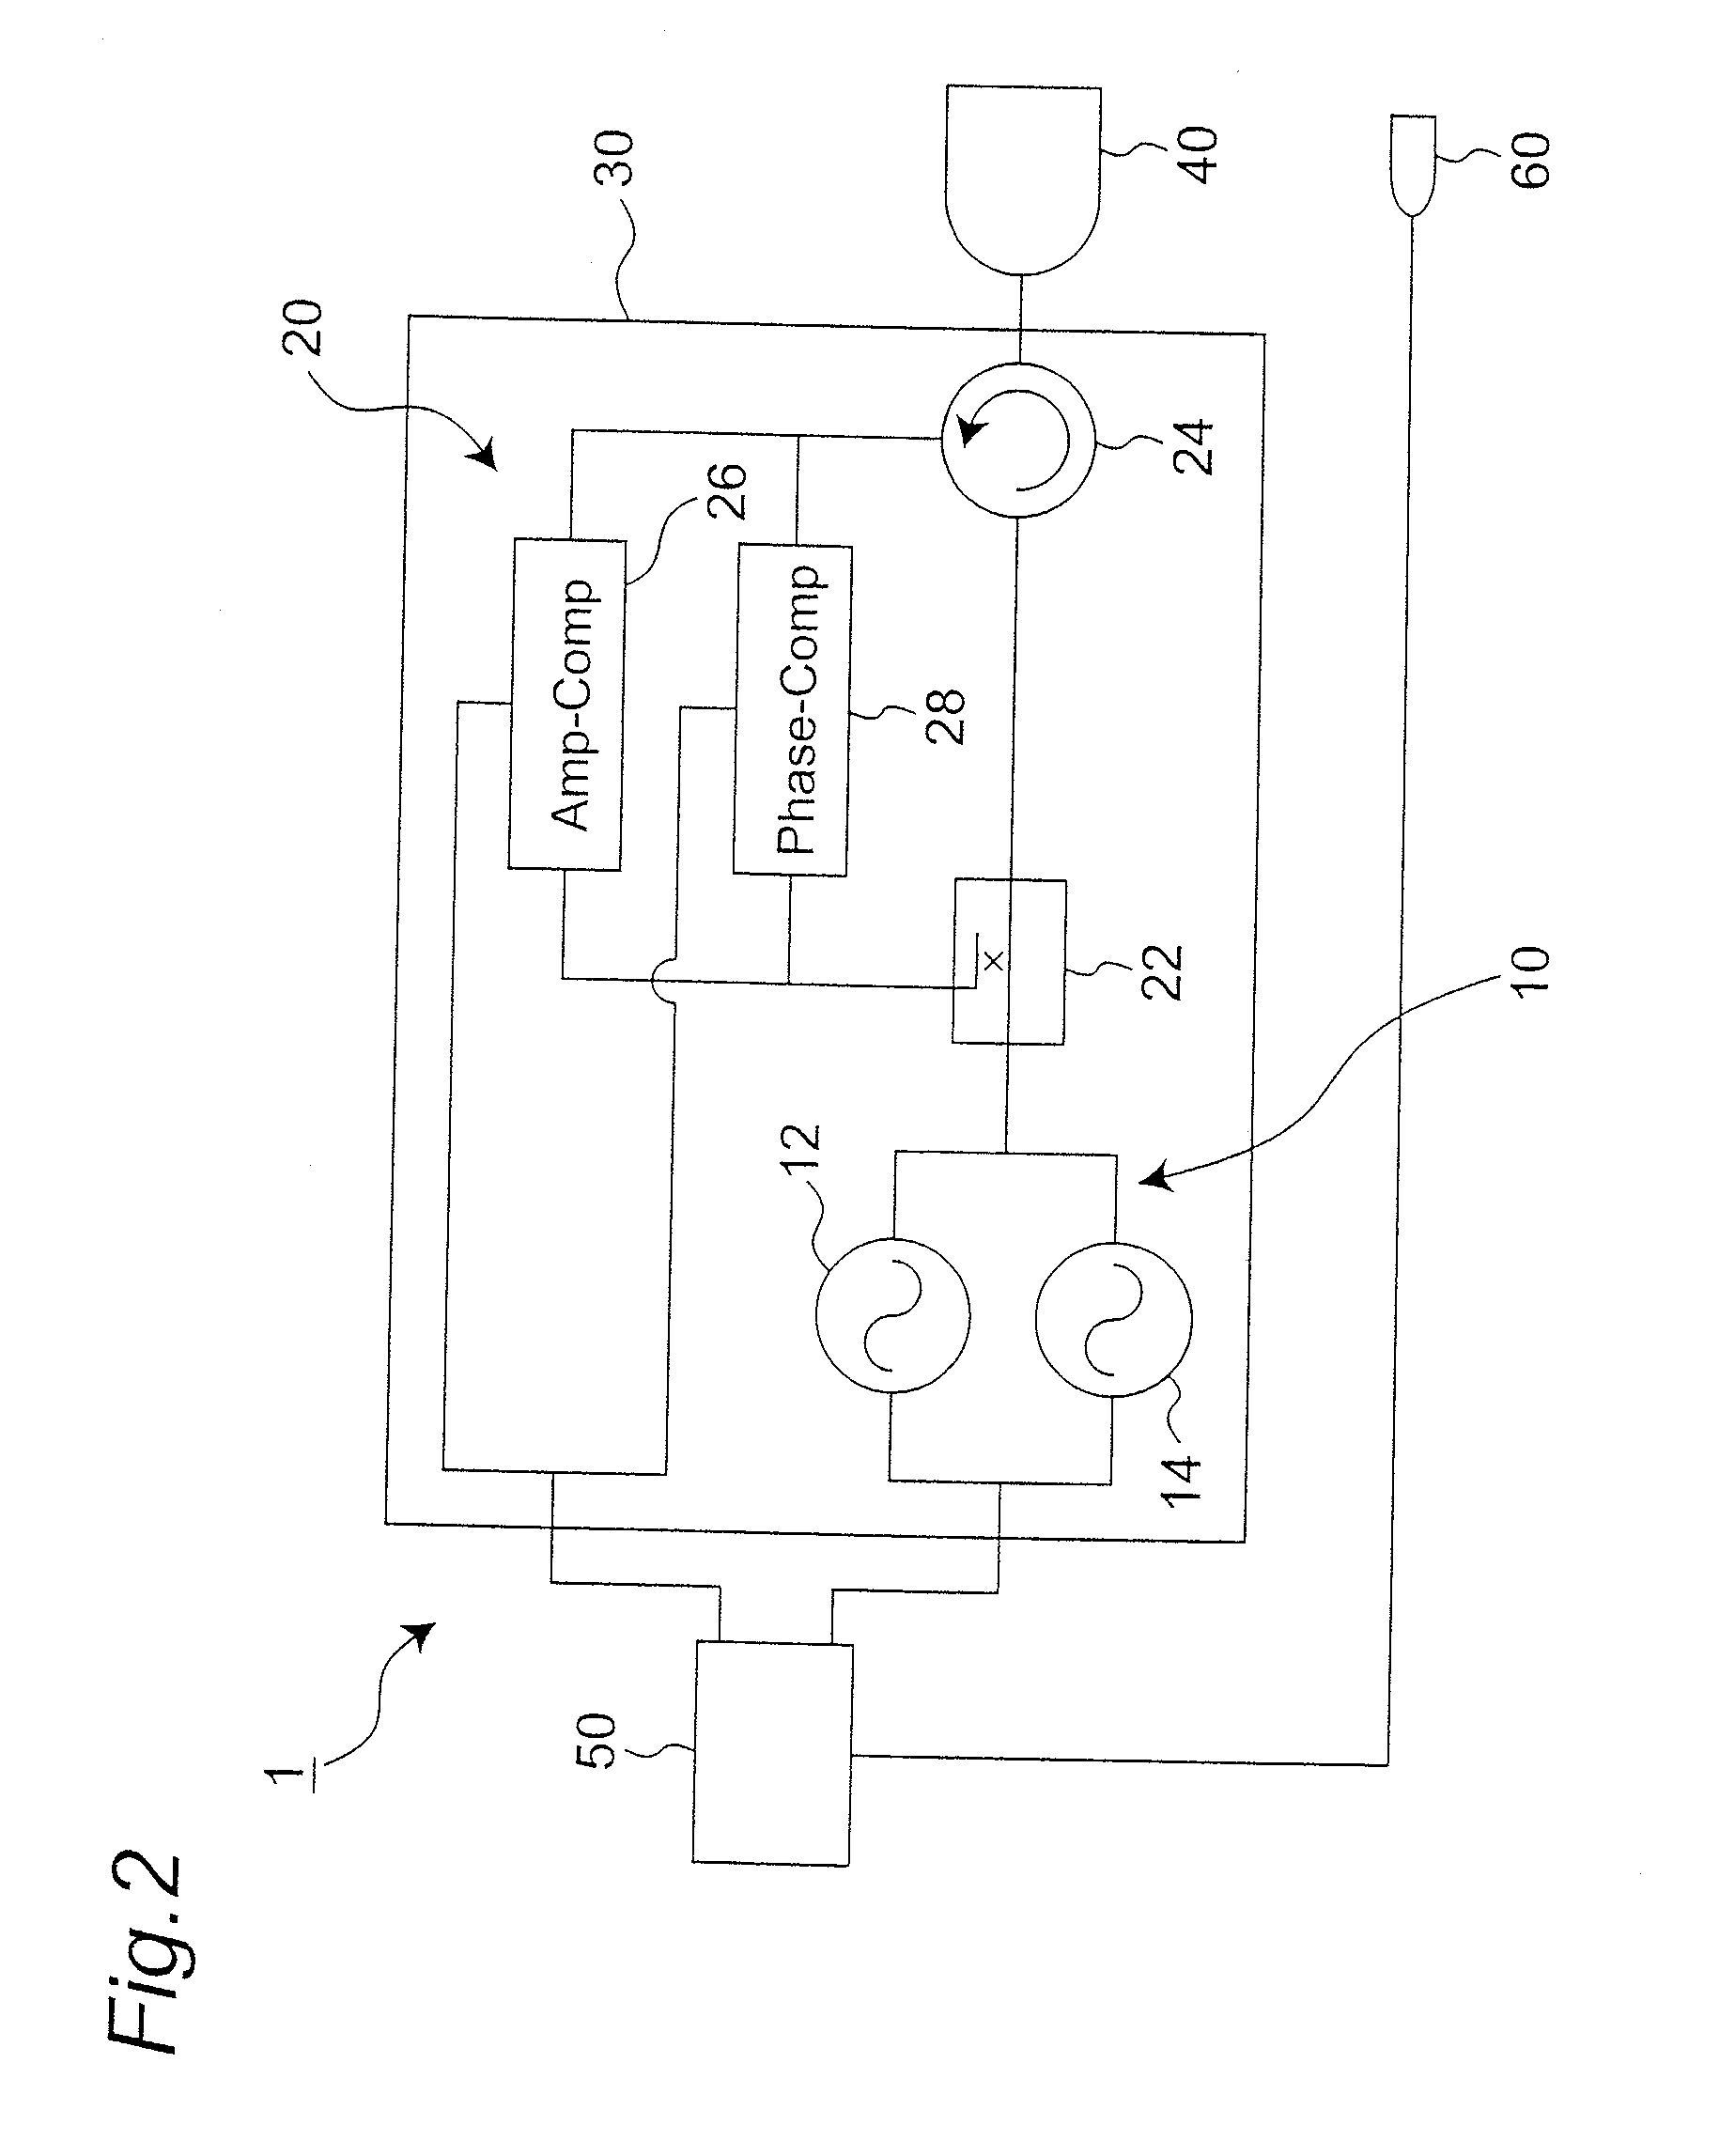
[0048]FIG. 1 is a schematic view illustrating a first embodiment of a measuring system according to the present invention. Also, FIG. 2 is a block diagram illustrating components of the measuring system shown in FIG. 1. The measuring system 1 of FIGS. 1 and 2 generally includes an oscillation-detection apparatus 30, which includes an oscillator 10 outputting an electromagnetic wave having variable frequency between 5 GHz and 300 GHz, towards a specimen (test body) S such as user's finger, and a detector 20 detecting the electromagnetic wave reflected at the specimen S. Also, the measuring system 1 includes a cavity resonator 40 contacting with the specimen S, which is connected to the oscillation-detection apparatus 30, and a processor 50 such as a personal computer for driving the oscillator 10 of the oscillation-detection apparatus 30 and also for processing data signals from the detector 20. Further, the measuring system 1 preferably includes a thermal sensor 60 for measuring tem...

embodiment 2

[0074]Next, a second embodiment of the measuring system according to the present invention will be described herein. The measuring system 2 of the second embodiment has a structure similar to that of the first embodiment except that a complex permittivity (relative permittivity) of the specimen is used, rather than the reflection coefficient, to estimate the serum glucose concentration. Therefore, duplicate description is eliminated for the similar structure. Like reference numerals are used for like components for the present embodiment.

[0075]In general, the reflection coefficient (R) can be expressed by the reflection power (Γ) and the reflection phase (Φ) in the following equation.

R=Γ×exp(i×Φ)

wherein “i” is an imaginary unit.

Also, the complex permittivity (∈) can be expressed as a function of the reflection coefficient (R).

∈=F(R)

Thus, the complex permittivity (∈) can be calculated by measuring the reflection power (Γ) and the reflection phase (Φ). Therefore, as the reflection pow...


PUM


Abstract

A system and method for measuring concentration of a constituent of a specimen are provided. The system includes an oscillator for outputting, towards the specimen, electromagnetic waves having respective different frequencies between 5 GHz and 300 GHz; a detector for detecting the electromagnetic waves that are reflected from the specimen; and a processor measuring at least one of reflection coefficient and complex permittivity of the electromagnetic waves detected and calculating the concentration of the constituent of the specimen based upon at least one of the reflection coefficient measured and the complex permittivity measured.

Description

TECHNICAL FIELD[0001]The present invention relates to a system and method for measuring a concentration of desired constituent of a specimen.BACKGROUND ART[0002]Diabetes is an adult disease, rapidly increasing the serum glucose concentration (blood-sugar level) caused by reduced output of insulin, which often suffers complications such as cardiovascular disorder, cerebral infarction, foot sphacelus, and blindness by retinodialysis. The Ministry of Health, Labour and Welfare of Japan has announced, according to an actual survey of the diabetes in 2002, that about 7.4 million people are “highly suspected”, and about 16.2 million people (i.e., one in about 6.3 Japanese) are undeniably suspected to suffer the diabetes. It is predicted that the number of patients suffering the diabetes is still increasing not only in Japan but also worldwide. Also, since the diabetes itself is an asymptomatic disease until suffering extreme blood-sugar level or serious complications, it is particularly i...

Claims


Application Information

Patent Timeline
Patent Type & Authority Applications(United States)
IPC IPC(8): A61B5/1455
CPCA61B5/14532A61B5/0507
Inventor WATANABE, SHINSUKEINOUE, AKIRAYOSHIDA, HIROSHI
Owner MITSUBISHI ELECTRIC CORP
Learn More