
Electronic trading GUI

a technology of electronic trading and gui, applied in the field of computerized trading systems, can solve the problems of affecting the performance of the market, the price and quantity of the market are rapidly changing, and the transaction cost is sharply reduced, so as to achieve quick and efficient

Inactive Publication Date: 2010-03-04
ARMUTCU ERCAN S
View PDF2 Cites 25 Cited by
  • Summary
  • Abstract
  • Description
  • Claims
  • Application Information

AI Technical Summary

Benefits of technology

[0018]The present invention provides a quick and efficient way to graphically communicate the recent past behaviour of computerized trading system to a trader. In accordance with the principles of the present invention, a graphical user interface for computer trading is provided. A display represents best bid (buy) and best ask (offer) prices for an execution venue, with one axis of the display representing available prices, and another axis of the display representing time. The display comprises a sell area, a bid-ask spread, and a buy area. The boundary of the sell area and the bid-ask spread represents best ask (offer) price for the execution venue, and the boundary of the buy area and the bid-ask spread represents best bid (buy) price for the execution venue. First indicium on the display represents order executions and second indicium on the display represents posted orders. The first indicium has a position, a size, and a colour, with the position representing the time and price of the execution, the size representing the size or quantity of the execution, and the colour representing execution type and venue. The second indicium also has a position, a size, and a colour, with the position representing the price of the order; the size representing the duration of the order, and the colour of the second indicium representing the order type and venue. The second indicium further comprises a transparency representing the size or the quantity of units of the order.

Problems solved by technology

The lack of manual intervention required to trade has led to a sharp decline in transactions costs, both in the form of exchange and processing fees as well as brokerage fees.
On a trading screen, this results in rapid changes in the price and quantity within the market.
If a trader intends to enter an order at a particular price, but misses the price because the market prices moved before she could enter the order, she may experience a significant loss.
As market fragmentation continues to increase (e.g., there are at least 35 potential execution venues for U.S. equities), and as new alternative trading systems (ATSs) enter what appears to be an already overcrowded U.S. equities market, it becomes increasingly challenging to keep track of executions and orders posted on different venues by computerized trading systems.
In today's electronic markets, a trader lacking a technologically advanced interface is at a severe competitive disadvantage.
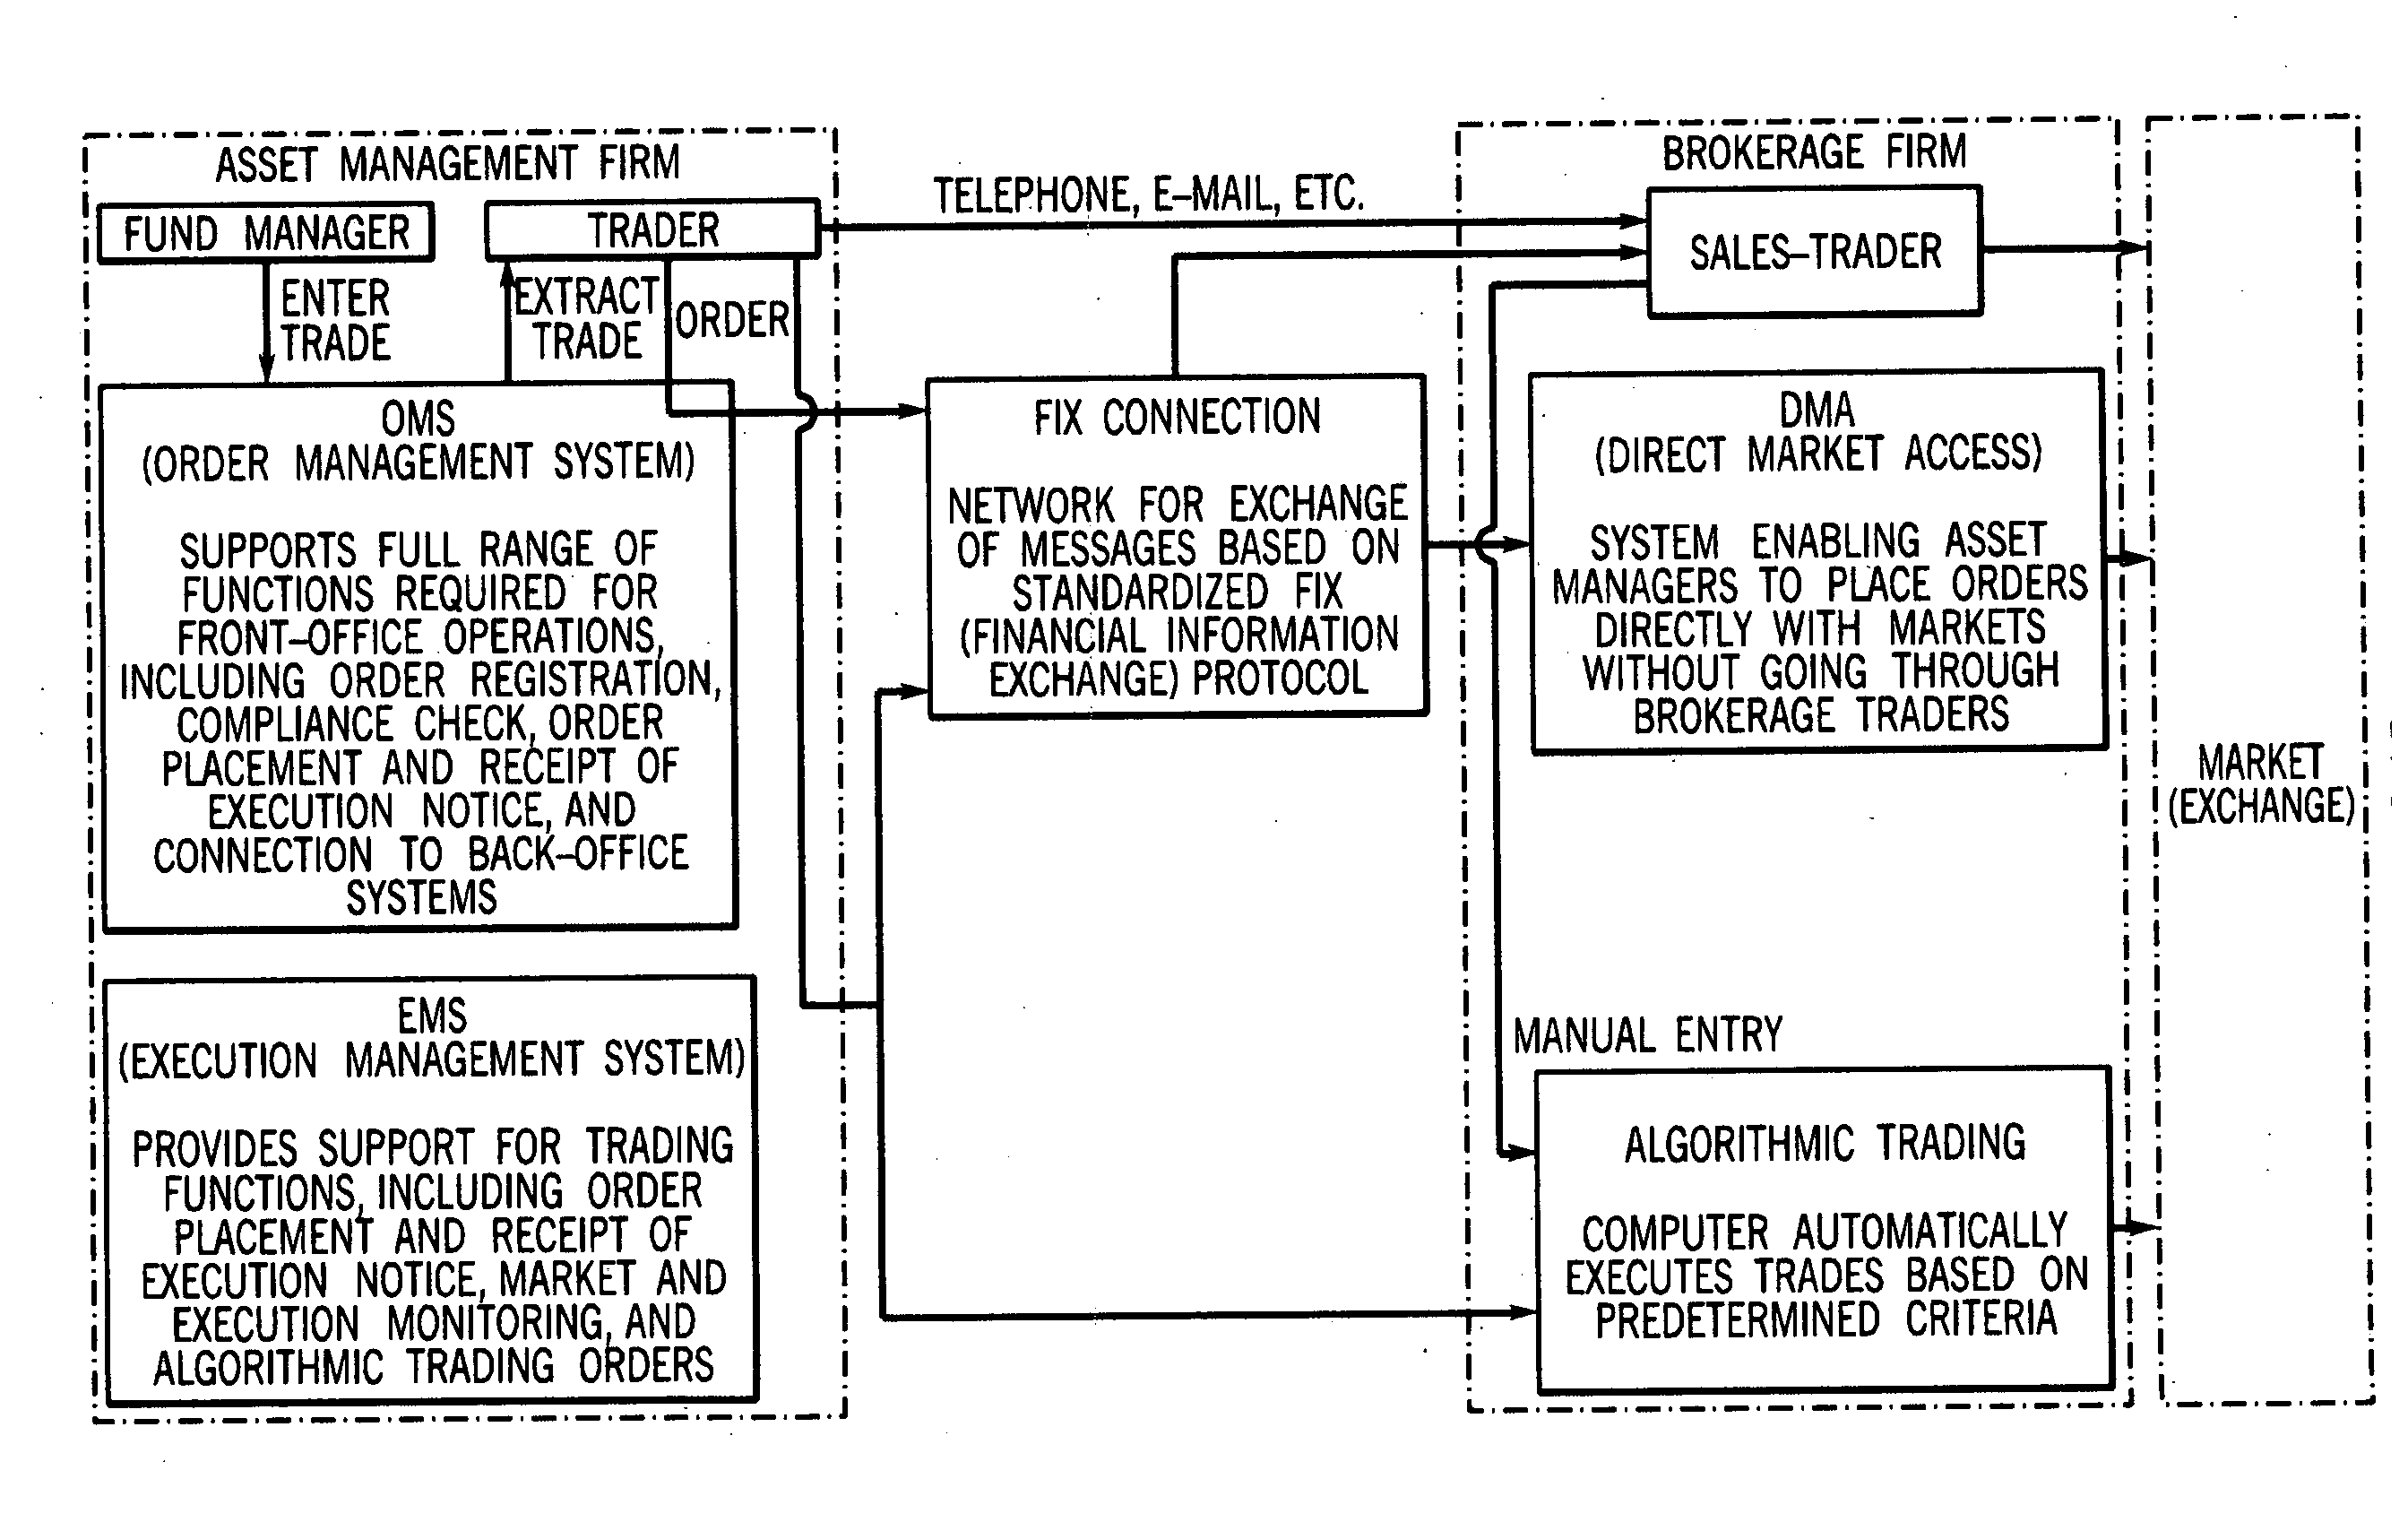
An OMS includes a “front end” (i.e., user interface) for entering and displaying order-type data as well as a “back end” (e.g., database) for storing and maintaining the underlying data; however, OMSs or EMSs do not typically include any pre-programmed instructions for buying or selling shares in a systematic way.
Columns contain different performance metrics; although this is fine for getting snapshot information, it is not sufficient if one wants to understand the recent past behaviour of the computerized trading system—for example, what the computerized trading system did one hour ago—as this information might be updated in the spread sheet format.
Even if there were ways to drill down in the spread sheet to get at past behaviour information, this would be time consuming, and most of the time, traders typically just want to get a ‘lay of the land’ view to see that the computerized trading system is on course in its execution trajectory.
Prior art EMSs or OMSs do not provide an intuitive way to graphically visualize computerized trading system behaviour to give traders this ‘lay of the land’ view of computerized trading system behaviour / performance.
While there are a plethora of graphical user interfaces (GUIs) in the market for trading, these existing GUIs do not do a good job of graphically communicating the recent past behaviour of computerized trading system to a trader.
), these surveillance systems do not differentiate computerized trades from human originated trades, convey far less information than a trader seeks, and do not operate in the time constraints of real-time traded market.

Method used


Image

  • Electronic trading GUI
  • Electronic trading GUI
  • Electronic trading GUI

Examples


Embodiment Construction

[0028]Referring to FIG. 3, a non-limiting example of a high level implementation that can be used to run a system of the present invention is seen. The infrastructure should include but is not limited to: wide-area network connectivity; network infrastructure; an operating system such as for example Redhat Linux Enterprise Linux AS Operating System available from Red Hat, Inc., 1801 Varsity Drive, Raleigh, N.C.; appropriate network switches and routers; electrical power (backup power); network backup hardware and software.

[0029]The match engine and administrative applications server can run for example on a Dell PowerEdge 2950 server with Single Processor, Dualcore Intel Xeon 5140 with 2.33 GHz, 1333 MHz FSB, 4 GB of RAM, 2×146 GIG Serial Attached SCSI Drives, Raid 1, available from Dell, Inc., One Dell Way, Round Rock, Tex. 78682. The database server can be run for example on an Dell PowerEdge 2950 server with Single Processor, Dualcore Intel Xeon 5140 with 2.33 GHz, 1333 MHz FSB, ...


PUM


Abstract

In accordance with the principles of the present invention, a graphical user interface for computer trading is provided. A display represents best bid and best ask prices for an execution venue, with one axis representing available prices, and another axis representing time. The display includes a sell area, a bid-ask spread, and a buy area. The boundary of the sell area and the bid-ask spread represents best ask price for the execution venue, and the boundary of the buy area and the bid-ask spread represents best bid price for the execution venue. First indicium on the display represents order executions and second indicium on the display represents orders. The position of the first indicium represents the time and price of the execution, the size represents the size or quantity of the execution, and the colour represents execution type and execution venue. The position of the second indicium represents the price of the order; the size represents the duration of the order, and the colour represents the order type and posted exchange venue. The second indicium can further comprise a transparency representing the size of the order.

Description

FIELD OF THE INVENTION[0001]The present invention relates to computerized trading systems.BACKGROUND OF THE INVENTION[0002]At one time, there were only open-outcry exchanges where brokers and traders, or more specifically buyers and sellers, would come together to trade in person. More recently, electronic exchanges that process automatic and electronic matching of bids and offers have been introduced. Thus, trading methods have evolved from a manually intensive process to a technology enabled, electronic platform.[0003]Many exchanges throughout the world implement electronic trading in varying degrees to match buyers and sellers of tradeable objects, where a tradeable object refers simply to anything that can be traded. Tradeable objects may include, but are not limited to, all types of traded financial products, such as, for example, stocks, options, bonds, futures, currency, and warrants, as well as funds, derivatives, and collections of the foregoing, and all types of commoditie...

Claims


Application Information

Patent Timeline
IPC IPC(8): G06Q40/00G06F3/00
CPCG06Q40/04
Inventor ARMUTCU, ERCAN S.
Owner ARMUTCU ERCAN S
Learn More